
F.13 MODULE—FIRST ORDER NON-LINEAR SELF-REFERENCING—FLOWING OUT
F.13.1 General Description
This goal setting module is self-referencing, the reference level being set by Maximum Possible Value of ‘S’, which is applied as an exogenous constraint. For example, this might be a consequence of finite capacity of an area to sustain a population. The actual state variable ‘S’ STATE OF THE SYSTEM is continually monitored as a measure of relative density, that is, Actual ‘S’ Divided by Maximum ‘S’. This indicates proximity of actual state to maximum possible. In self-referencing systems, whose typical behaviour over time is shown in Figure F13-2, the system is highly sensitive to the maximum possible value of S.
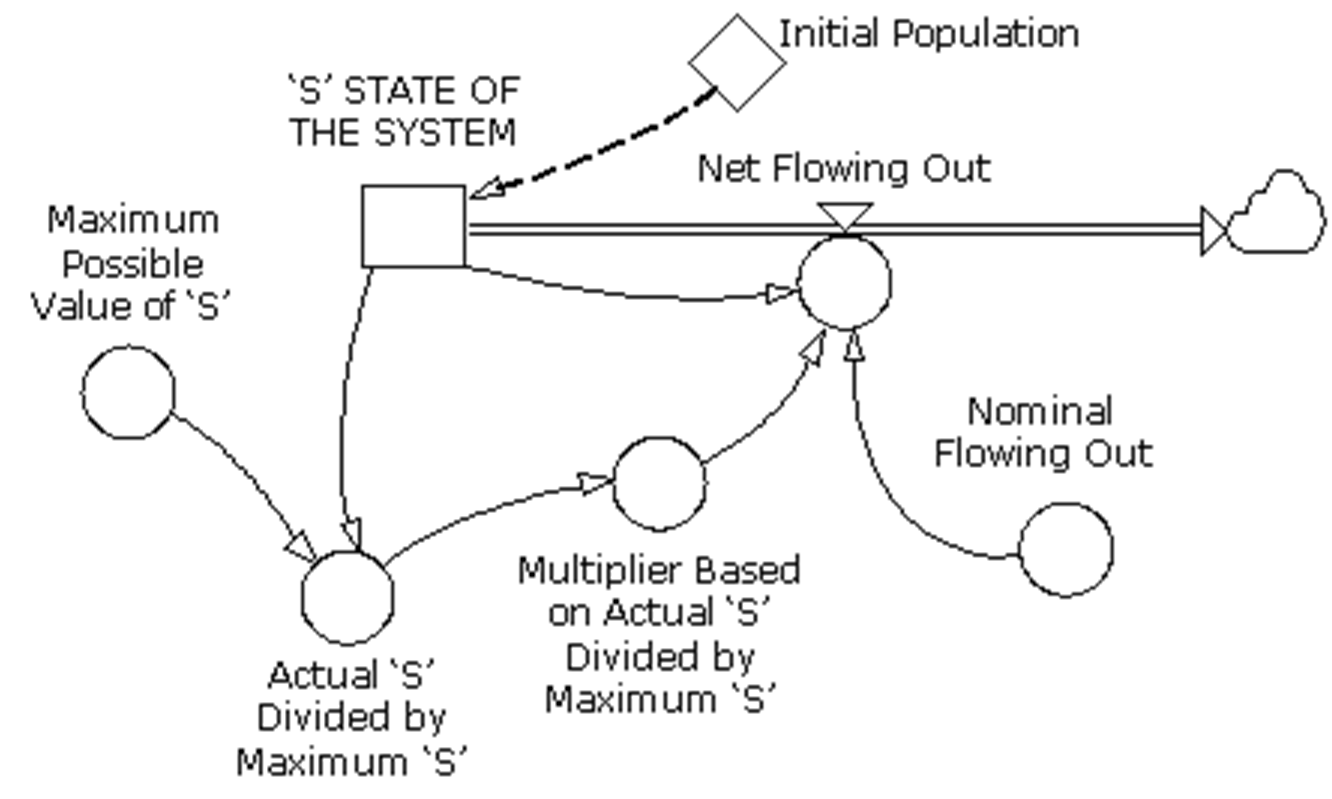
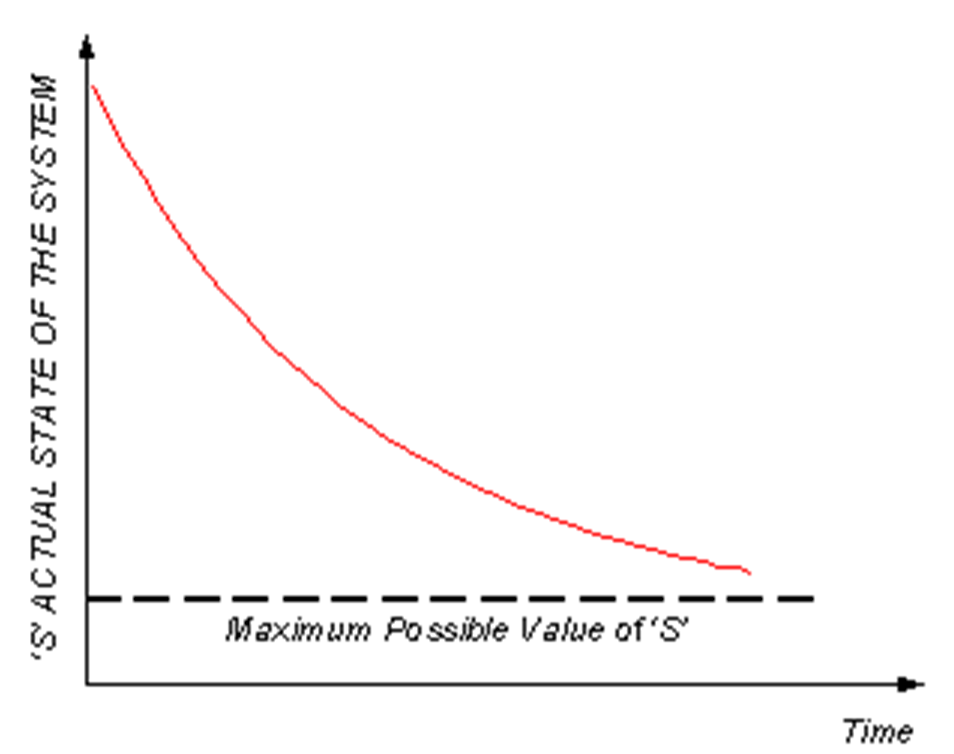
As that value is approached the value of Multiplier Based on Actual ‘S’ Divided by Maximum ‘S’ escalates dramatically. The direct consequence of this is that the value of Flowing Out (which is a product of Nominal Rate of Flowing Out and Multiplier Based on Actual ‘S’ Divided by Maximum ‘S’ ) escalates just as dramatically, and the stock ‘S’ STATE OF THE SYSTEM is rapidly depleted. The value of Flowing Out, the rate at which contributions to S are made is sensitive to its constrained maximum value.
F.13.2 Influence Diagram Representation
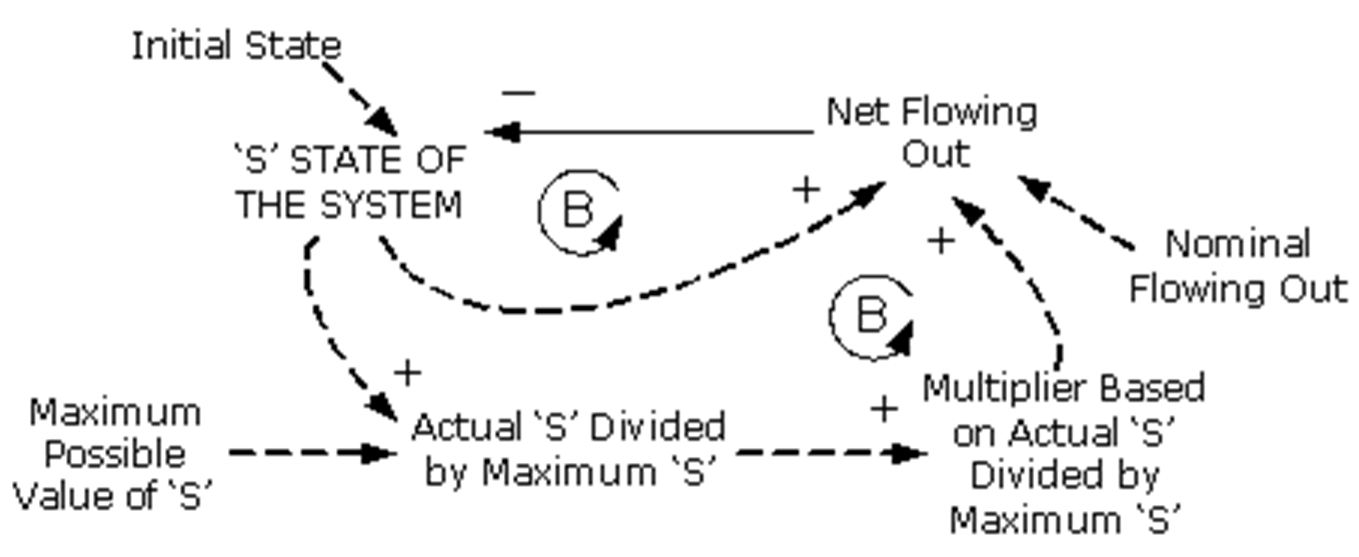
The influence diagram representation of this module is shown in Figure F13-3.
F.13.3 Reference Source
Further details, in relation to this module as part of the non-linear first order system producing S-shaped growth, are provided by Sterman (2000: 285-288).
F.13.4 Application
By itself this module serves to explain how feedback structure can regulate the state of a first-order system. This has significant implications for sustainability and resource-limited systems.
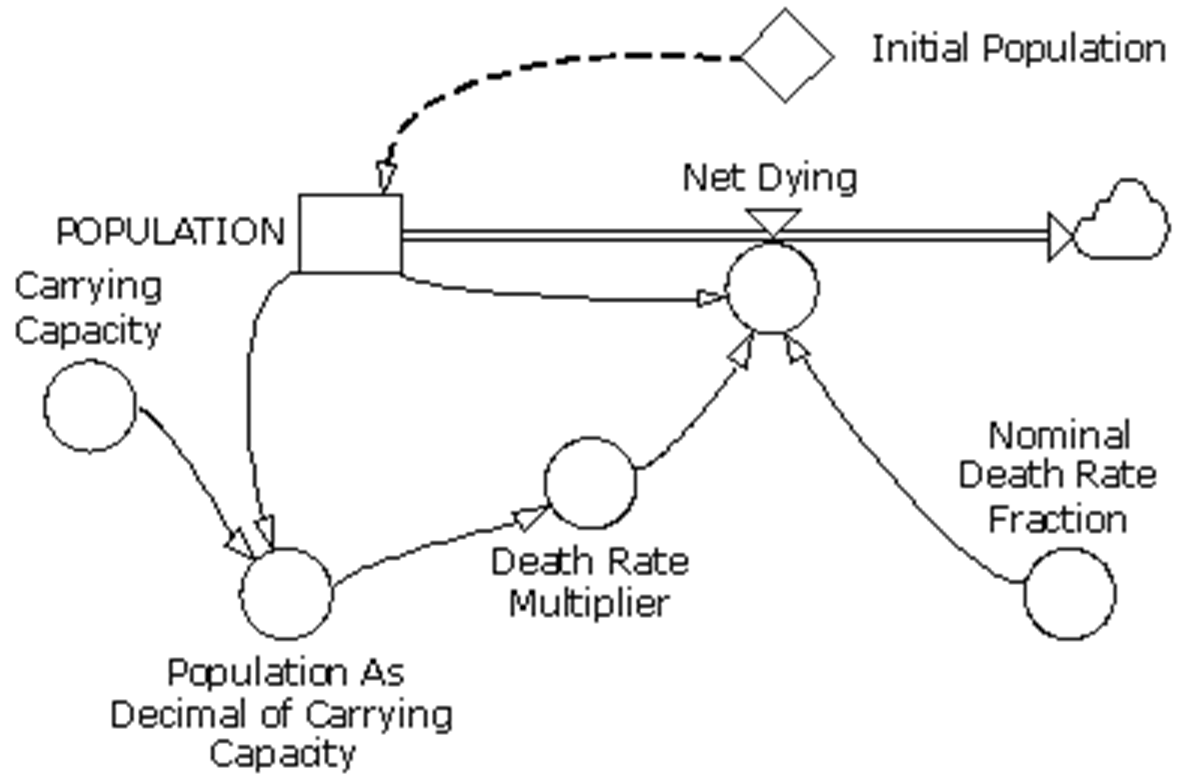
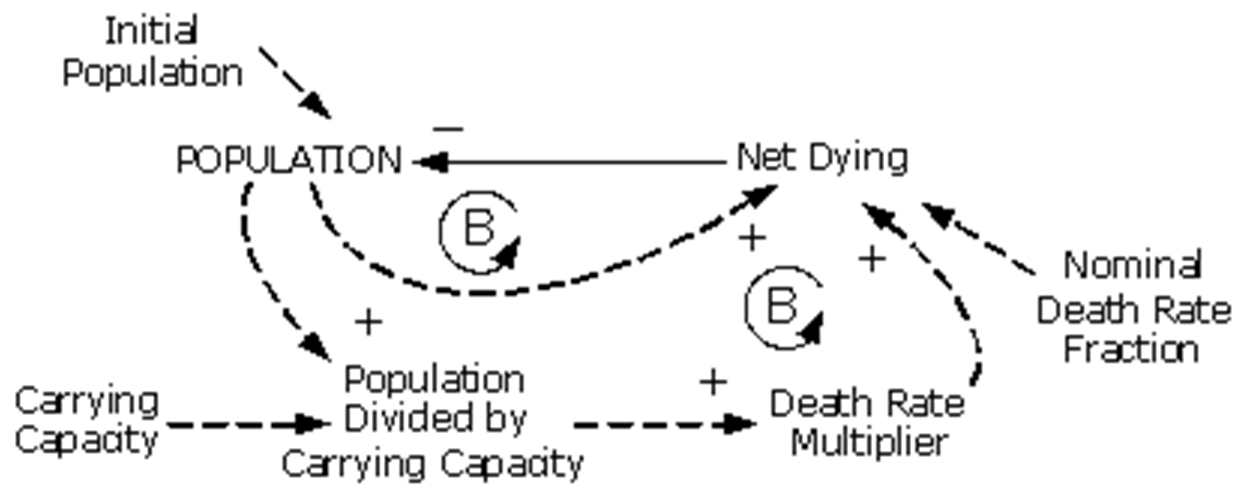
It is most frequently given as an example of behaviour of populations. A population example is depicted in Figure F13-4, where POPULATION directly influences population density which is measured as a decimal fraction of Carrying Capacity using the variable Population as Decimal of Carrying Capacity. Carrying Capacity is limited by space or area. Hence, the capacity to sustain the population is limited by an externally applied constraint (or exogenous factor). The variable Birth Rate Multiplier has that characteristic that for small values of Population as Decimal of Carrying Capacity it takes on values close to 1.0, but as the value of Population as Decimal of Carrying Capacity rises Birth Rate Multiplier drops off sharply to be zero when Population as Decimal of Carrying Capacity reaches 1.0. Net Birthing remains near the Birth Rate Multiplier until POPULATION approaches Carrying Capacity when it reduces dramatically. As time passes the POPULATION approaches Carrying Capacity more slowly.
The equivalent influence diagram is shown in Figure F13-5.
F.13.5 Functional Description
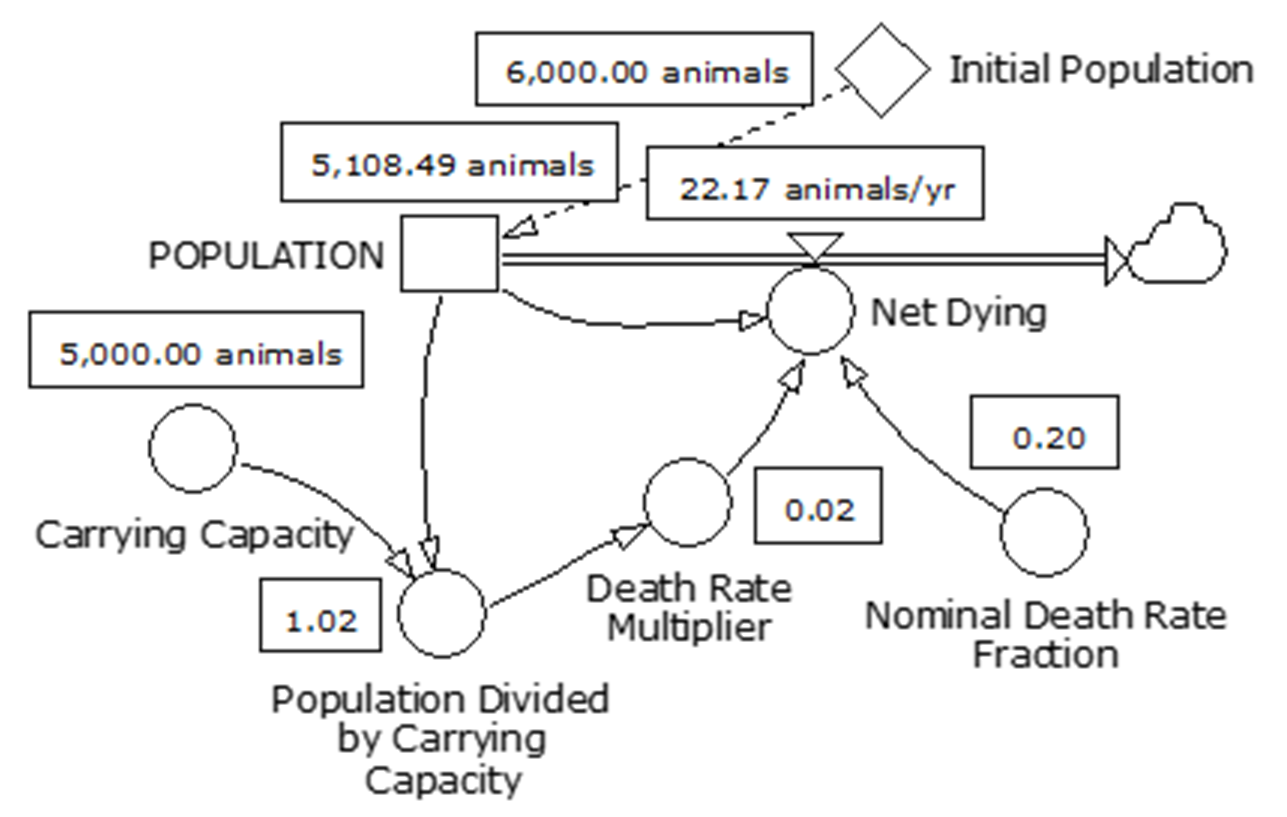
The functions of the variables contained in the module depicted in Figures F13-4 and F13-5 are described in Table F13-1.
The summary results of running a simulation of the POPULATION module over a 10-year period using a 1-month time-step appear at Figure F13-7.
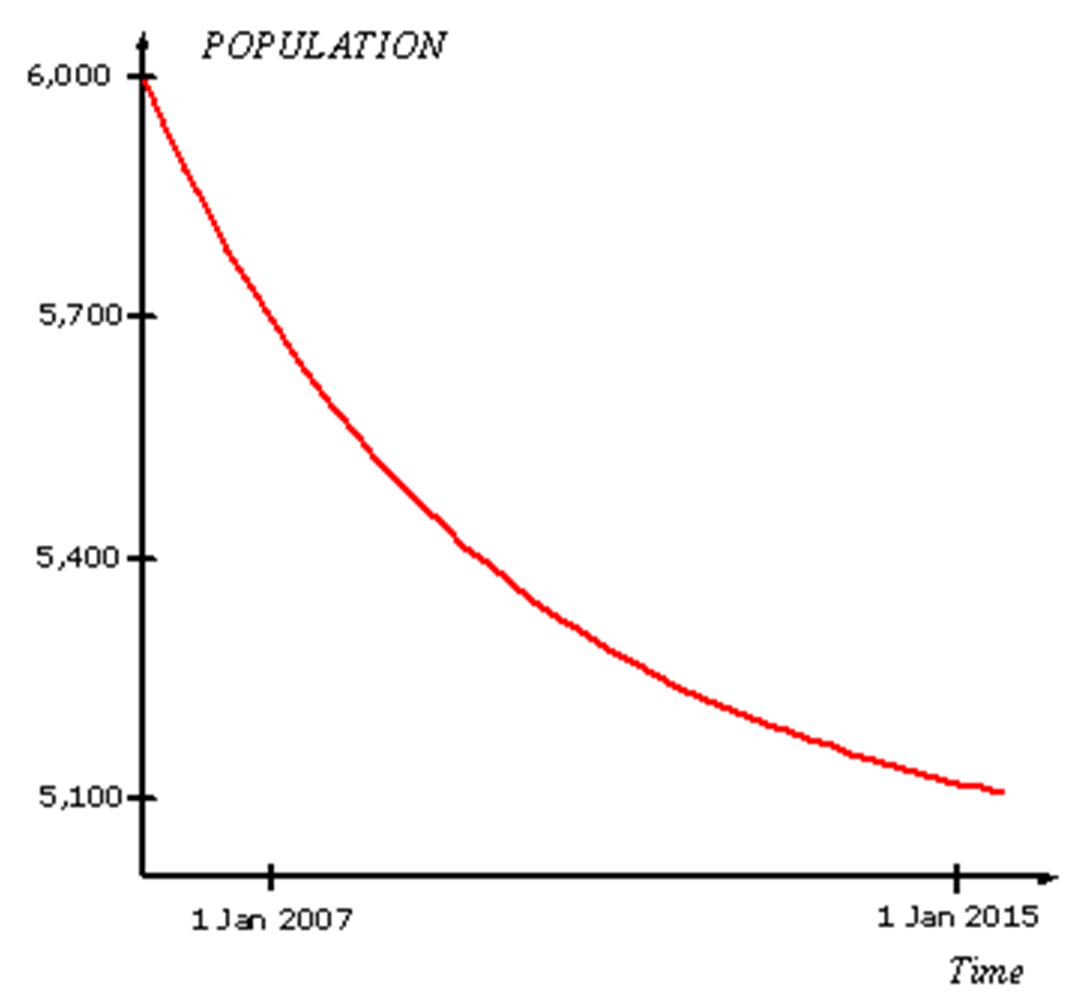
Graph of POPULATION over the simulation is shown at Figure 13-8.
Table F13-1. Functional Description—First-order Non-linear Self-referencing—Flowing Out—POPULATION
Variable | Function | Comment |
|---|---|---|
Initial Population | 6000 | Units: <<animals>>. |
POPULATION | Initial Population | Units: <<animals>>. Initial Population – dt * (Net Birthing) |
Net Birthing | 'Nominal Birth Rate Fraction' * 'Fraction of Nominal Birth Rate' * POPULATION/1<<yr>> | Units: <<animals/yr>>. |
Nominal Birth Rate Fraction | 0.20 | Dimensionless |
Carrying Capacity | 5000 | Units: <<animals>>. |
Population Divided by Carrying Capacity | POPULATION/'Carrying Capacity' | Dimensionless |
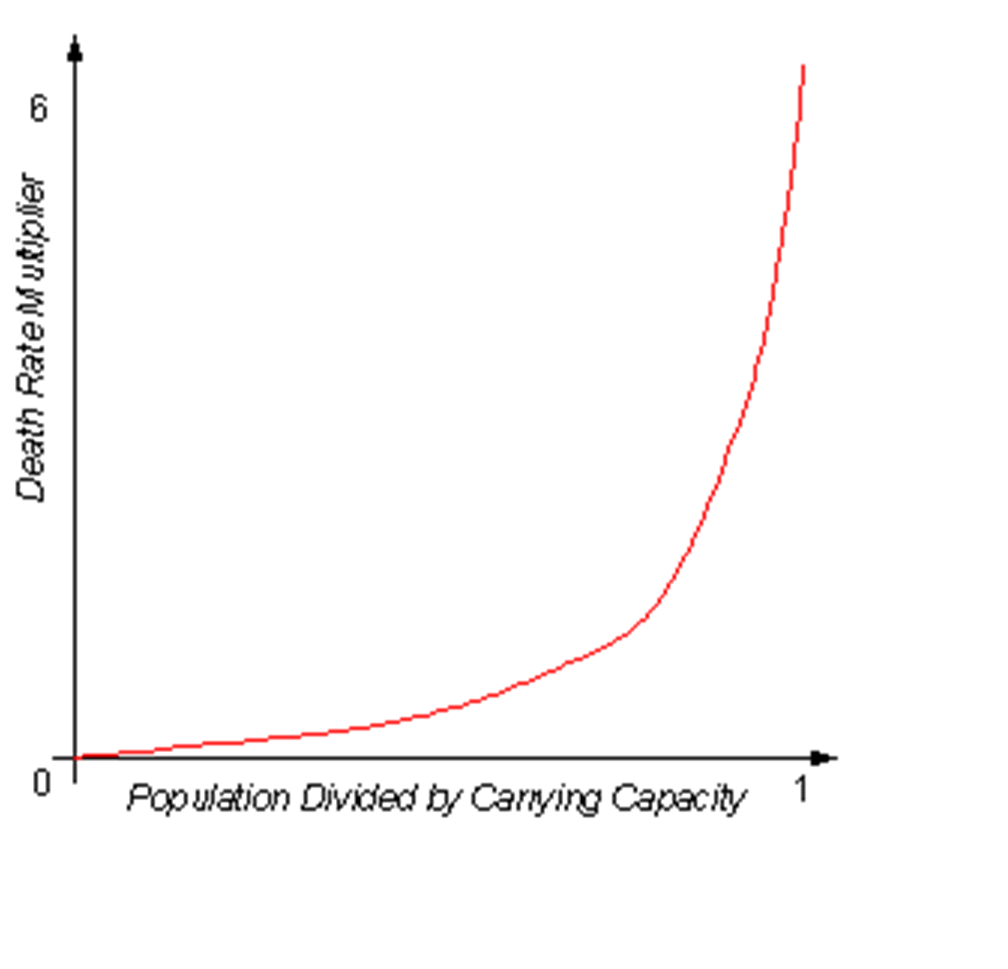
Death Rate Multiplier | (GRAPH(('Population Divided by Carrying Capacity') 0.0,0.1,{0.0,0.1,0.2,0.4,0.8,1.6,3.2,6.4})) | See graph at Figure F13-6. |
References
- Sterman, J.D., 2000, Business Dynamics: Systems Thinking and Modelling for a Complex World, Irwin McGraw-Hill.