
3.1.3 Solution By Graphical Integration Method
Rates of inflow and outflow are depicted graphically in Figure 3-9. The method of graphical integration involves calculating the area under each of the Flowing In and Flowing Out curves for each increment of elapsed time. Graphical integration is normally conducted using squared graph paper with graphs drawn to scale. In the simplest form the scale is chosen to enable the squares to be counted to return a direct measure of area, where the area under each curve give us the influences on the state variable BATHTUB produced by the (flow) rate variables Flowing In and Flowing Out. Alternatively, simple trigonometry is used to calculate the areas.
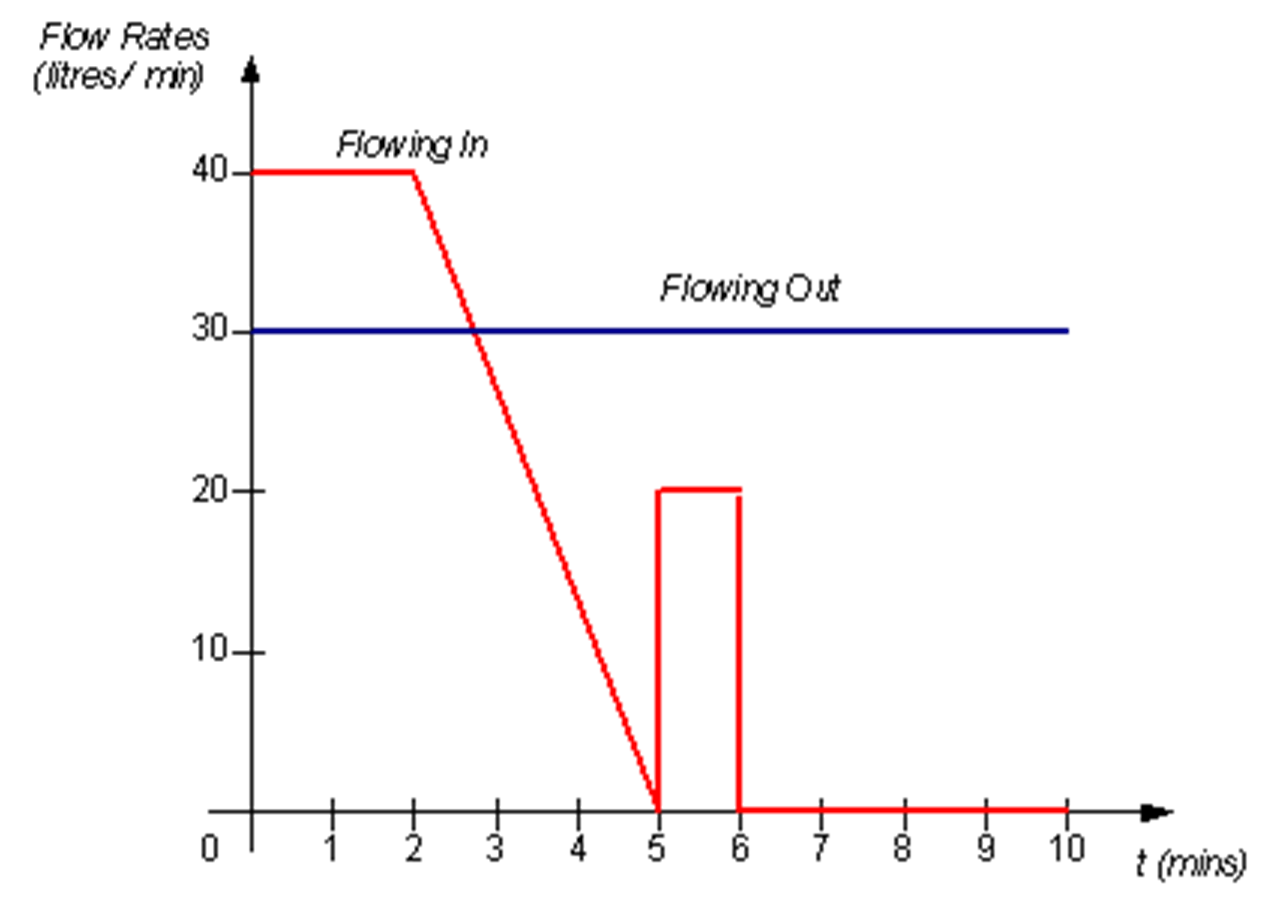
Starting with the individual graphs for each of the flow rates, the areas under the curves are calculated and the values of each influence on the state variable BATHTUB are then plotted on a new graph.
Assume that the increment of time (delta time, dt) for these calculations is one minute. Choosing dt leads to defining a series of equal-width vertical slices. Each area of interest is bounded by the edges of these slices, the time axis and the curve which defines the rate variable. This is depicted in Figure 3-10.
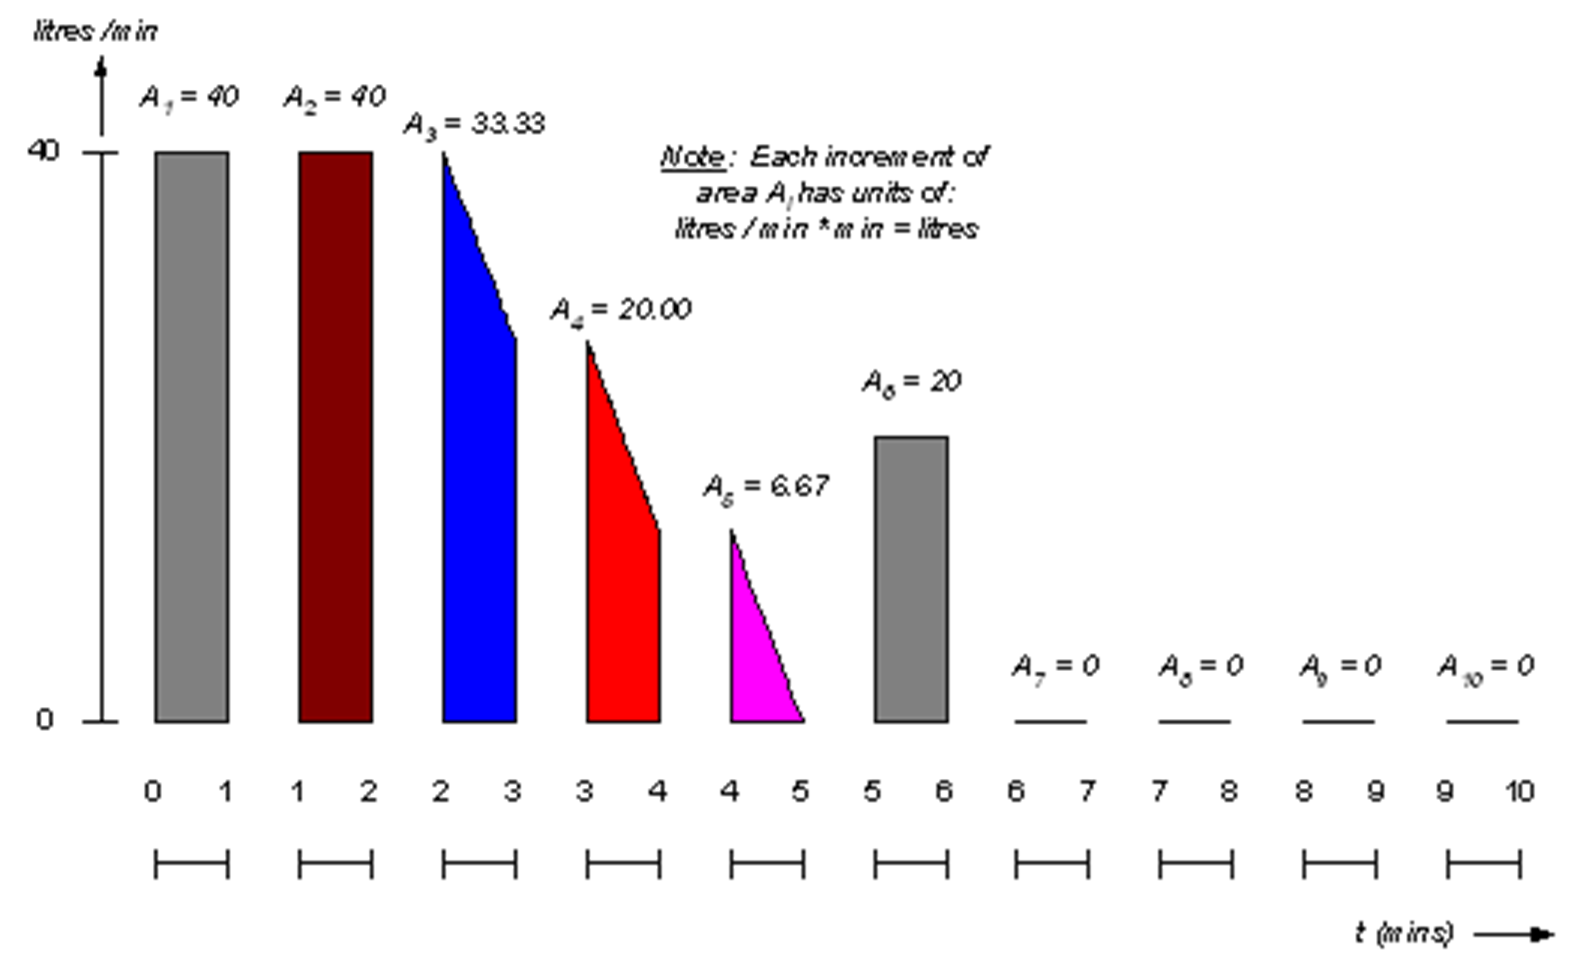
Flowing In is calculated first, taking into account the initial contents of BATHTUB. Flowing Out is then subtracted. For each increment of time (dt = 1 min), the state of the system (that is, the amount of water in the bathtub at any time) is calculated as follows:
- In the first instance: Initial Contents of BATHTUB
+ dt * Initial Value of Flowing In
– dt * Initial Value of Flowing Out - Thereafter: Contents of BATHTUB at completion of preceding calculation
+ dt * Current Value of Flowing In
– dt * Current Value of Flowing Out
Calculations should halt when either the bathtub overflows or becomes empty, otherwise when 10 minutes have elapsed.