4.2.16 Managing Achievement Of Planned 2% Population Growth
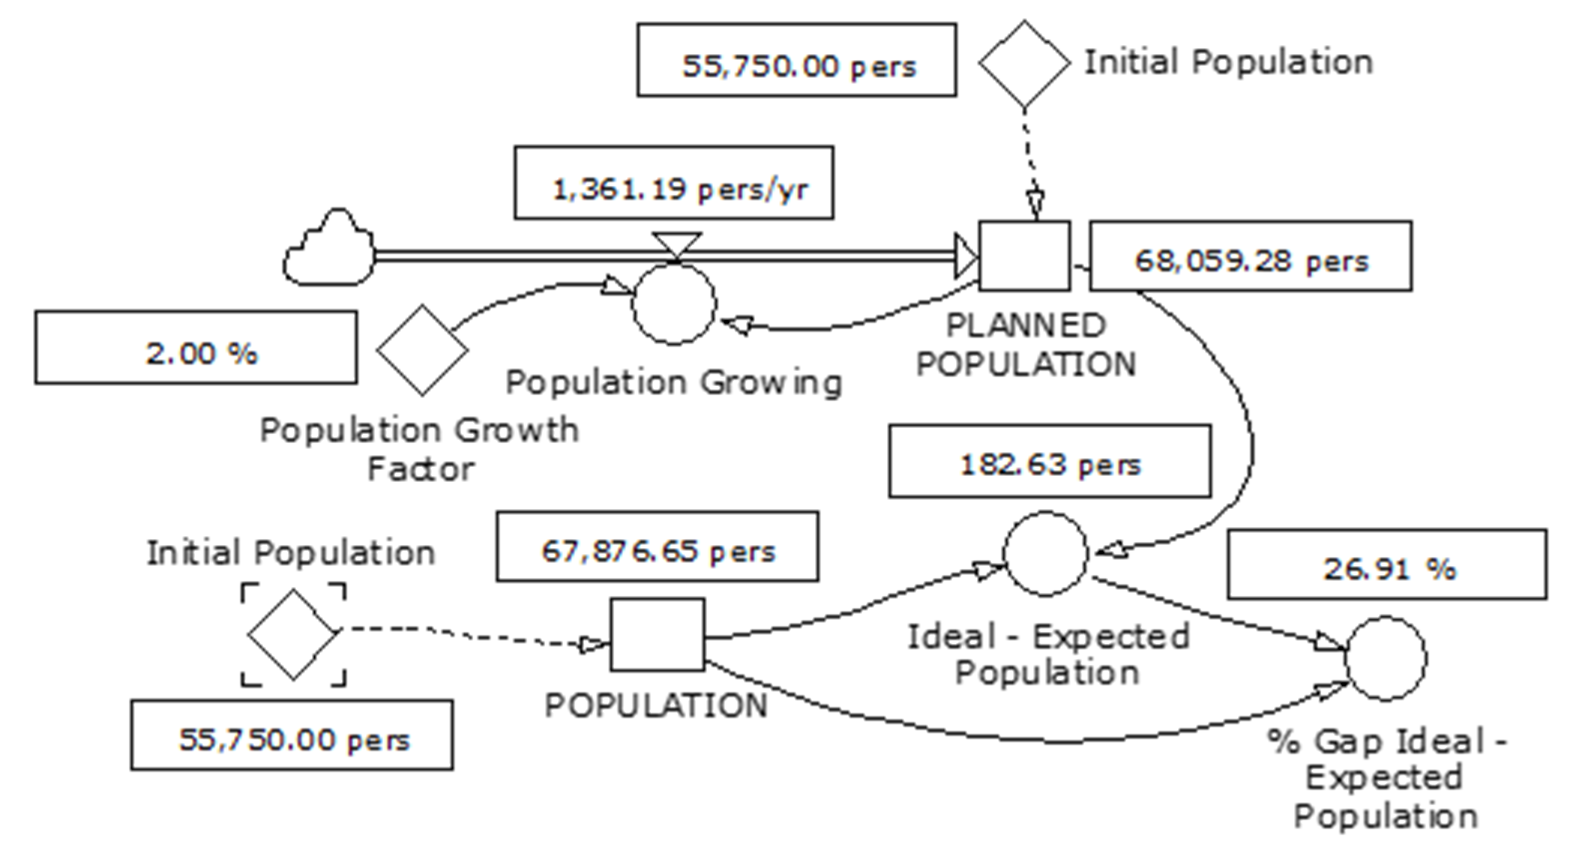
To ensure that 2% growth in population growth is maintained, the local government authorities propose to release the temporary freeze on the building of new dwellings. This can be achieved by issuing building permits, which are in constant demand by building contractors. The quotas of building permits allowed to be issued need to be calculated. The first step in this is to calculate the gap between planned and expected population growth. A new module is created for this purpose. This is shown in Figure 4-32.
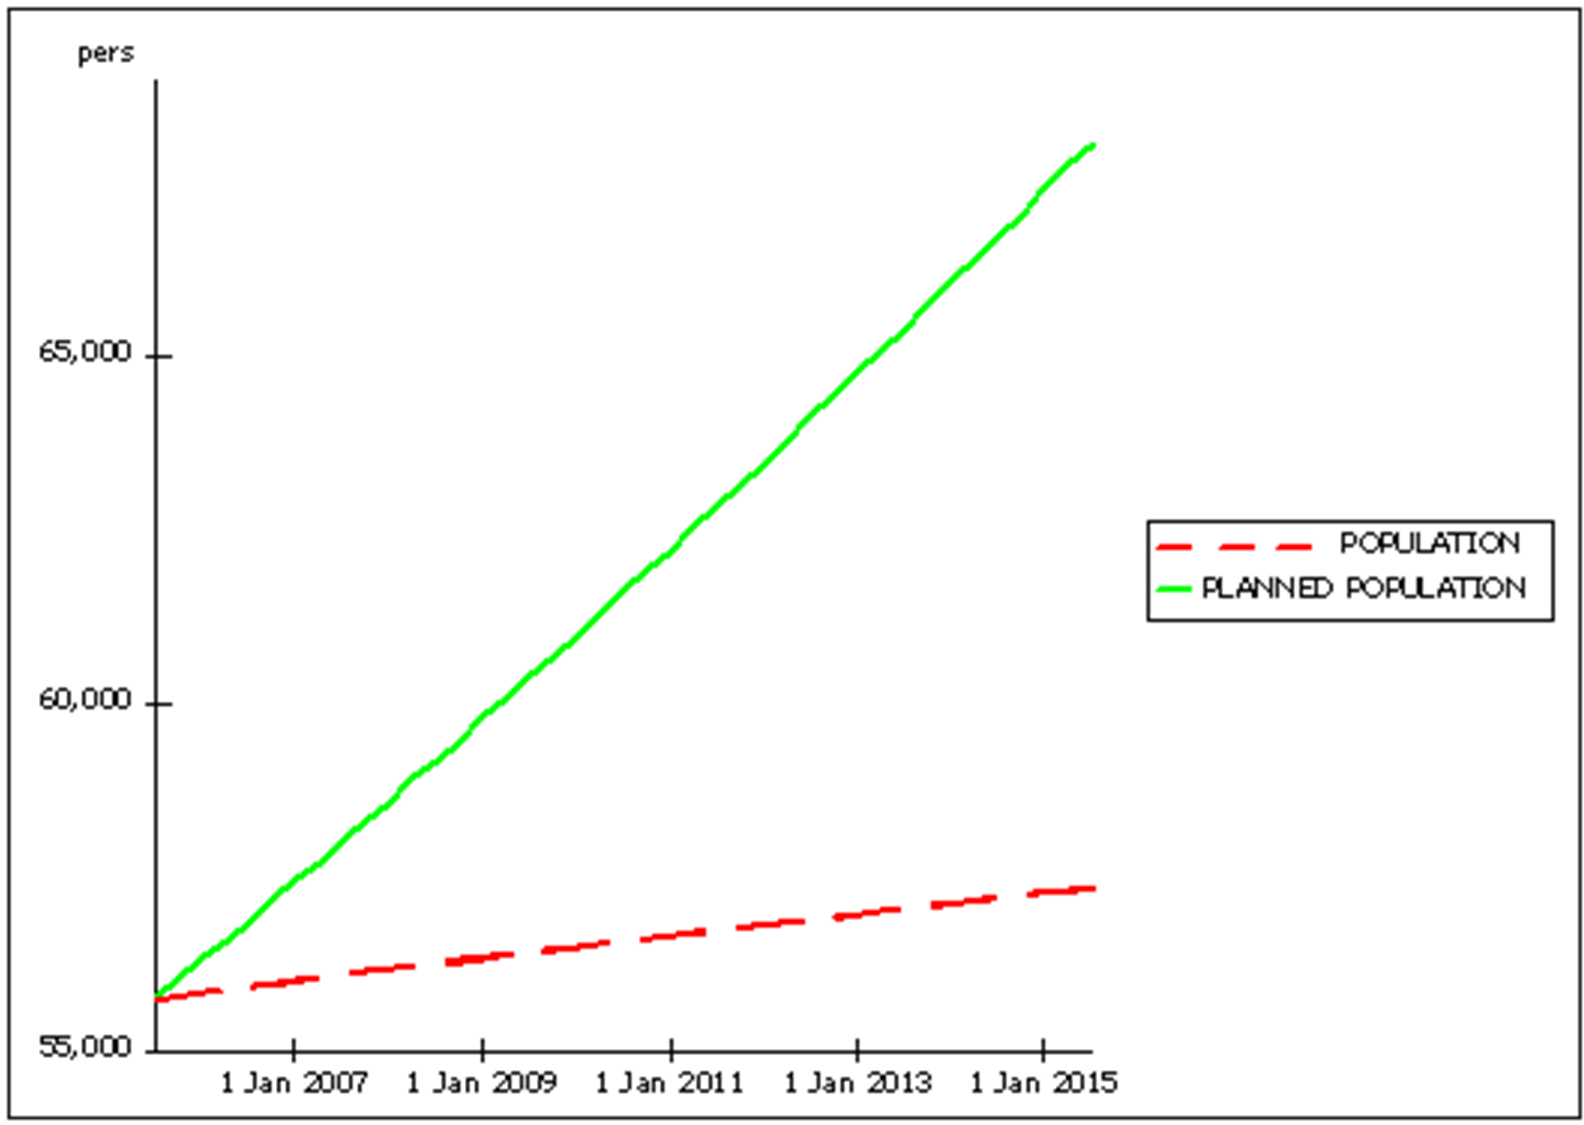
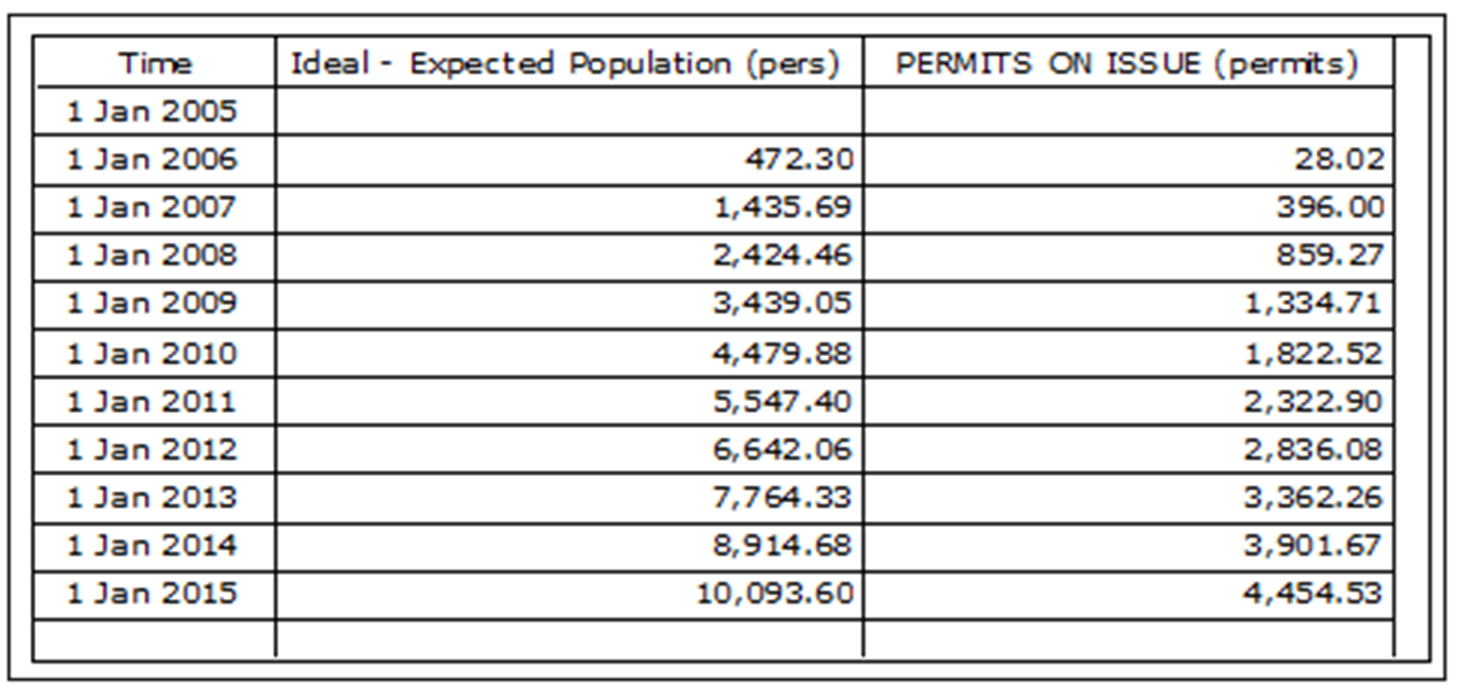
Key variables for the model at Figure 4-32 are shown at Table 4-12 and the time graph of expected population compared to ideal population is at Figure 4-33.
Figure 4-32 indicates that with the low birth rate resulting from as few as 3.5% of all females giving birth any one year the population will grow but at a rate much lower than the planned 2%. Compare POPULATION with PLANNED POPULATION.
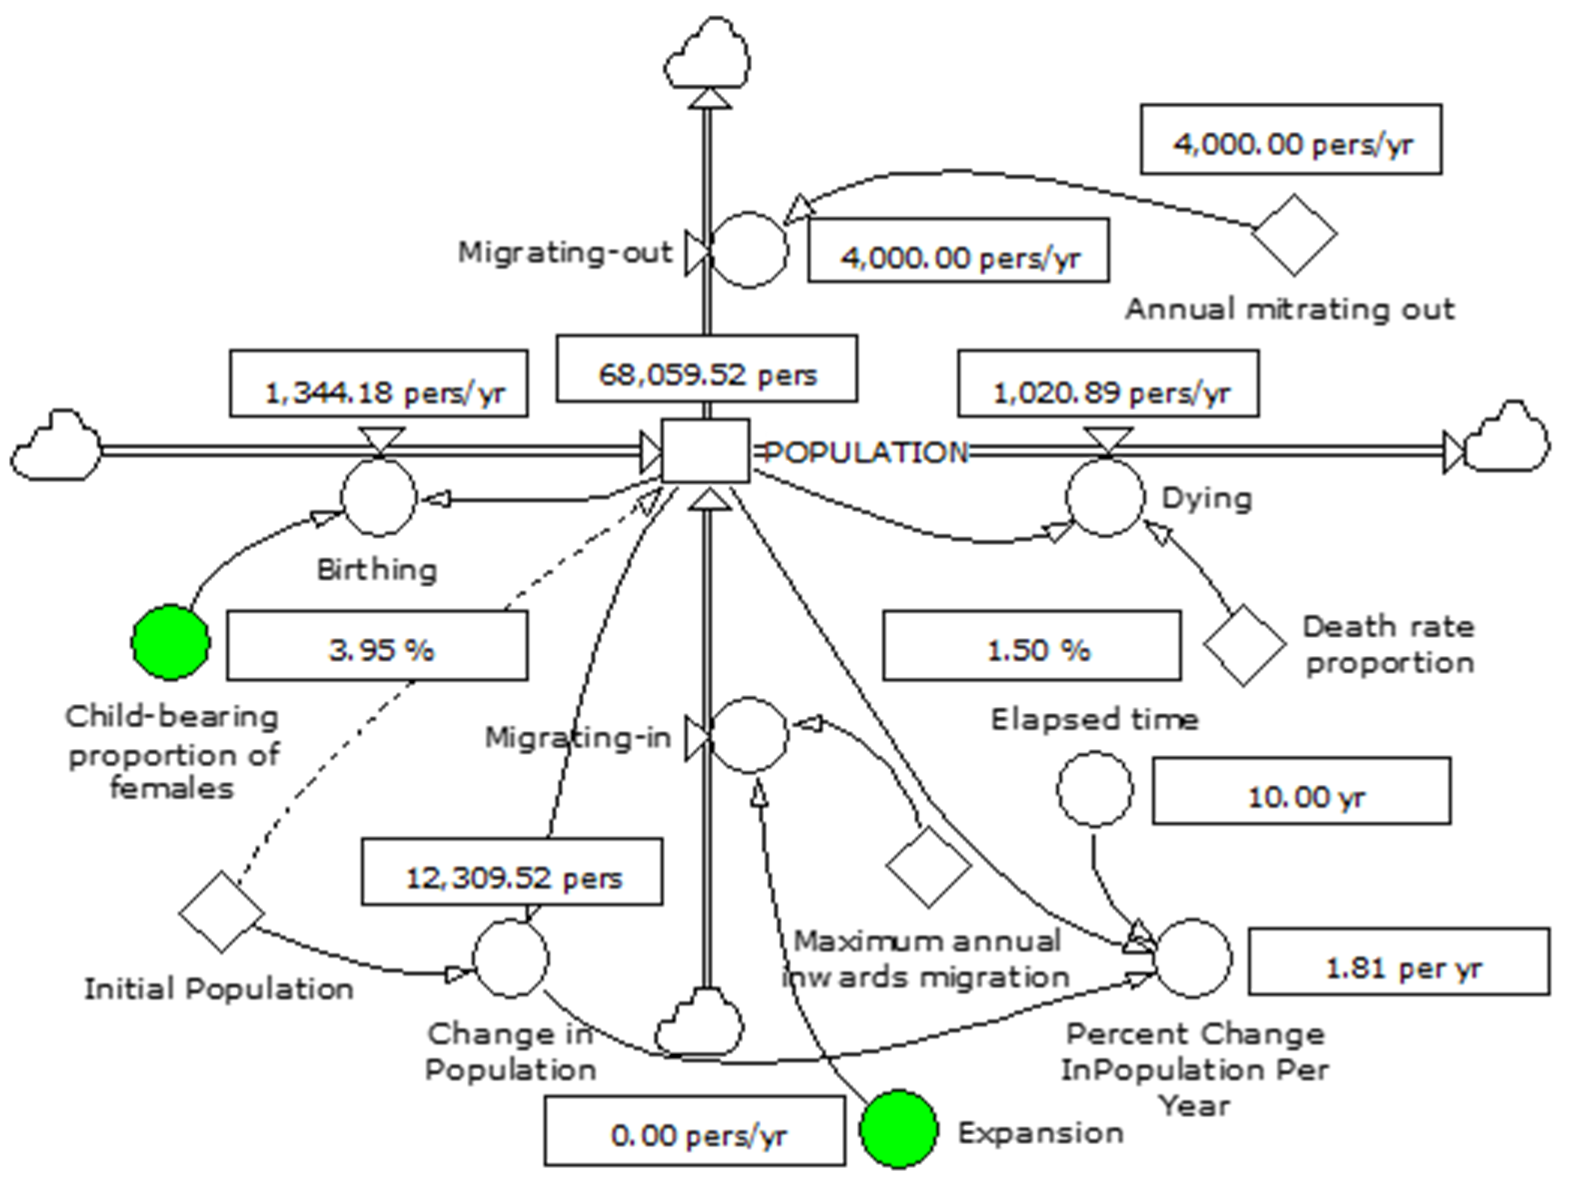
Note that the freeze on building remains in place. Hence, inwards migration is limited to 5,000 persons per year, as indicated in Figure 4-27.
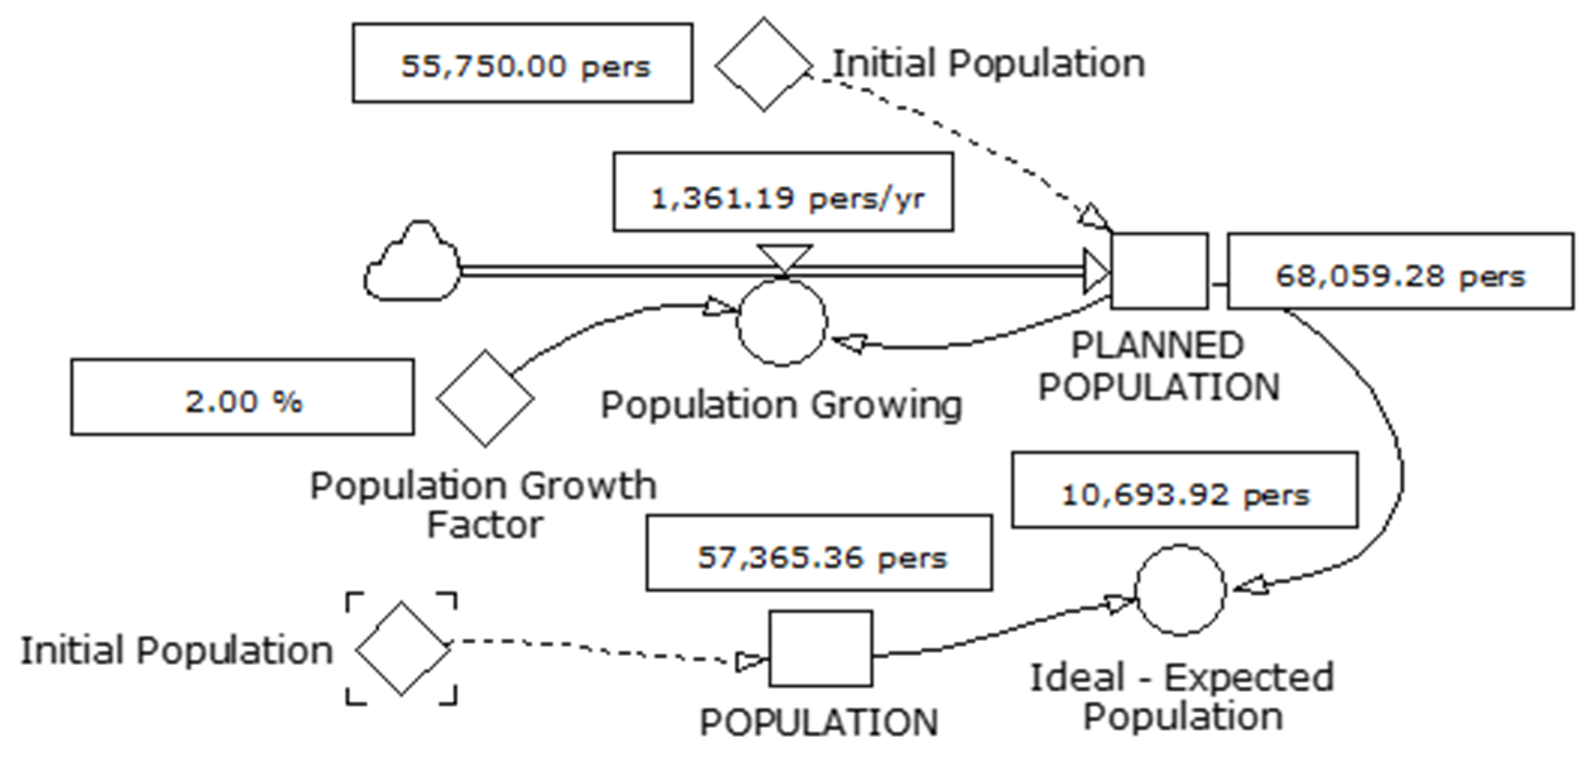
Table 4-12. Key Variables Used in Ideal-Expected Population Model
Variable | Definition | Comment |
|---|---|---|
Population Growing | 'PLANNED POPULATION'/ | |
POPULATION | Snapshot of POPULATION | Taken as a snapshot from the model in Figure 4-30 |
PLANNED POPULATION | 'Initial Population' | Flow = + dt * Population Growing |
Ideal-Expected Population | 'PLANNED POPULATION'-POPULATION |
This suggests that to correct the gap, there is a need to issue building permits at a rate indicated at Figure 4-34. This was determined using the modules described in Figures 4-35 and 4-36.
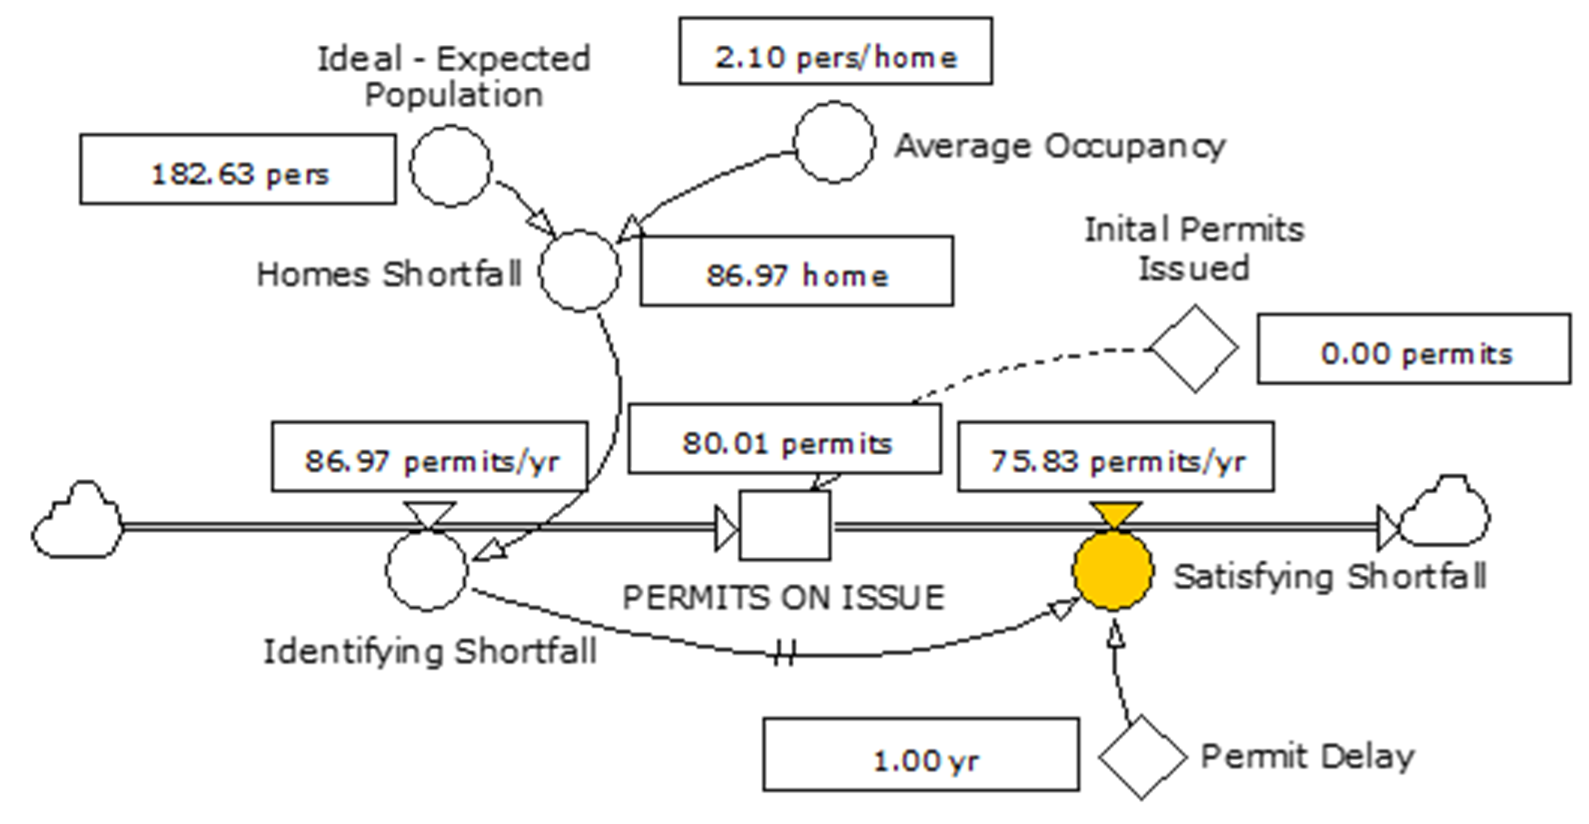
To investigate the efficacy of a strategy that involves issuing building permits at the rate indicated at Figure 4-34, the model in Figure 4-35 has been extended to calculate the percentage gap in population. In turn this is provided as input to calculations of delay in building, Figure 4-36, which then provides adjustment to migrating-in allowed in the original model. The consequence of this should be alignment of the graphs for ideal and expected growth.
The model in Figure 4-35 has been extended to calculate the gap in population with the intent of informing estimates of the number of building permits that might be issued.
Key variables for the model in Figure 4-35 are shown at Table 4-13.
This is then used to calculate the number of permits to be issued, as shown at Figure 4-33.
The output from this model (Satisfying Shortfall) at Figure 4-36 is provided as input to the further update model at Figure 4-37, by way of the Expansion auxiliary variable. These variables are highlighted in Figures 4-36 and 4-37, respectively.
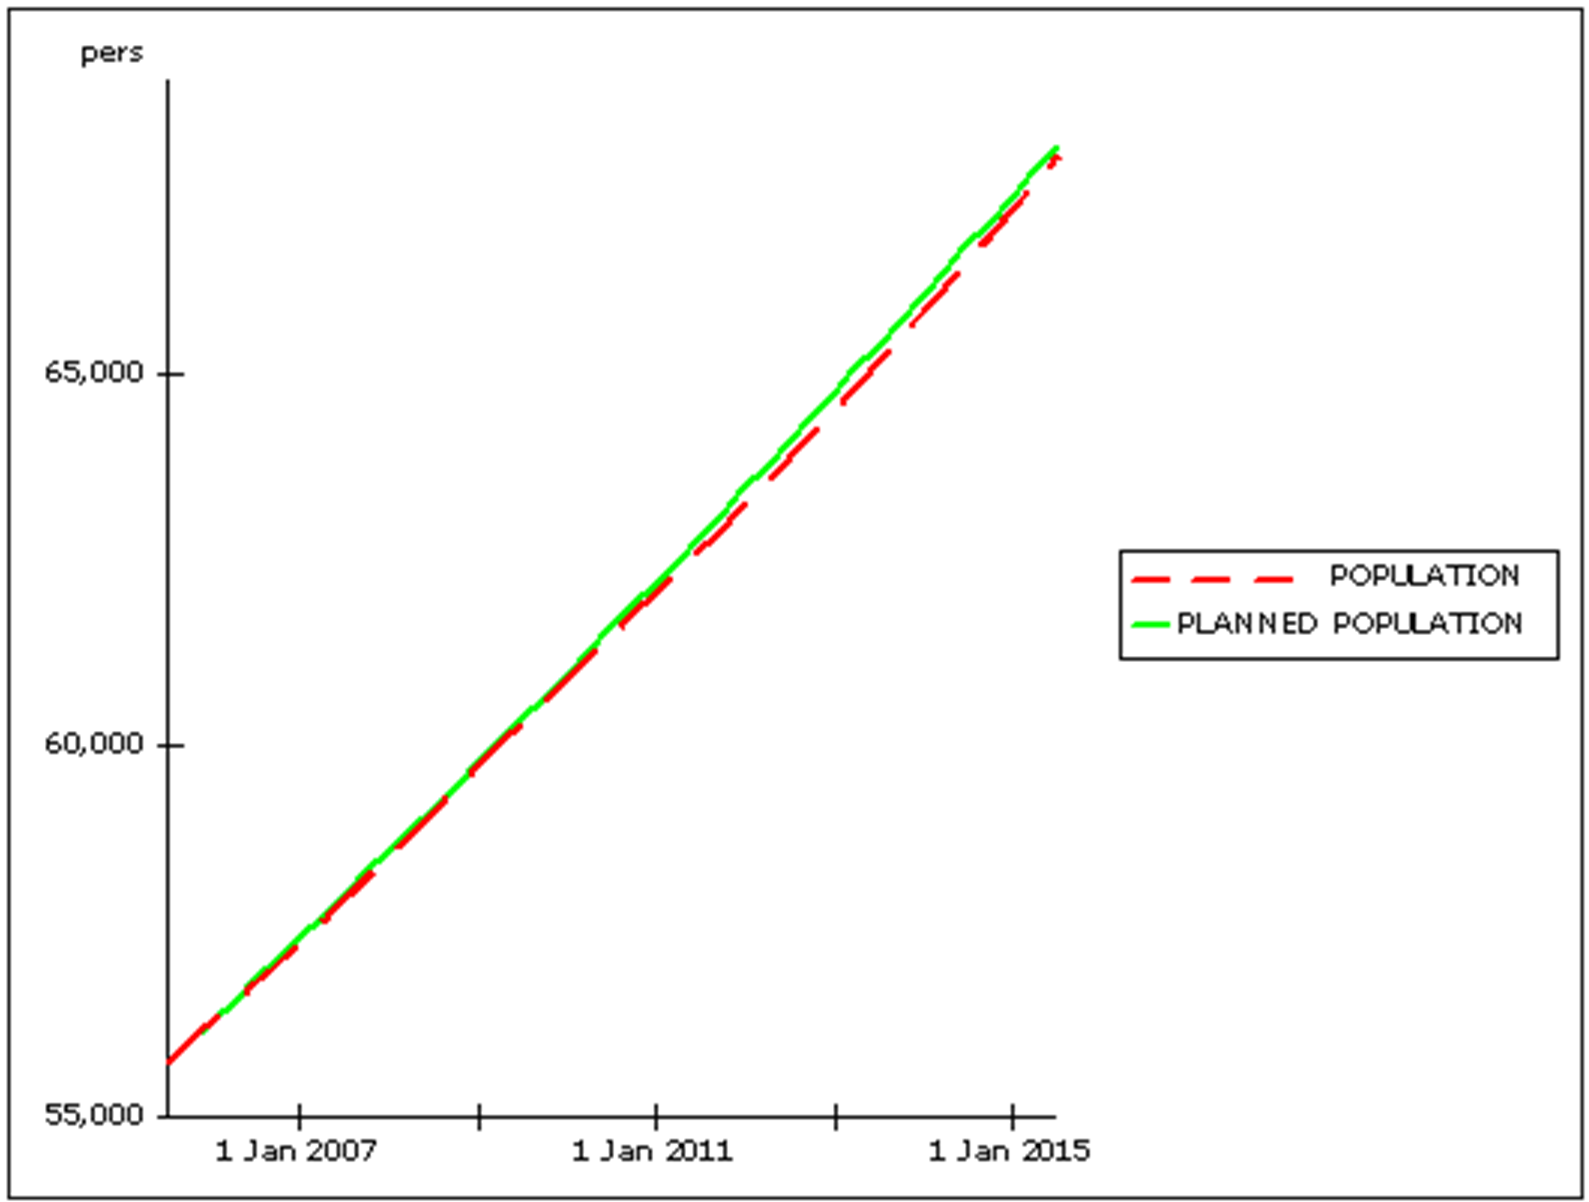
Results of simulating the POPULATION model and allowing expansion through the issuing of building permits model are shown at Figure 4-38.
The strategy of allowing expansion of Migrating-in by issuing building permits to non-residents has produced an alignment between the planned (ideal) population and the expected population, and is one strategy for managing growth of the population.
Table 4-13. Key Variables Used in Ideal-Expected Population Model
Variable | Definition | Comment |
|---|---|---|
Population Growing | 'PLANNED POPULATION'/1<<yr>>*'Population Growth Factor' | |
PLANNED POPULATION | 'Initial Population' | Flow = +dt * Population Growing |
Ideal-Expected Population | 'PLANNED POPULATION'-POPULATION |