4.1.11 Draw Influence Diagram OR Stock-And-Flow Diagram
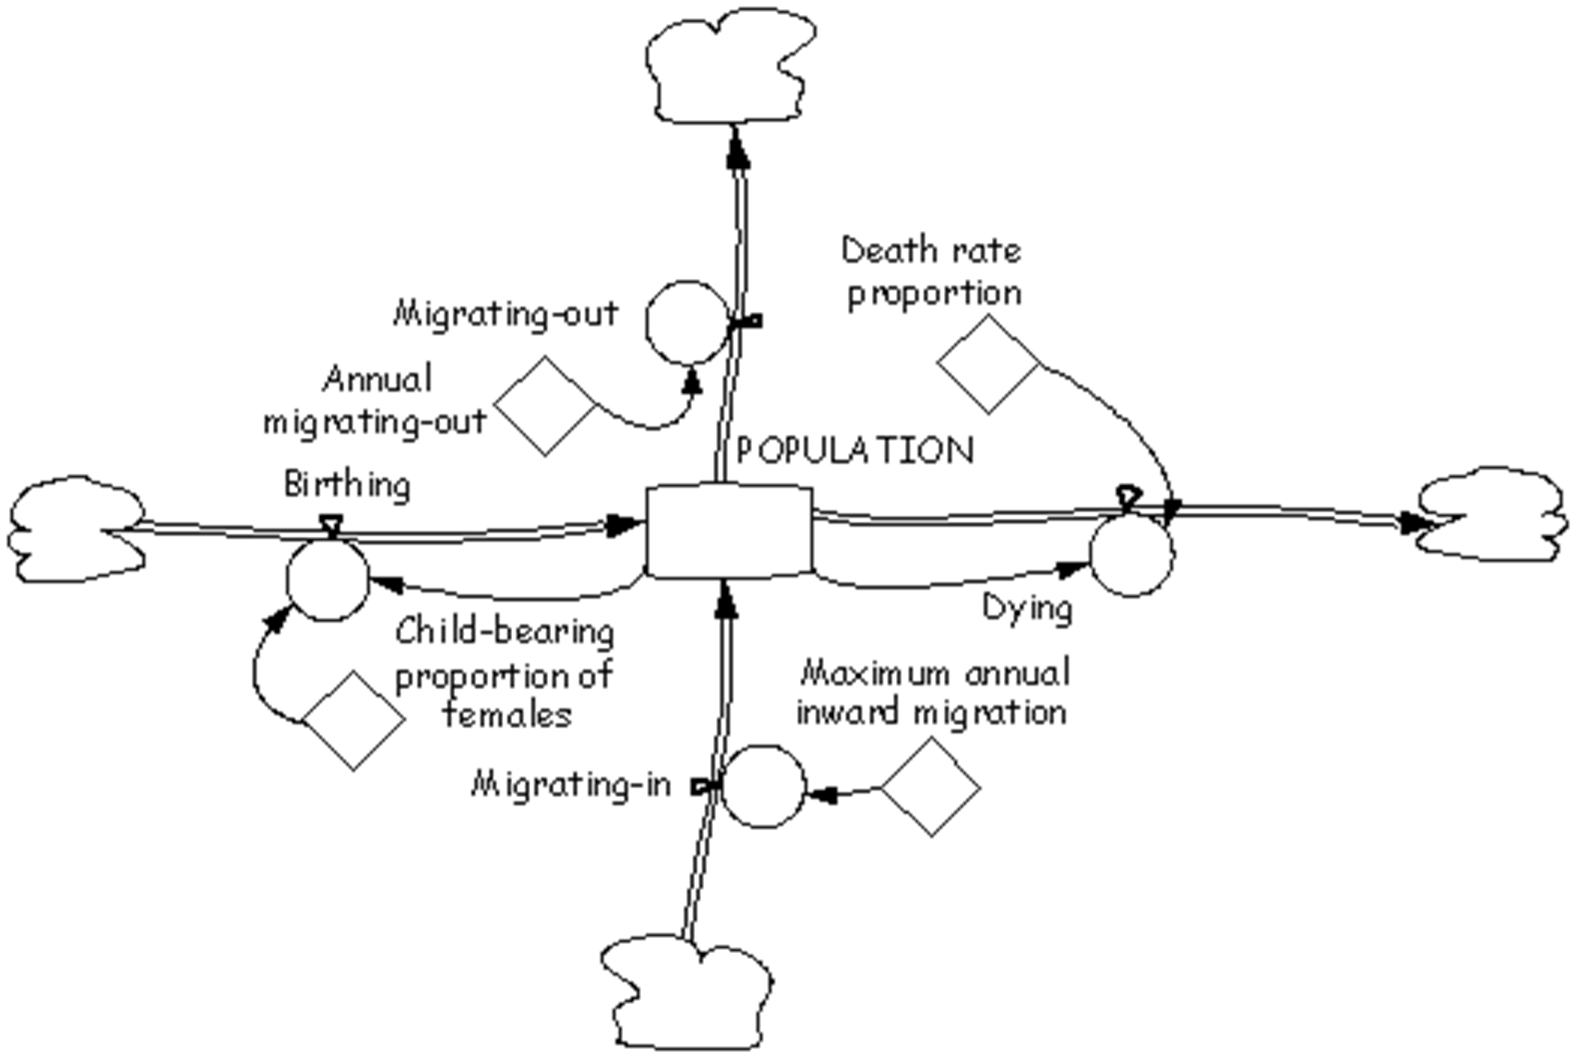
Draw the influence diagram or equivalent stock-and-flow diagram, comparing it through every stage during its construction with the diagrams constructed during qualitative analysis. When drawing the stock-and-flow diagram, in this instance Figure 4-9, the following conventions for identifying parts of the model are suggested:
- Stocks. Stocks (levels or accumulators) are described by a noun using upper case, for example, POPULATION. Doing this suggests a disciplined approach which might be also applied to influence diagrams, making the two types of diagram even more alike. For those who prefer to use causal-loop diagrams rather than influence diagrams, using upper case to identify stocks (levels or accumulators), the state variables might assist in offsetting a serious weakness of causal-loop diagrams in that they do not differentiate state and rate variables. Note that if this is done with rigour, what will be produced will take the form of an influence diagram.
- Flows. Flows (flow rate controls) are described in a rate-actioning sense using a gerund, that is, a noun with the controlling or action intent of a verb. Examples are Dying (or Rate of Dying), Birthing (Rate of Bearing Children), Migrating-in (Rate of Inward Migration), and Migrating-out (Rate of Outward Migration). Flows may take the form of continuous streams (or relatively so) or as a sequence of many (albeit small) discrete events. In models such as this one being developed, we do not consider individual people or even whole numbers of individuals. The latter would lead to the development of models involving integers (whole numbers with no decimal part): integer modelling is not needed in this instance.
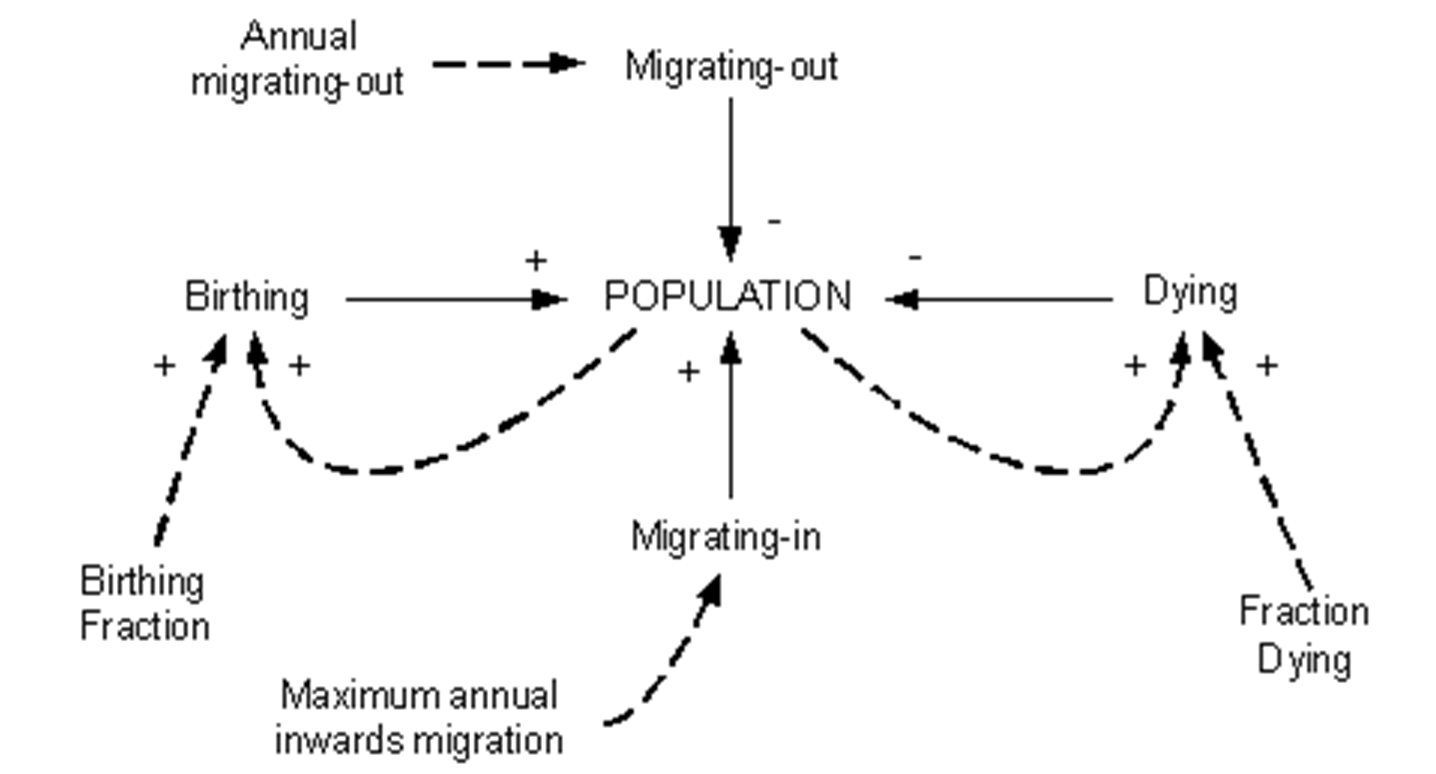
The equivalent influence diagram is shown in Figure 4-10.