5.1.1 First Task And Basic Data
The first task of planners is to determine how much effort is needed to re-establish the plantations, having trees growing to maturity and producing sustainable harvesting. There are a range of considerations which will be introduced progressively to demonstrate how they are integrated into the model.
It must be noted, however, that progressively adding functionality without first identifying the functional requirements of the model is contrary to the systems engineering approach explained at Chapter 1. The importance of comprehensively identifying the functional requirements of the model is stressed. Further guidance on formulating good requirements are provided by Sommerville and Sawyer, 1997.
To avoid undue complications during the teaching of model building, a simple step-by-step approach is taken. The basic data for building the first version of the model is contained in Table 5-1.
Table 5-1. Representative Data for Re-establishing the Forests Model: Stage 1
Attribute | Data | Remarks |
|---|---|---|
Total area available. | 1,000 hectares | 10% of the available area is required for establishing fire trails and access roads. The area available for forest plantings is 900 ha. |
Species to be planted: | Pinus Cotterii | Newly developed softwood species. |
Planned sustained rate of planting saplings: | 42,500–50,000 saplings per year. | |
Tree sizes: Saplings: Small Trees: Medium Trees: Harvestable Trees: | Up to 100mm 100—150 mm 151—250 mm Over 250 mm | Trunk diameters measured 1.5 metres above the ground. |
Trees per hectare: Saplings: Small Trees: Medium Trees: Harvestable Trees: | 2000 1500 1200 850 | Managed by culling and progressive thinning. |
Expected growing times: Saplings: Small trees: Medium trees: Harvestable trees: | 0–12 years 12+ years to 25 years 25+ years to 48 years 48+ years | |
Target number of harvestable trees | 120,000–140,000 trees | Because plantations help reduce greenhouse gases, a target sustainable number of mature trees in this range has been chosen. |
Target harvesting rate. | ? trees / year | The 900 ha plantation should be fully planted out at any time. The target harvesting rate is to be calculated with sustainability in mind, keeping the plantation as close as possible to the maximum available area. |
Expected planting start date: | 1 July 2005 | This becomes the start date of simulation. |
Building the Basic TREES Module
The trees module is built to accommodate the following:
- An array state variable might be TREES (or TREES BY GROUP), which would contain groupings for each of the modules:
- SAPLINGS.
- SMALL TREES.
- MEDIUM TREES.
- HARVESTABLE TREES.
- Trees can enter generic states in the following ways:
- Being planted, in the case of SAPLINGS.
- Growing to a size exceeding that which includes membership of the previous group—for example a tree of 101 mm trunk diameter (measured 1.5m above the ground) enters the group SMALL TREES from the group SAPLINGS.
- Trees can exit generic states in the following ways:
- By dying.
- Being culled (removed) because of being unhealthy or stunted.
- Being thinned (removed) because they are smaller than adjacent trees, and is sacrificed to enable the adjacent trees to grow.
- By progressing to the next group—for example, a tree of 151mm trunk diameter (measured 1.5m above the ground) enters the group MEDIUM TREES from the group SMALL TREES.
- By being harvested, in the case of HARVESTABLE TREES.
Figure 5-1 shows a simple pipeline delay module constructed to demonstrate that from initial planting as saplings, trees take 12 years to grow to become small trees. This assumes that there are no losses through disease or culling. Planting is set at 50,000 trees per year.
This module, shown at Figure 5-2 is subsequently enhanced to vary the rate of planting in the range 42,500–50,000 trees per year, and the simulation is run over a time horizon of 50 years with a 3-months time-step.
Key variables for the module shown in Figure 5-2 are defined in Table 5-2.
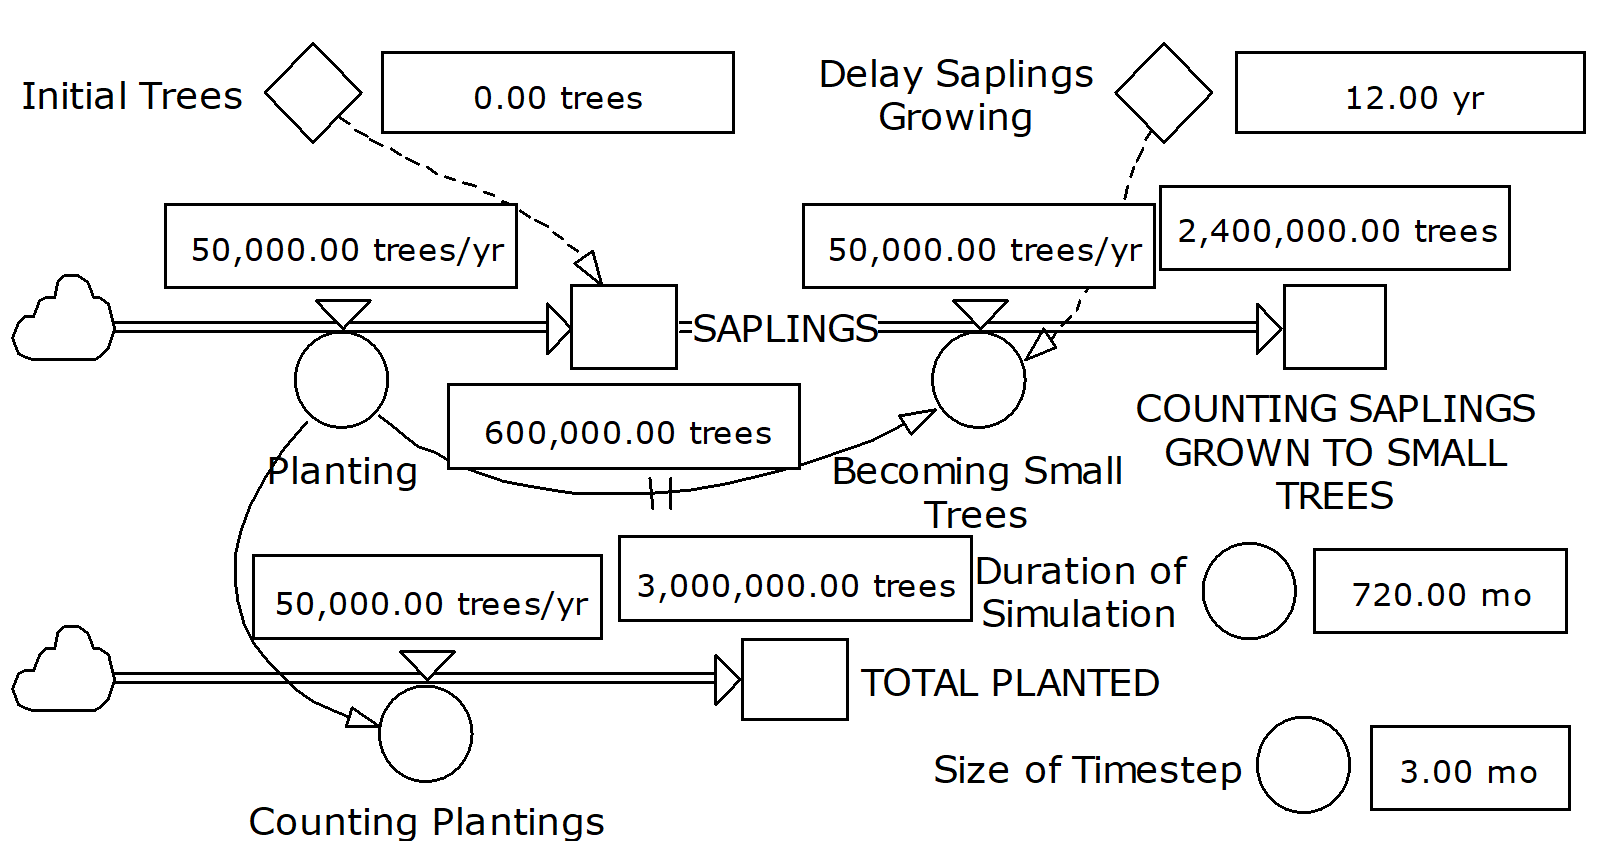
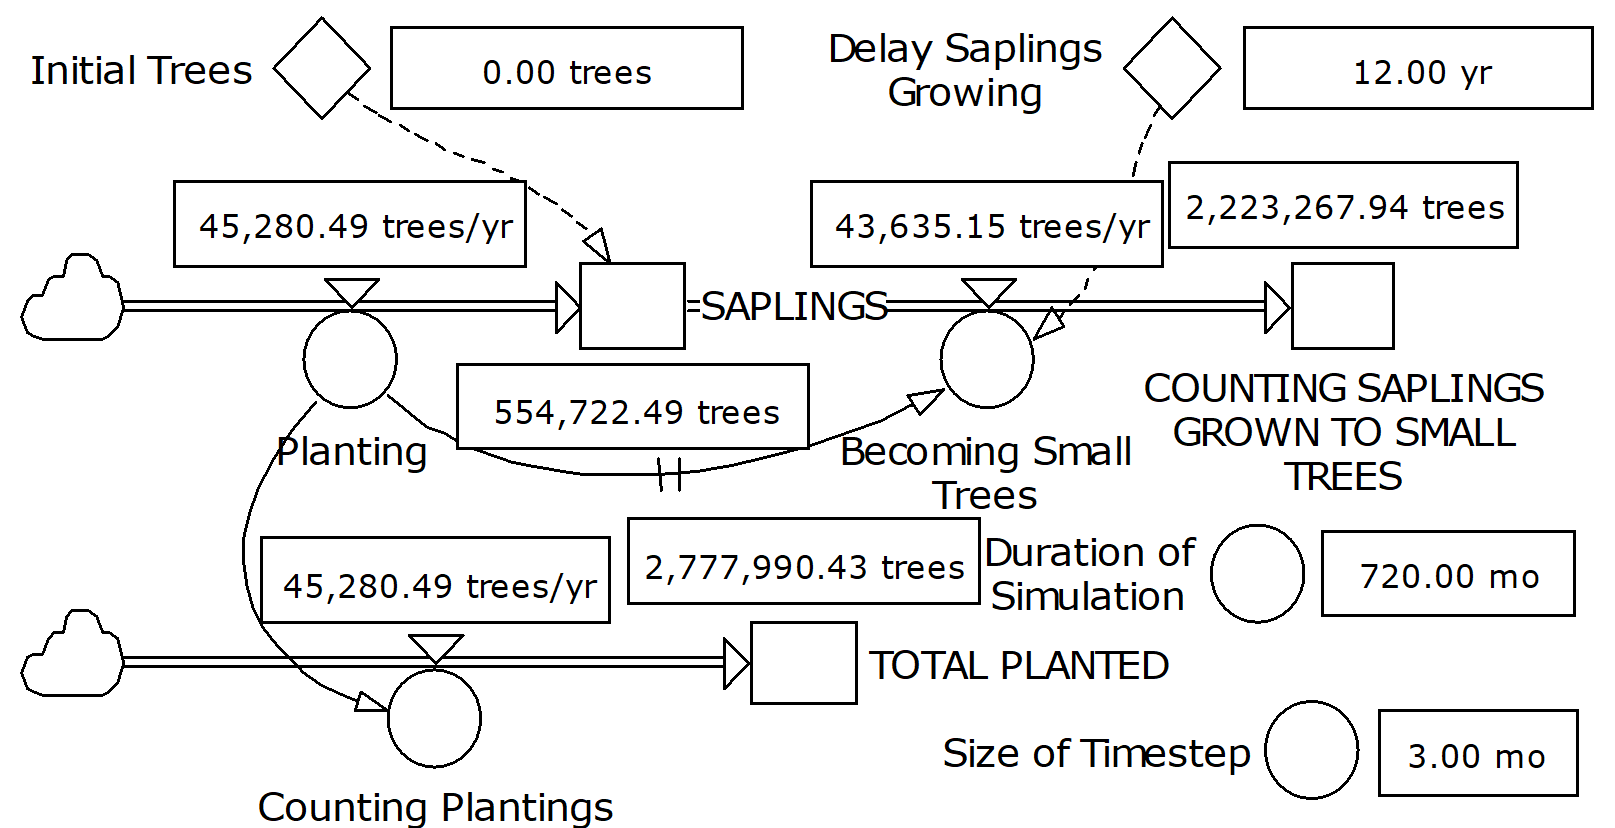
Table 5-2. Key Variables Used In Model at Figure 5-2
Variable | Definition | Comment |
|---|---|---|
Planting | 50000*RANDOM(0.85, 1.00, 0.987) *1<<trees/yr>> | Rate of planting is taken to be random, that is, uniformly distributed between 42,500 and 50,000 trees per year. |
Counting Plantings | Planting | |
Becoming Small Trees | DELAYPPL(Planting, 'Delay Saplings Growing', 0<<trees/yr>>) | |
Delay Saplings Growing | 12 | Units = years (yr) |
Size of Timestep | TIMESTEP | |
Duration of Simulation | TIME-STARTTIME | Units = months (mo) |
It is important to note that the Powersim™ Studio Reference Guide describes a pipeline delay as:
In the DELAYPPL function, nothing happens to the output until the delay time has elapsed. At this point, Input is reproduced exactly. The DELAYPPL function can be seen as a conveyor belt, where items are put on the conveyor at one end and expelled at the other end after a fixed time; the Delay Time.
When setting up the DELAYPPL function for this module, there are a number of important considerations:
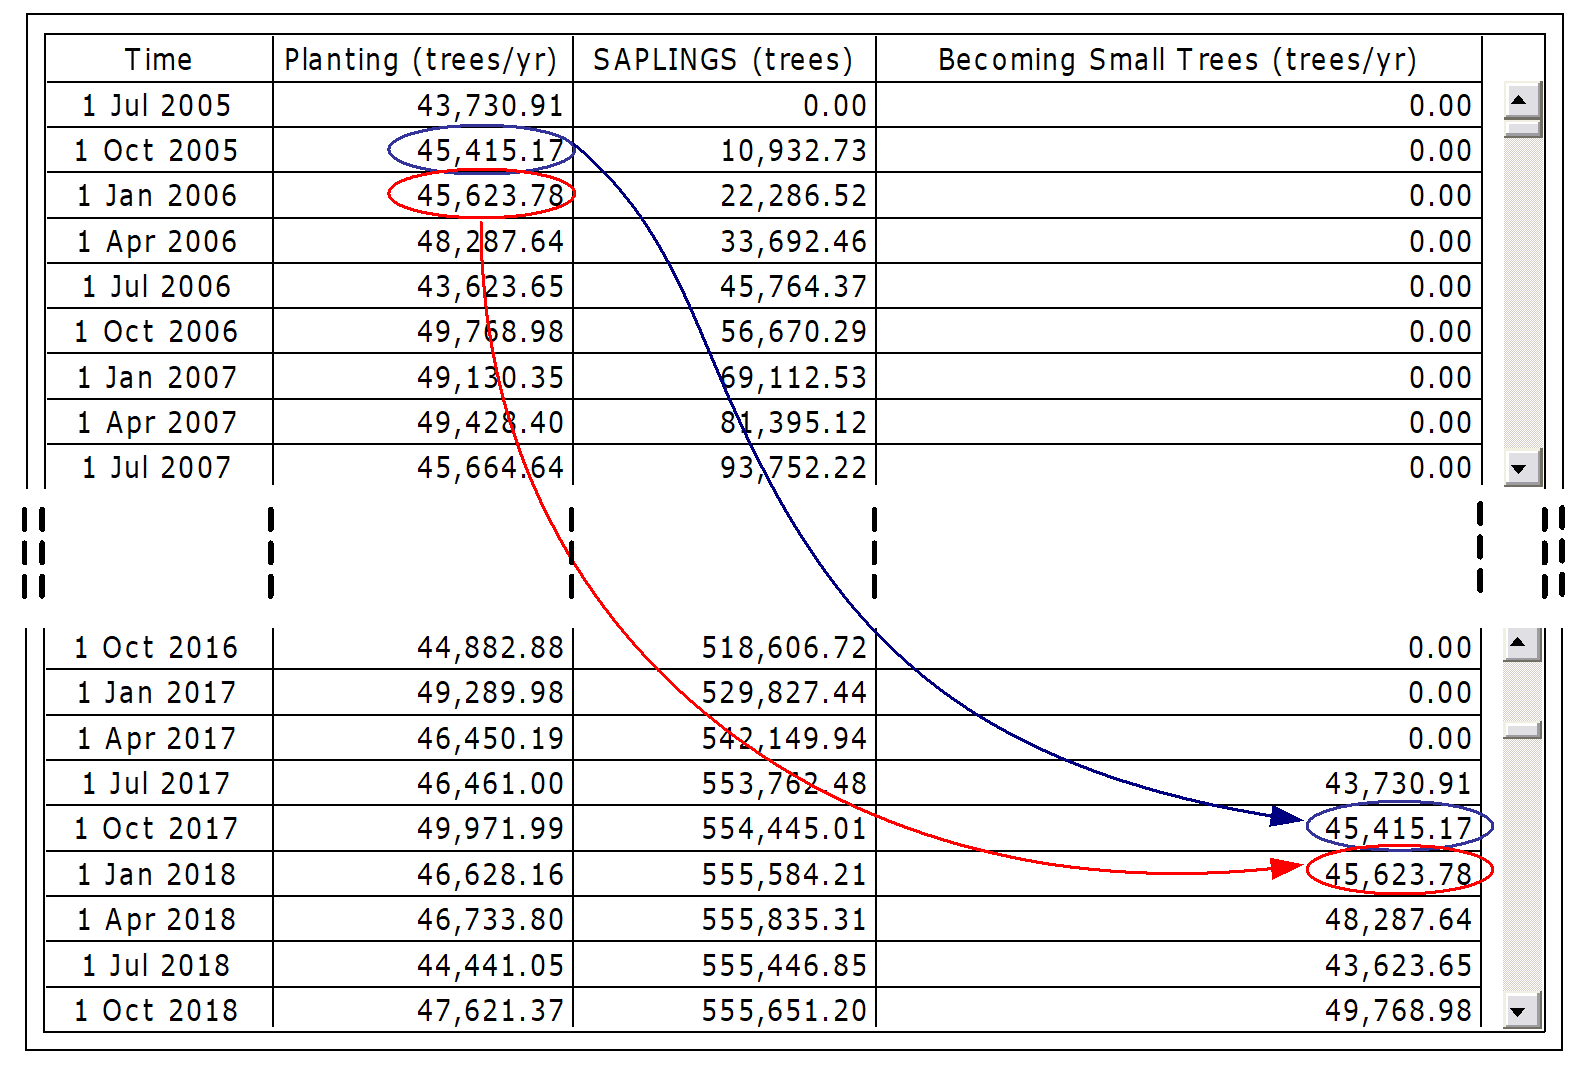
- The syntax is as shown at Table 5-2 for the variable Becoming Small Trees. It is necessary to set the initial value to an appropriate value. Here it is set to initial value of Planting, which is zero <<trees>>. This can be confirmed by values of zero for the first 12 years (1 Jul 2005 to 1 Apr 2017 inclusive) in Figure 5-3.
- Zero returned as the value for SAPLINGS for 1 Jul 2005 because the initial value is zero (Initial Trees = 0) of Planting.
- All Planting input values are delayed by a period of 12 years (Delay Saplings Growing). Planting input values are translated following the pattern shown in Figure 5-3:
- Planting 1 Oct 2005 = 45,415.17 (trees/yr), becomes Becoming Small Trees 1 Oct 2017 = 45,415.17 (trees/yr); and
- Planting 1 Jan 2006 = 45,623.78 (trees/yr), becomes Becoming Small Trees 1 Oct 2017 = 45,623.78 (trees/yr); and etc.
- The duration of the delay cannot be changed during the simulation. It is fixed at the value set initially. If there is a need to vary the duration of the delay during the simulation, it is necessary to use the Variable Time Material Pipeline Delay function, DELAYPPLMTR. We might conceptualise DELAYPPLMTR as a conveyor belt which we can vary in length, according to our own desires, to have items placed on it come off at varying times.
The results of the pipeline delay in our first SAPLINGS module are shown at Figure 5-3.
The next step is to create a module which takes into account both the delay in saplings becoming small trees and the routine culling of trees to encourage the remaining trees to grow tall and straight. Culling is taken to be continuous over the whole of the 12 years, and is done at a rate which produces 1,500 small trees at the end of the 12th year from 2,000 plantings. This is shown at Figure 5-4.
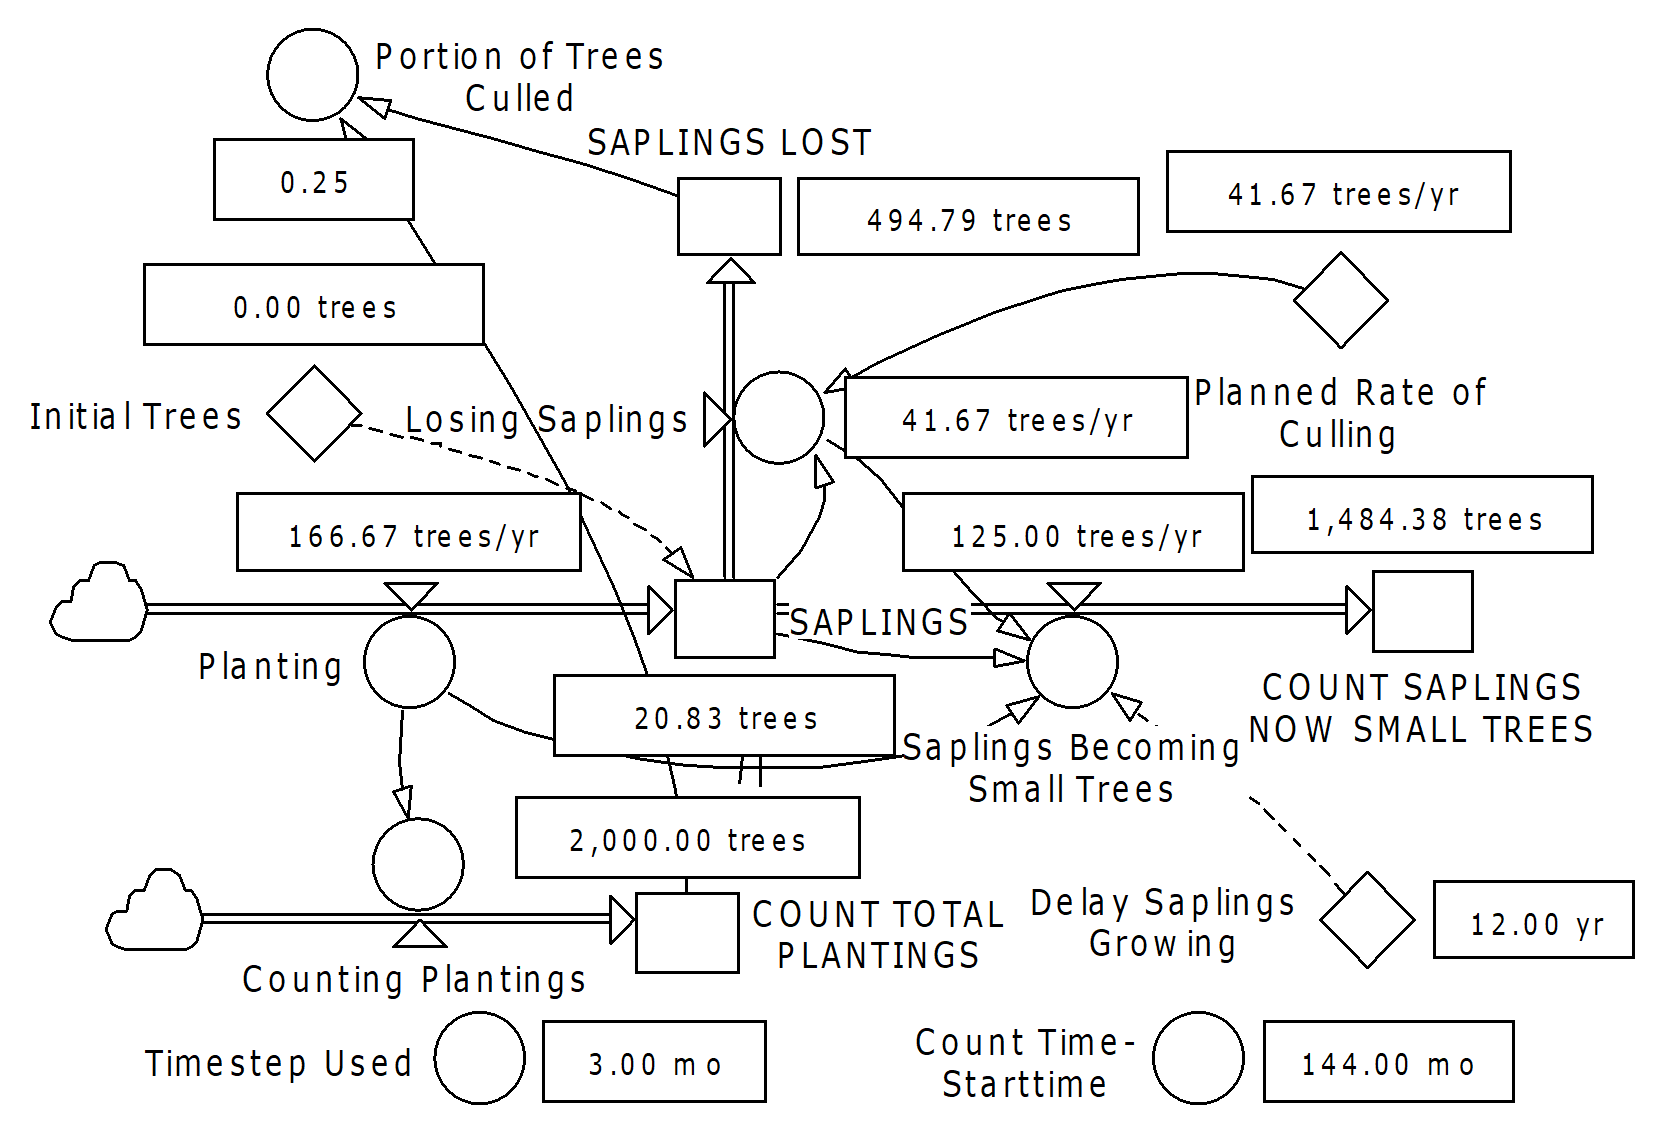
Note that there are 2,000 trees are planted over a period of 12 years. This module is built to test the logical structure before going on to build a module which we will simulate over a much longer time horizon.
Here we know that 500 trees are lost through being culled and 1,500 mature to become small trees. By inspection we note that nothing is lost or gained by this module: what enters during the simulation, taking into account what is in the pipeline initially, either leaves the module or is accumulated within it. This check confirms that the module does not violate the mass-balance principle.
We also see that small errors exist. These can be improved by selection of time-step and method of integration, with the greatest improvement made by reducing the time-step. We know that for 2,000 trees planted, 500 will be culled and 1,500 will become small trees. This model shows 2,000, 498.26, and 1,494.79 respectively. Choice of a time-step of one month results in an accuracy of 99.65% whilst accuracy can be increased to 99.993% by reducing the time-step to less than two hours. However the latter choice of time-step slows the simulation significantly. There is a trade-off to be made in choice of time-step.
Note that as the time-step is made smaller, the (delayed) contents of the state variable become smaller. If the simulation time-step in Figure 5-4 was changed from three months to one month, the delayed contents of the state variable would become three times smaller. That, there is a decrease from 20.83 to 6.94.
Note that the key variables for the module described at Figure 5-4 are defined in Table 5-3.
In the next step, the module is extended to accommodate plantings at the rate of 42,500–50,000 per year with again the simulation run over a time horizon of 12 years. This module is shown in Figure 5-5.
Key variables of the module shown in Figure 5-5 are defined in Table 5-4.
Table 5-3. Key Variables Used In Module at Figure 5-4
Variable | Definition | Comment |
|---|---|---|
Planting | 2000/12*1<<trees/yr>> | Rate of planting is taken to be 2,000 trees per year. |
Counting Plantings | Planting | |
Losing Saplings | IF(SAPLINGS>0<<trees>>,1,0)* 'Planned Rate of Culling' | Saplings can only be lost if SAPLINGS is greater than zero. |
Becoming Small Trees | IF(SAPLINGS>0<<trees>>,1,0) *(DELAYPPL(Planting, 'Delay Saplings Growing') -'Losing Saplings') *IF('Losing Saplings'>0<<trees/yr>>,1,0) | Losing Saplings is calculated before Becoming Small Trees and SAPLINGS can only become small trees if SAPLINGS is greater than zero. |
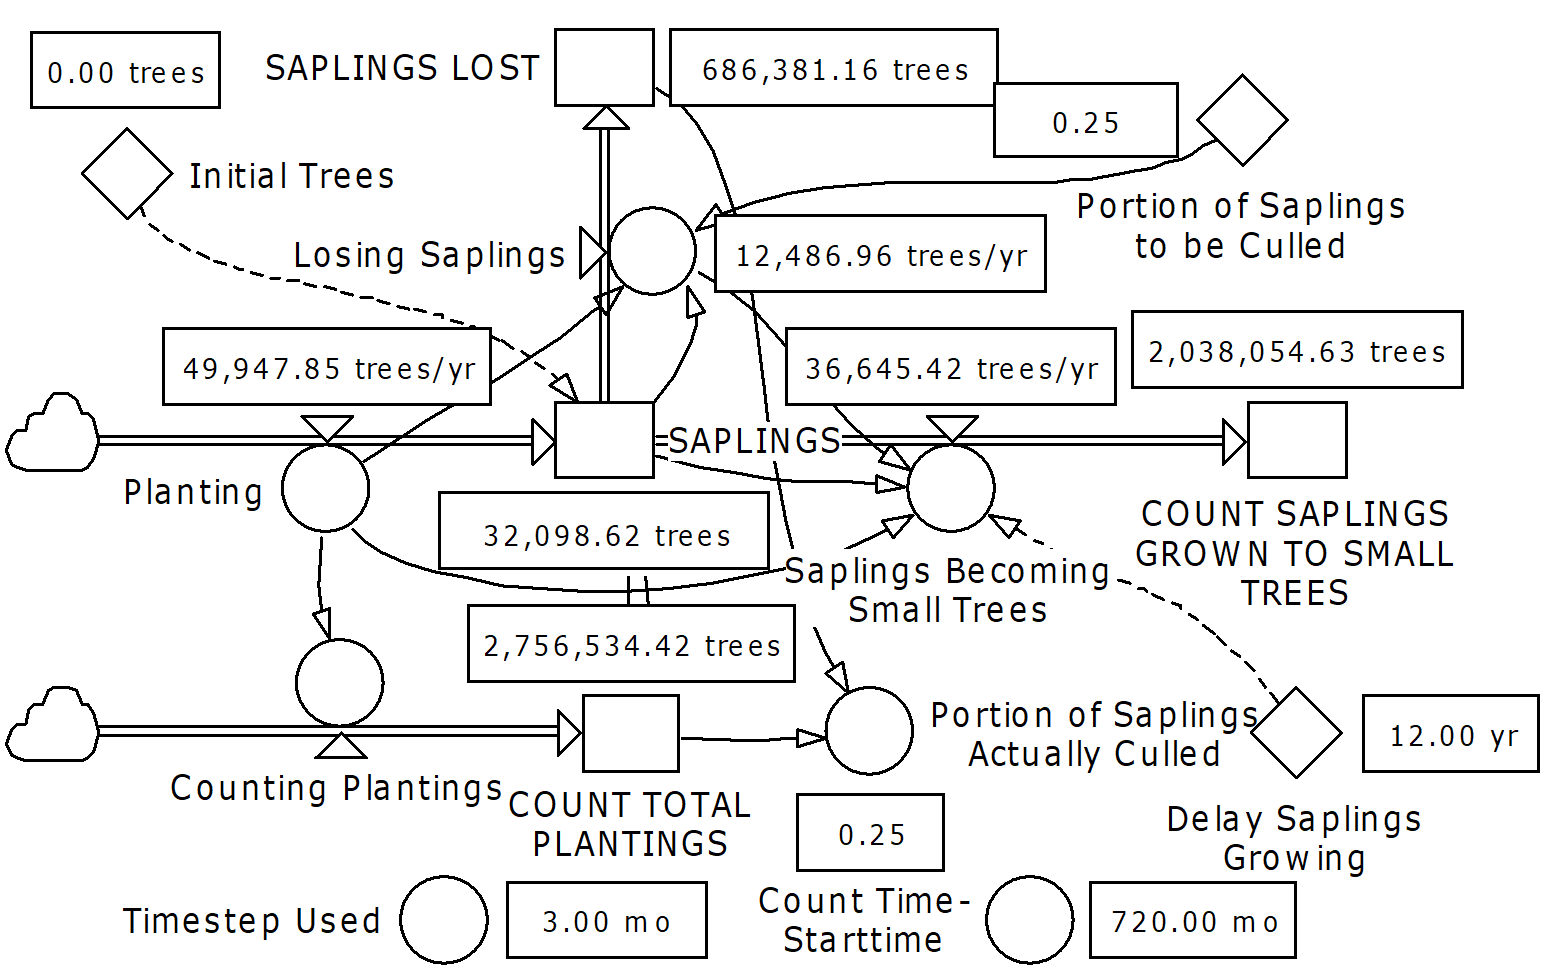
Table 5-4. Key Variables Used In Model at Figure 5-6
Variable | Definition | Comment |
|---|---|---|
Planting | 50000*RANDOM(0.85, 1.00, 0.36)*1<<trees/yr>> | This generates a random number of trees from 42,500 to 50,000 to be planted in any one year. |
Count Plantings | Planting | These are accumulated at COUNT TOTAL PLANTINGS. |
Portion of Saplings to be Culled | 0.25 | Based on initial data that 2000 saplings planted will be culled and thinned over a period of 12 years to leave 1500 small trees. |
Losing Saplings | IF(SAPLINGS>0<<trees>>,1,0)*'Planned Annual Portion of Plantings Culled' *Planting | The method of calculating Losing Saplings has been changed to accommodate the general situation that a fraction of all saplings are culled. The calculation is based on 500/2,000 = ¼ of all plantings. |
Saplings Becoming Small Trees | IF(SAPLINGS>0<<trees>>,1,0) *IF('Losing Saplings'>0<<trees/yr>>,1,0) *(DELAYPPL(Planting, 'Delay Saplings Growing') -'Losing Saplings') | Losing Saplings is calculated before Becoming Small Trees and SAPLINGS can only become small trees if SAPLINGS is greater than zero. |
Again at each timestep in the simulation we can check that mass-balance is not violated. A check at the end of the simulation as shown in Figure 5-6 reveals:
Initial Trees + COUNT TOTAL PLANTINGS—COUNT SAPLINGS GROWN TO SMALL TREES—SAPLINGS LOST—Current SAPLINGS = 0 trees
This is a fundamental test conducted on each module to assure that it functions correctly. Further details are provided both in this chapter in Figures 5-15 and 5-16 and in Chapter 6.
The simulation of the SAPLINGS module is now run over 60 years with the results displayed as auto-reports in Figure 5-6.
Variables to be used in related modules are highlighted. Saplings Becoming Small Trees becomes the input variable for the Small Trees module. SAPLINGS, used later in the Forest Area Growing module will provide input for calculating the current area of forest. Additional or altered variables of the module shown in Figure 5-6 are defined in Table 5-5.
Modules can be constructed for each of the other groupings, that is, SMALL TREES, MEDIUM TREES, and HARVESTABLE TREES, as shown in Figures 5-7, 5-8 and 5-9.
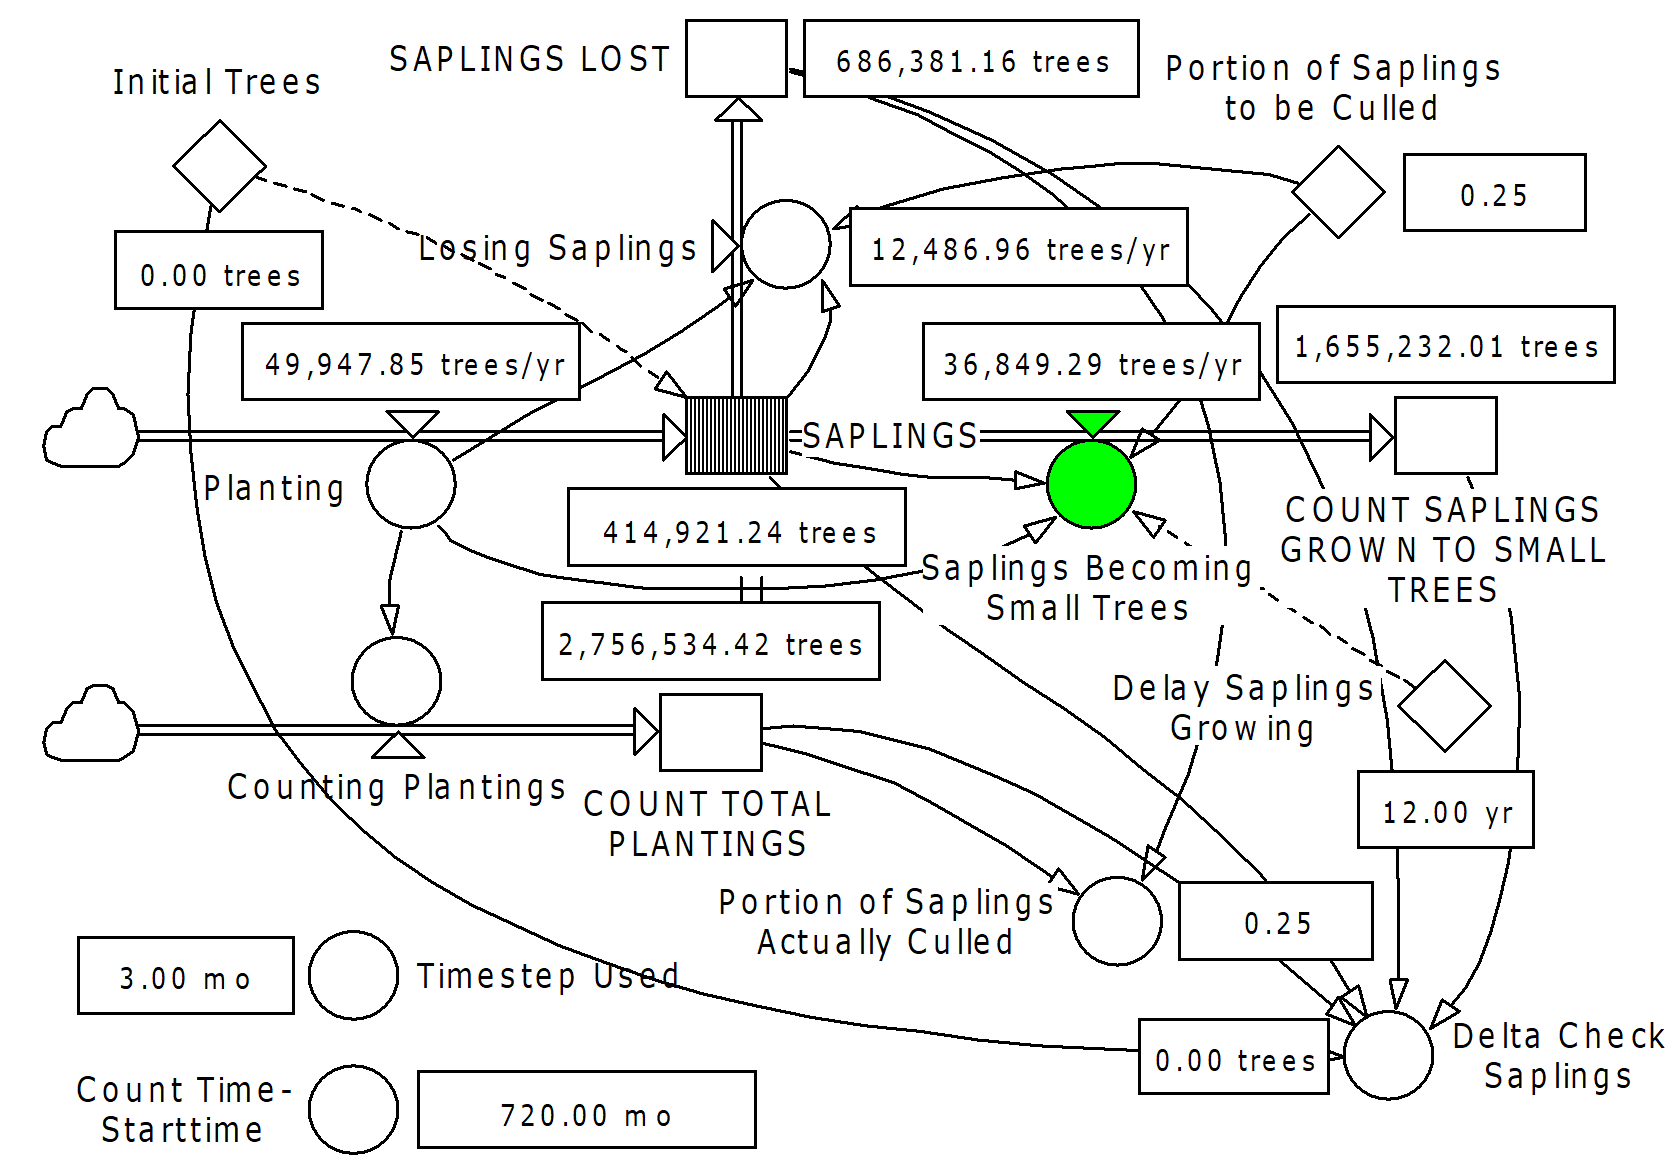
Table 5-5. Additional Key Variables Used In Model at Figure 5-6
Variable | Definition | Comment |
|---|---|---|
Delta Check Saplings | 'COUNT TOTAL PLANTINGS' +'Initial Trees' –SAPLINGS-'SAPLINGS LOST' –'COUNT SAPLINGS GROWN TO SMALL TREES' | Mass-balance check. The value of this variable must be zero for each time-step. If this is so, there is no net loss or gain of material in the module. This is an essential test. |
Saplings Becoming Small Trees | IF(SAPLINGS>0<<trees>>,1,0) *(DELAYPPL(Planting, 'Delay Saplings Growing',0<<trees/yr>>)* (1–('Portion of Saplings to be Culled'))) *IF('Portion of Saplings to be Culled'<=1,1,0) | This rate-controlling variable is used to link to the next (downstream) module. |
Portion of Saplings Actually Culled | 'SAPLINGS LOST'/'COUNT TOTAL PLANTINGS' | The portion of trees actually culled is calculated. The value must be the same as that set as planned portion of trees culled. |
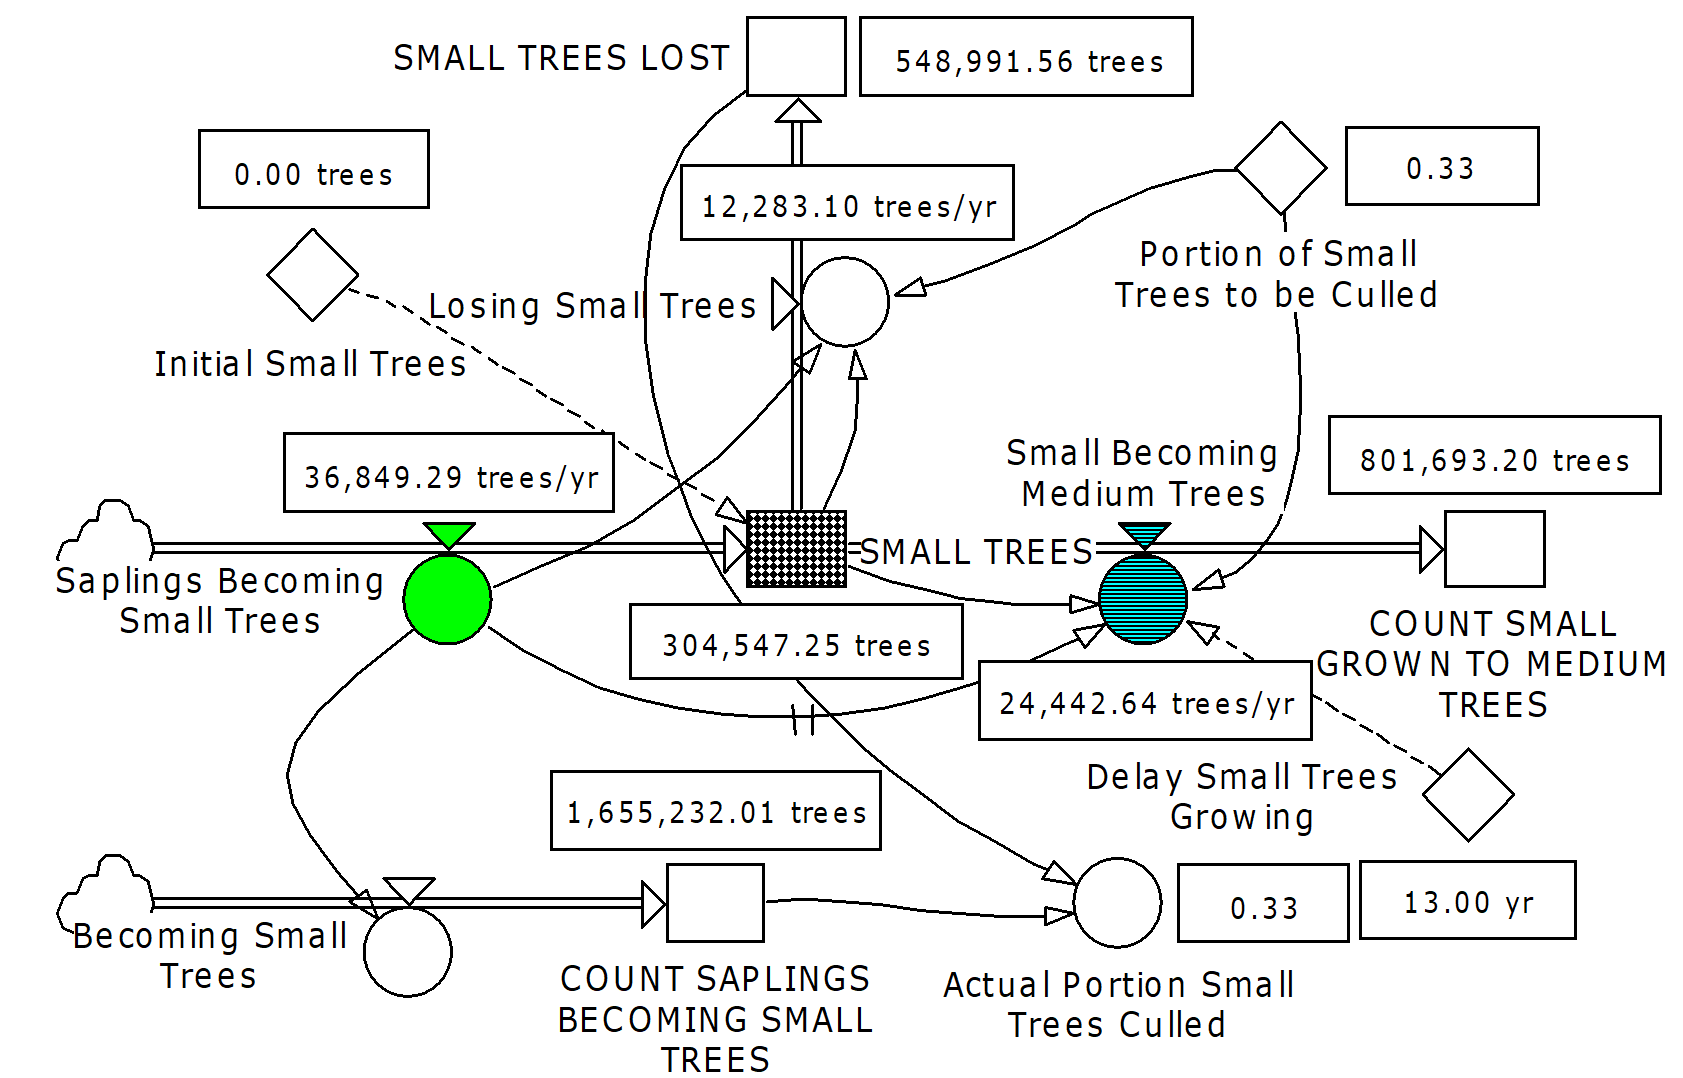
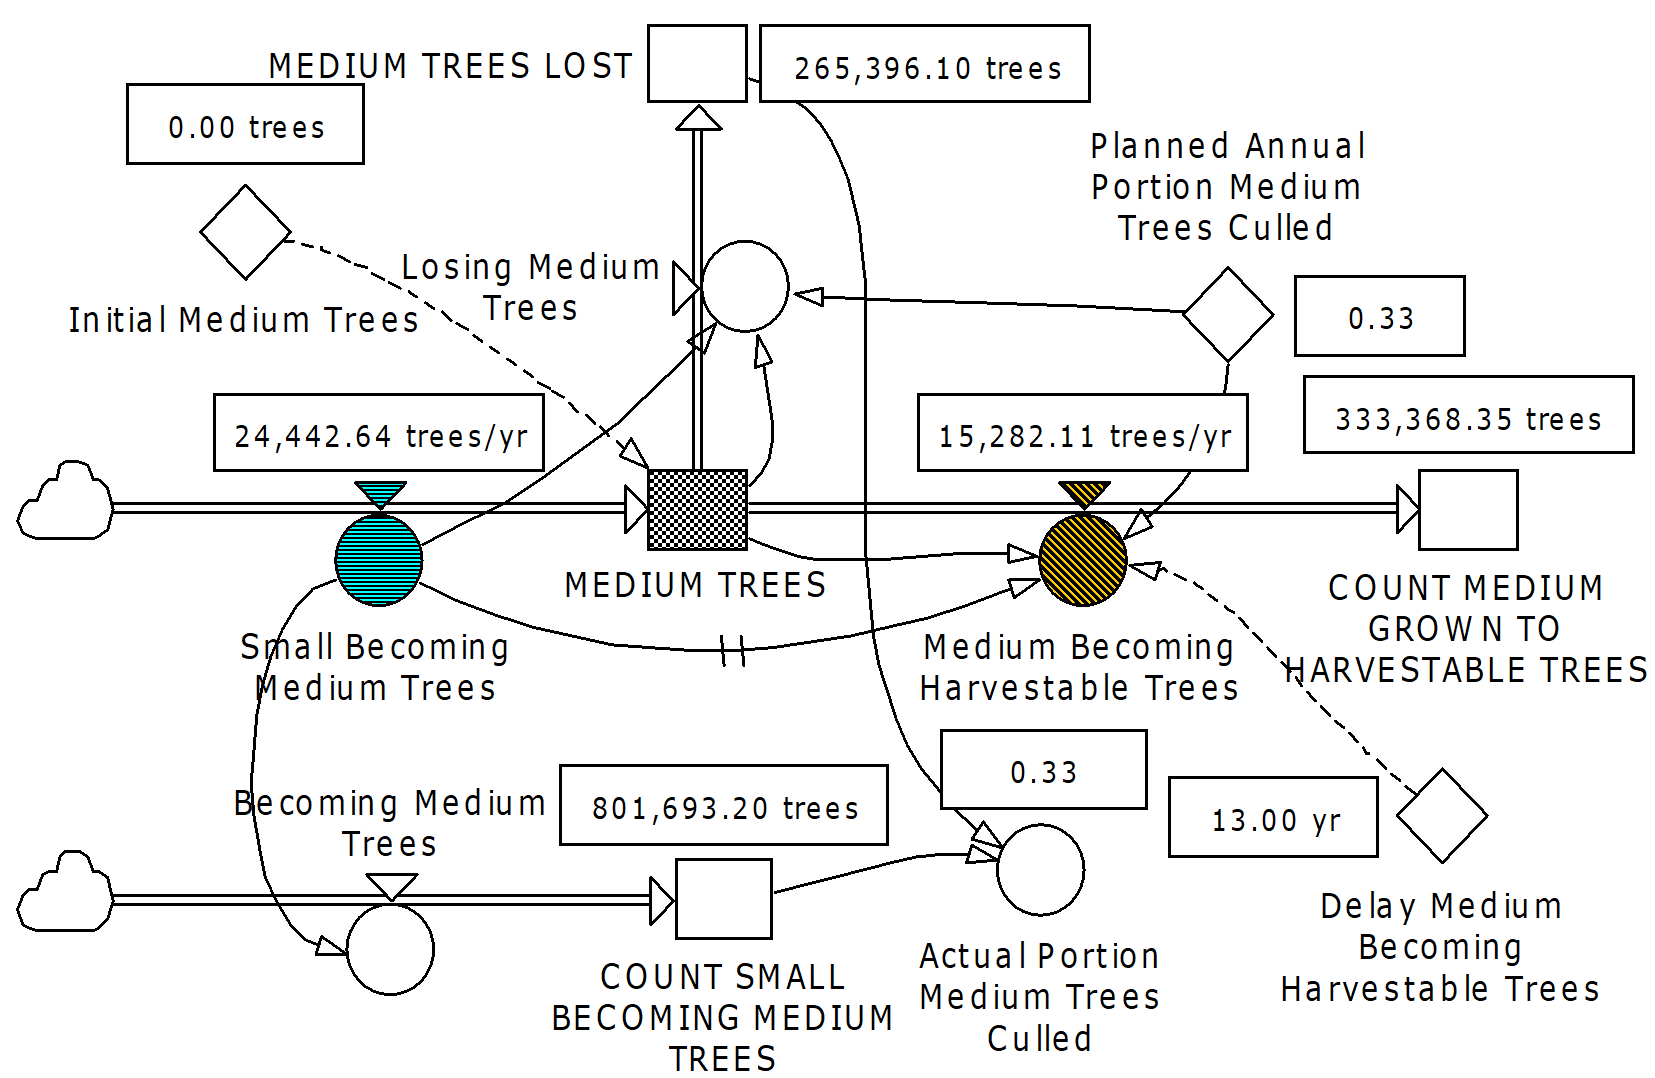
Key variables for the module Figure 5-7 are shown in Table 5-6, and key variables for the module Figure 5-8 are shown in Table 5-7.
Table 5-6. Key Variables Used In Model at Figure 5-7
Variable | Definition | Comment |
|---|---|---|
Saplings Becoming Small Trees | IF(SAPLINGS>0<<trees>>,1,0) *(DELAYPPL(Planting, 'Delay Saplings Growing',0<<trees/yr>>)* (1–('Portion of Saplings to be Culled'))) *IF('Portion of Saplings to be Culled'<=1,1,0) | Snapshot of Saplings Becoming Small Trees taken from SAPLINGS module and pasted into SMALL TREES module. When the value of this variable changes in the preceding module, a mirror-image is produced in this module. This is exactly the same as having the two modules physically connected. |
Losing Small Trees | IF('SMALL TREES'>0<<trees>>,1,0)* 'Portion of Small Trees to be Culled' *'Saplings Becoming Small Trees' | Losing Small Trees is calculated before Small Becoming Medium Trees. That is, trees are lost through culling and are, therefore, not available to become medium trees. |
SMALL TREES | 'Initial Small Trees' | Flows (automatically calculated by Powersim™ Studio): + dt * (Saplings Becoming Small Trees) – dt * (Losing Small Trees) – dt * (Small Becoming Medium Trees) |
Small Becoming Medium Trees | IF('SMALL TREES'>0<<trees>>,1,0) *(DELAYPPL('Saplings Becoming Small Trees', 'Delay Small Trees Growing', 0<<trees/yr>>)* (1–'Portion of Small Trees to be Culled')) *IF('Portion of Small Trees to be Culled'<=1,1,0) | This rate-controlling variable is used to link to the next (downstream) module. |
Table 5-7. Key Variables Used In Model at Figure 5-9
Variable | Definition | Comment |
|---|---|---|
Small Becoming Medium Trees | IF('SMALL TREES'>0<<trees>>,1,0) *(DELAYPPL('Saplings Becoming Small Trees', 'Delay Small Trees Growing', 0<<trees/yr>>)* (1–'Portion of Small Trees to be Culled')) *IF('Portion of Small Trees to be Culled'<=1,1,0) | Snapshot of Small Becoming Medium Trees taken from SMALL TREES module and pasted into MEDIUM TREES module. When the value of this variable changes in the preceding module, a mirror-image is produced in this module. This is exactly the same as having the two modules physically connected. |
Losing Medium Trees | IF('MEDIUM TREES'>0<<trees>>,1,0)* 'Portion of Medium Trees to be Culled' *'Small Becoming Medium Trees' | |
Medium Trees | 'Initial Medium Trees' | Flows (automatically calculated by Powersim™ Studio): + dt * (Small Becoming Medium Trees) – dt * (Losing Medium Trees) – dt * (Medium Becoming Harvestable Trees) |
Medium Becoming Harvestable Trees | IF('MEDIUM TREES'>0<<trees>>,1,0) *(DELAYPPL('Small Becoming Medium Trees', 'Delay Medium Becoming Harvestable Trees', 0<<trees/yr>>)* (1–'Portion of Medium Trees to be Culled')) *IF('Portion of Medium Trees to be Culled'<=1,1,0) | This rate-controlling variable is used to link to the next (downstream) module. |
Key variables for the SUSTAINED HARVESTING module Figure 5-9 are shown in Table 5-8.
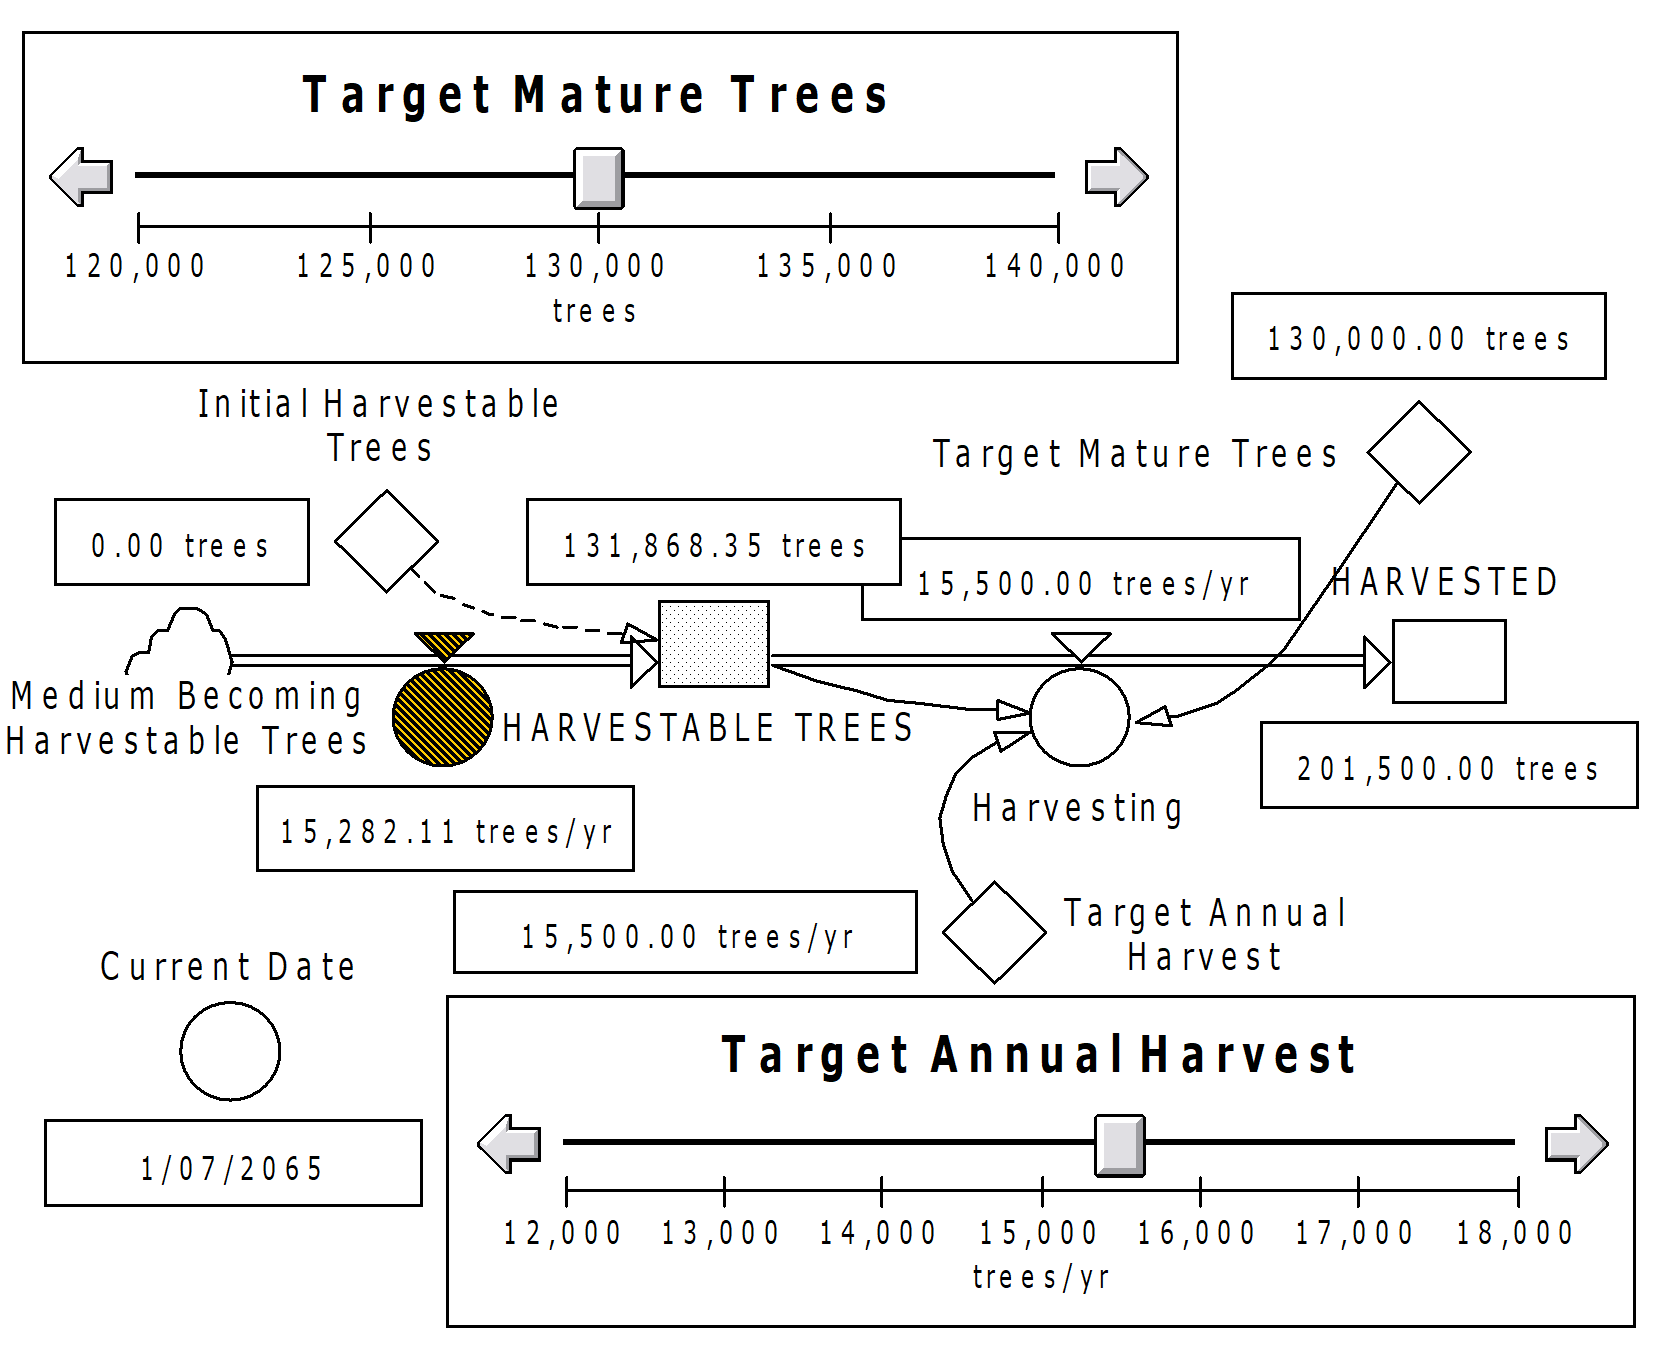
Table 5-8. Key Variables Used In SUSTAINED HARVESTING Module at Figure 5-9
Variable | Definition | Comment |
|---|---|---|
Medium Becoming Harvestable Trees | IF('MEDIUM TREES'>0<<trees>>,1,0) *(DELAYPPL('Small Becoming Medium Trees', 'Delay Medium Becoming Harvestable Trees', 0<<trees/yr>>)* (1–'Portion of Medium Trees to be Culled')) *IF('Portion of Medium Trees to be Culled'<=1,1,0) | Snapshot of Medium Becoming Harvestable Trees taken from MEDIUM TREES module and pasted into HARVESTABLE TREES module. When the value of this variable changes in the preceding module, a mirror-image is produced in this module. This is exactly the same as having the two modules physically connected. |
Harvestable Trees | 'Initial Harvestable Trees' | Flows (automatically calculated by Powersim™ Studio): + dt * (Medium Becoming Harvestable Trees) – dt * (Harvesting) |
Harvesting | IF('HARVESTABLE TREES'>'Target Mature Trees', ('Target Annual Harvest'),0<<trees/yr>>) |
The areas of forest planted, according to size of tree, are calculated using the module shown in Figure 5-10. Key variables for the module Figure 5-10 are shown in Table 5-9. A graph of the results from FOREST AREA module are shown in Figure 5-11.
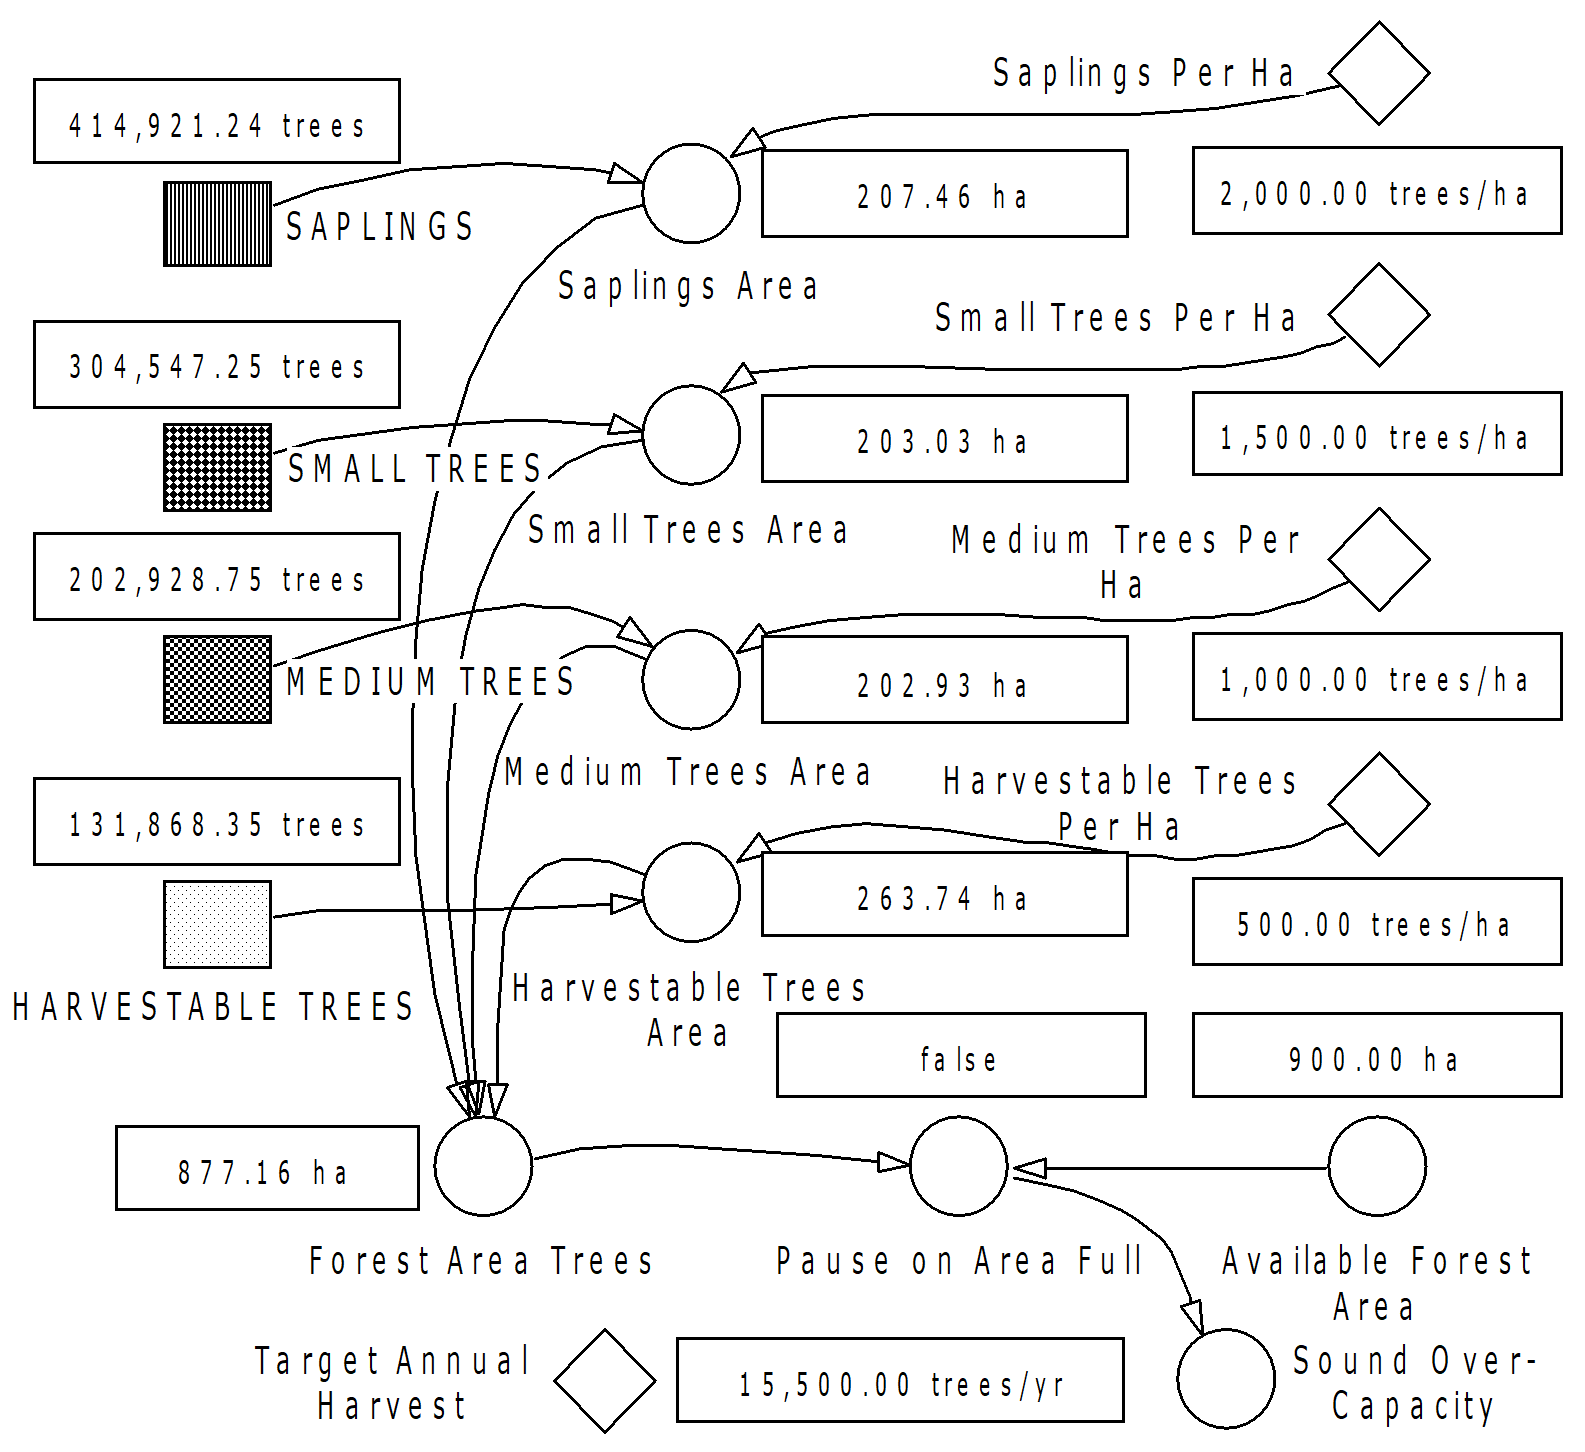
Table 5-9. Key Variables Used In FOREST AREA Module at Figure 5-10
Variable | Definition | Comment |
|---|---|---|
SAPLINGS | Snapshot of SAPLINGS taken from SAPLINGS module and pasted into this module. When the value of this variable changes in the SAPLINGS module, a mirror-image is produced in this module. | |
SMALL TREES | Similar to SAPLINGS. | |
MEDIUM TREES | Similar to SAPLINGS. | |
HARVESTABLE TREES | Similar to SAPLINGS. | |
Saplings Area | SAPLINGS/'Saplings Per Ha' | |
Small Trees Area | 'SMALL TREES'/'Small Trees Per Ha' | |
Medium Trees Area | 'MEDIUM TREES'/'Medium Trees Per Ha' | |
Harvestable Trees Area | 'HARVESTABLE TREES'/'Harvestable Trees Per Ha' | |
Forest Area Growing | 'Saplings Area' + 'Small Trees Area' + 'Medium Trees Area' + 'Harvestable Trees Area' | |
Pause on Area Full | PAUSEIF('Forest Area Growing'>'Available Forest Area') | Pauses simulation when the area available for forest is full. |
Sound Over-Capacity | SOUND(IF('Pause on Area Full'=TRUE,1,0)) |
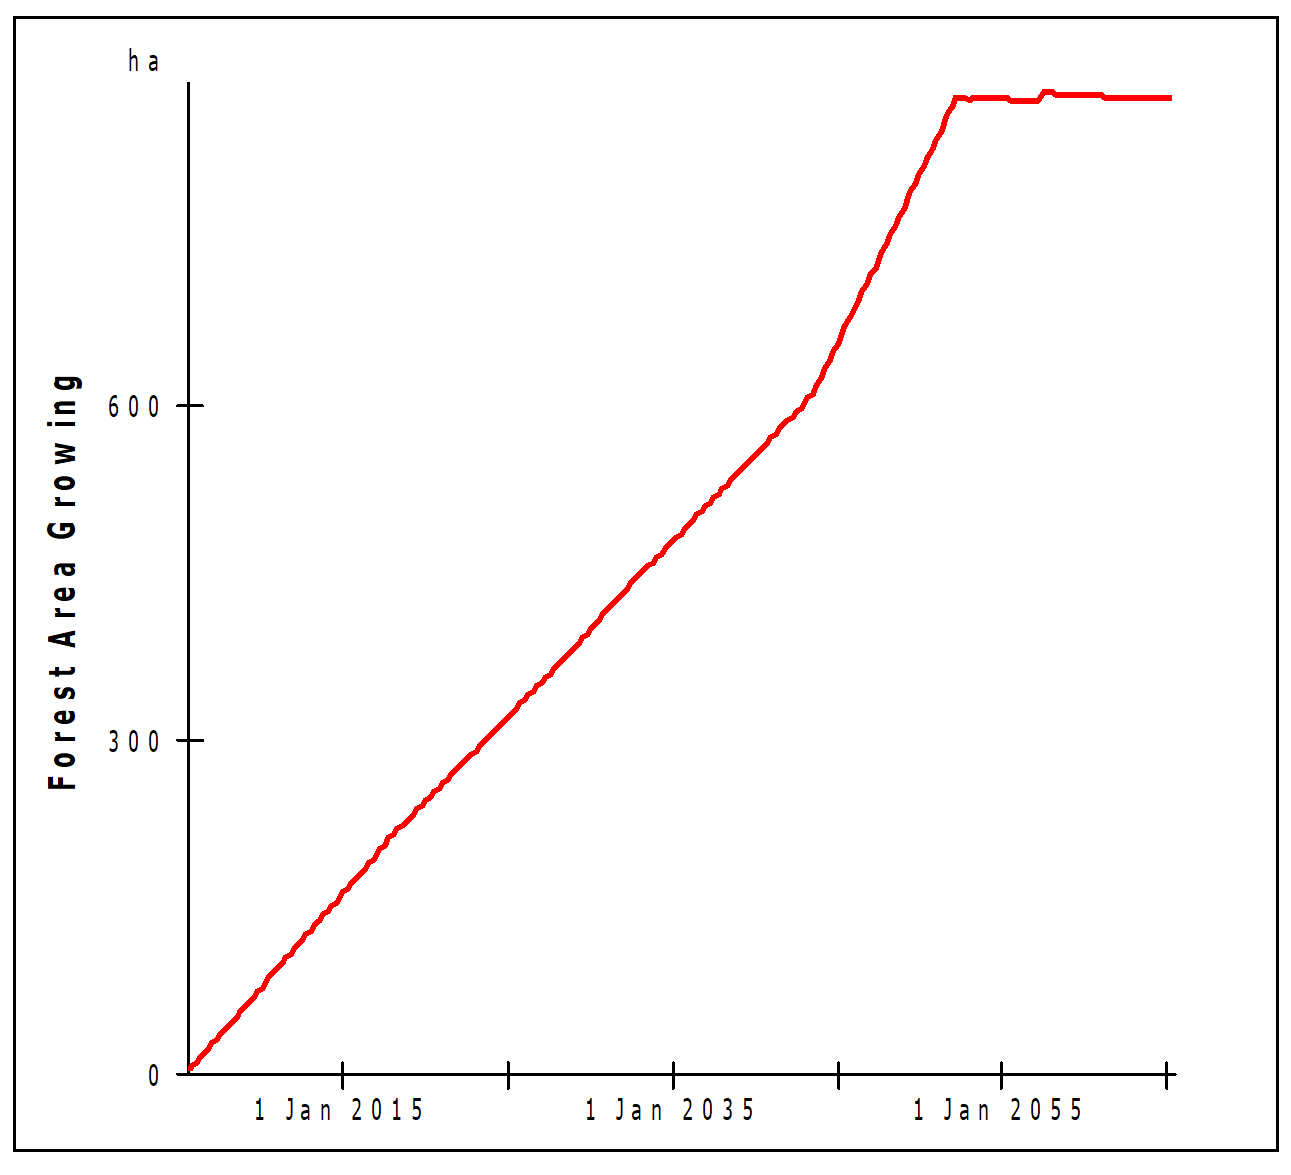
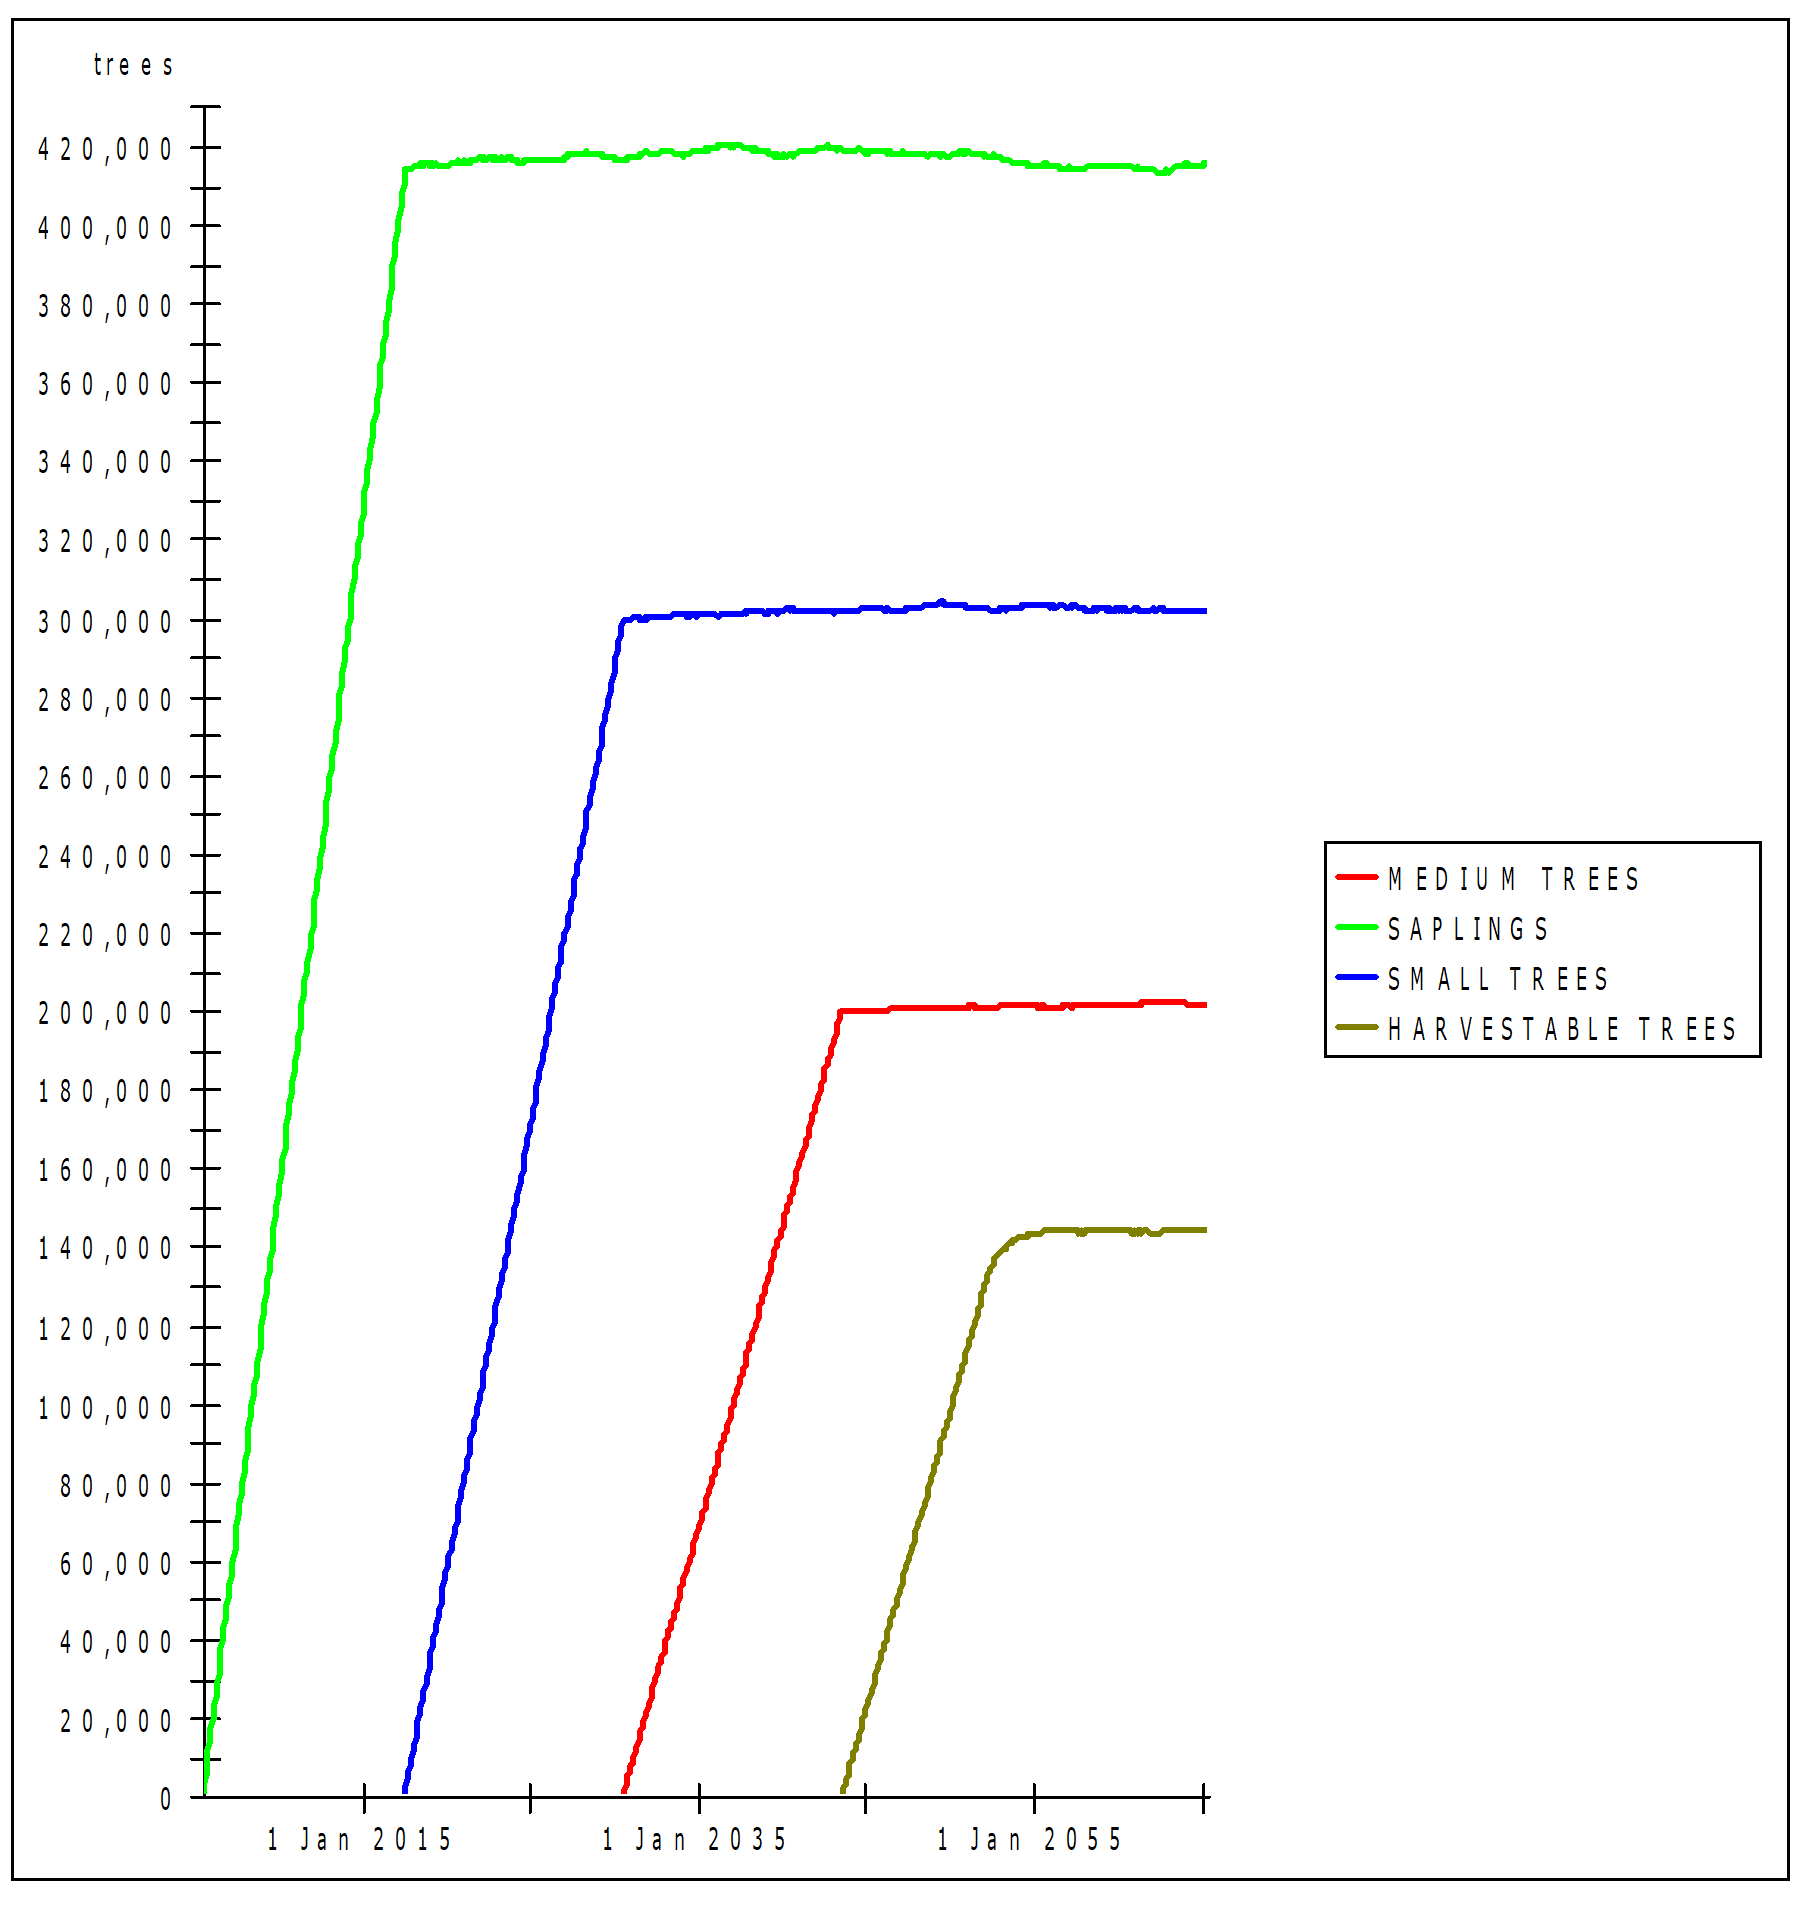
The area of forest growing increases steadily with planting of saplings and subsequent growth as small and medium trees. The increased slope, commencing just before 2045, indicates the growth of harvestable trees before harvesting commences. Once harvesting commences, the area of forest is stabilised at just under 900 hectares.
Graphs of each of the results of the integrated modules are shown in Figure 5-12.