
4.2.1 Breaking The Model Down To Individual Modules
The model, Figure 4-11, which represents our initial top-down view of the population problem, can be broken down to specific modules each of which can be handled separately. We must always remaining cognisant of the context within which these modules exist. That is, the problem boundary will be re-defined and redrawn for each module. At a later time, these will be reconstructed bottom-up to form a working model of the problem. When completed, this model will look like Figure 4-11.
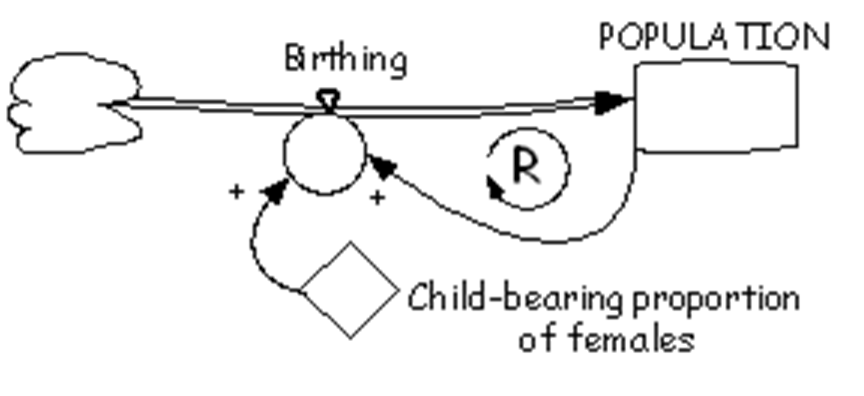
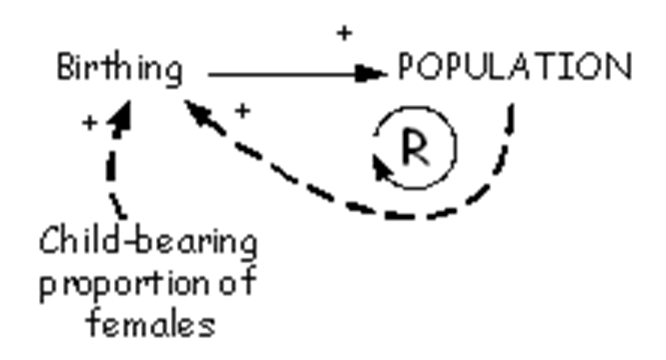
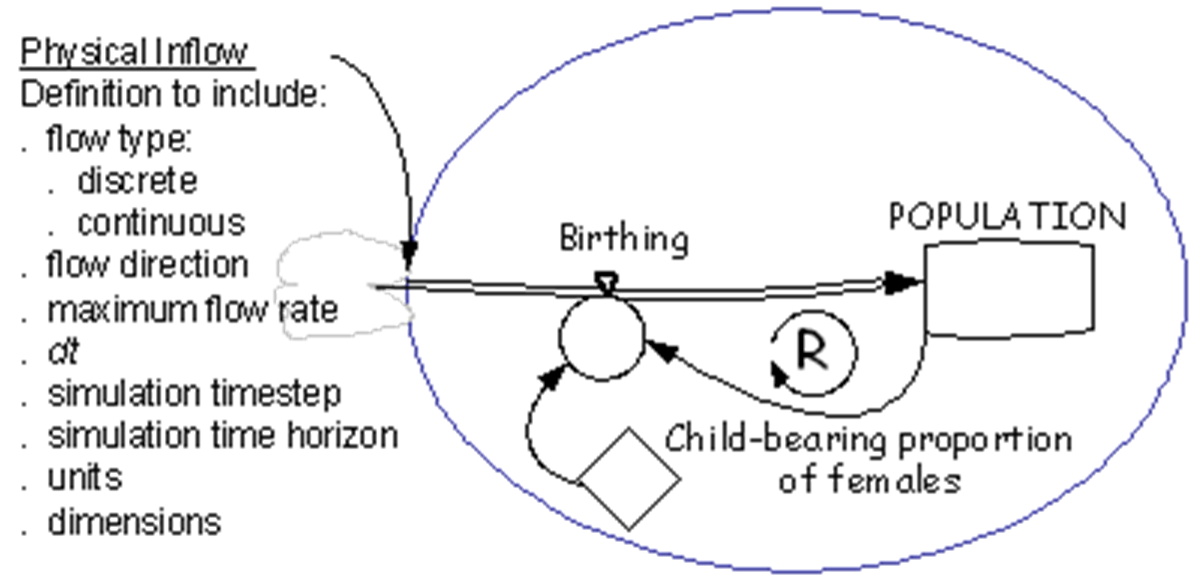
The basics of the separate modules have been described. Now, their functional descriptions are refined so that each of the modules can be built. Details of the Birthing Module are provided at Figures 4-12, 4-13, and 4-14.
The Positive First Order Feedback Module, as explained by Sterman (2000: 266) and defined in Appendix F.5, is the basis for the first module (Birthing). Re-stated in terms of the required variable names, it is shown at Figure 4-12.
The alternate representation in the form of an influence diagram is shown at Figure 4-13.
Now, as we define the module boundary shown in Figure 4-14, in addition to defining the variables POPULATION, Child-bearing proportion of females and Birthing, we must define the physical inflow. This physical inflow crosses the module boundary. Defining the physical inflow is important both to the creation of the modelling project and simulation settings and to ensure that the module remains compatible with others we will create.
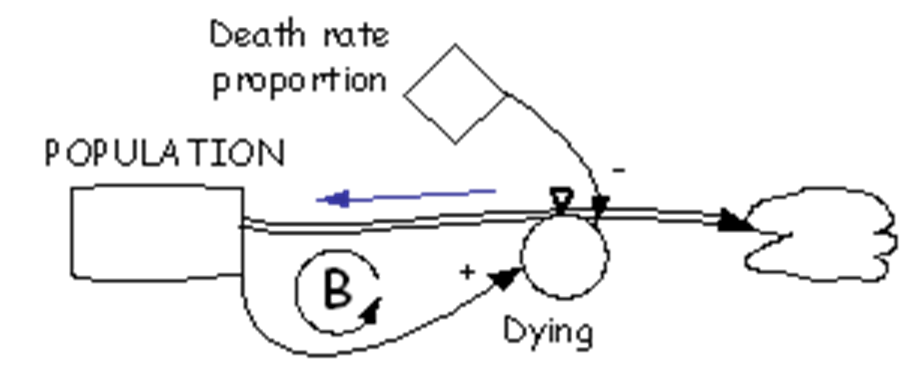
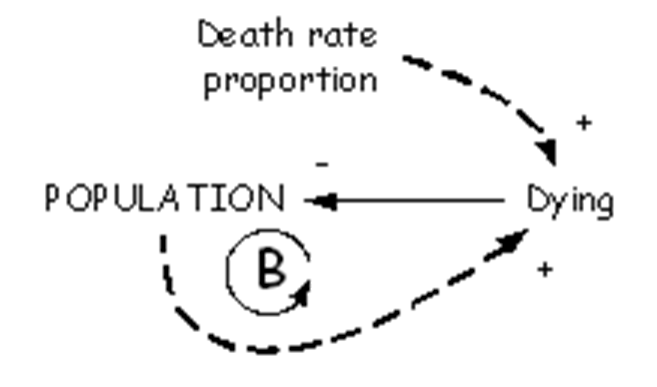
The Negative First Order Feedback Module, as defined by Sterman (2000: 275), is the basis for the second module (Dying). Re-stated in terms of the required variable names, it is shown at Figure 4-15. Note the addition of an arrow indicating the influence of Dying on POPULATION. This arrow shows the direction of influence from the influencing variable to the influenced variable and shows how the causal loop is completed. Also note that the direction of influence runs contrary to the direction of flow.
The alternate representation in the form of an influence diagram is shown at Figure 4-16.
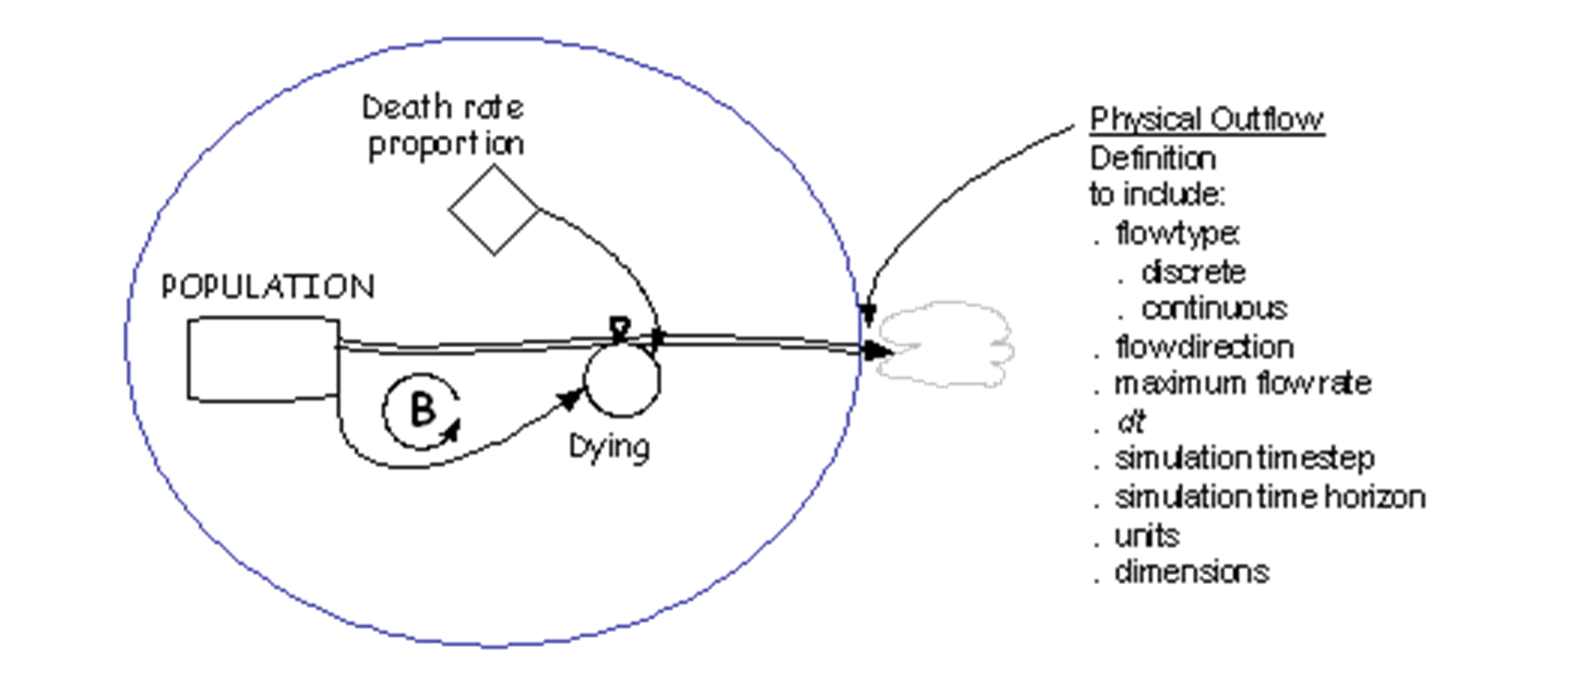
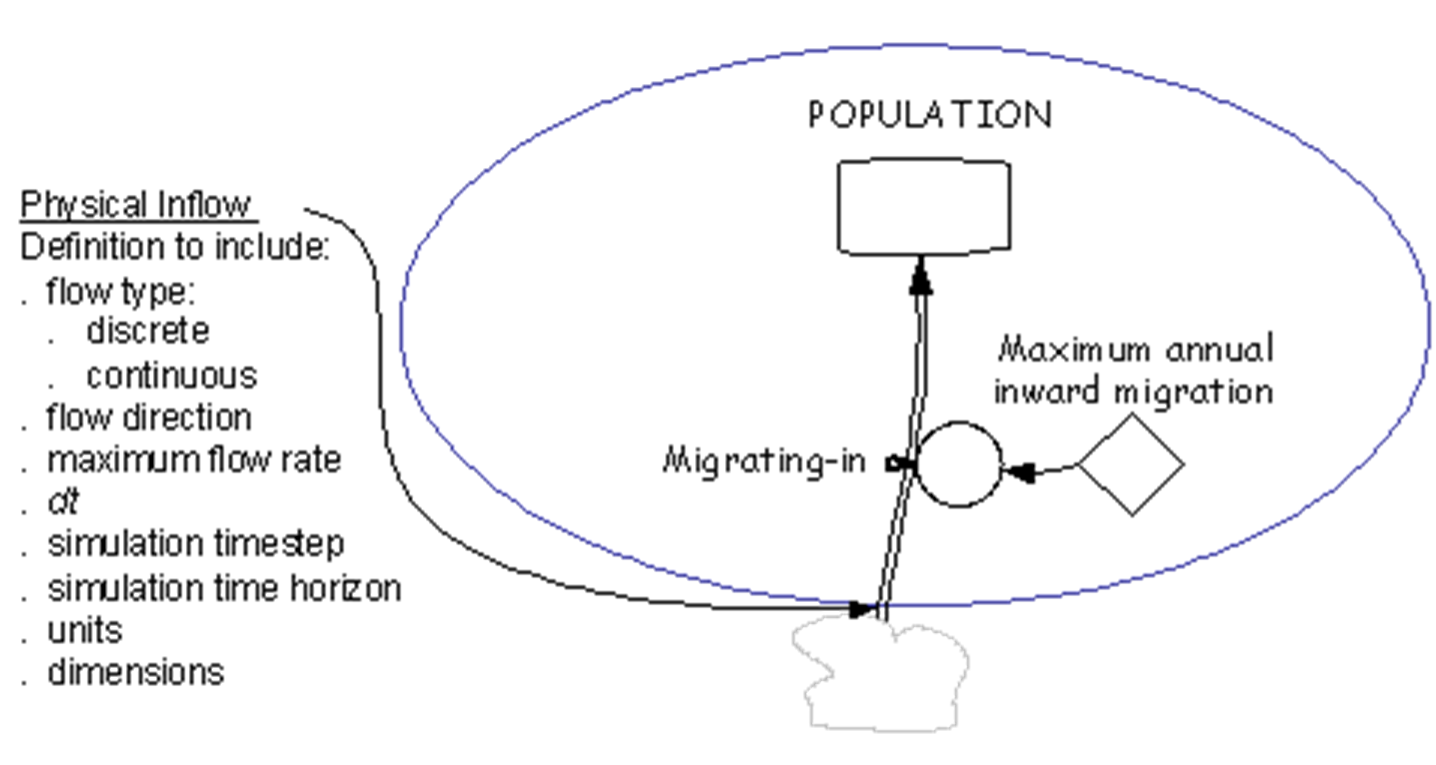
The stock-and-flow representation of the Dying module is at Figure 4-17. Following a similar procedure, the Migrating-in module is described through Figures 4-18 and 4-19. Because the module is defined in terms of the stock-and-flow diagram (rather than the influence diagram—though this could be done), the intervening step of defining the stock-and-flow diagram (without the boundary indicated) has been omitted.
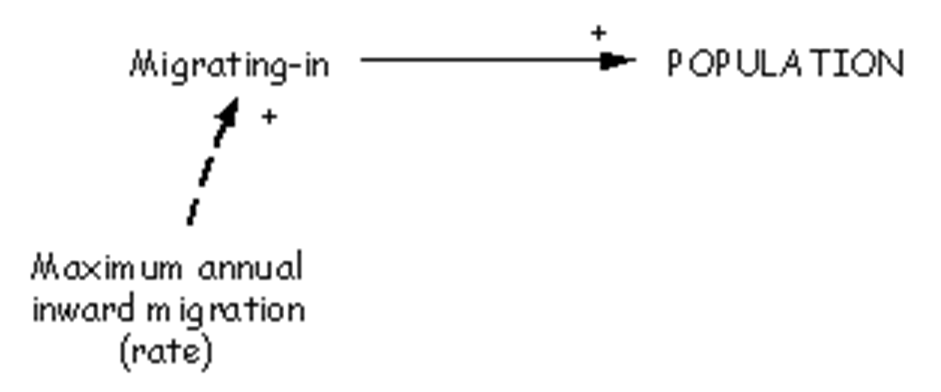
The influence diagram for Migrating-in is shown at Figure 4-18.
The Migrating-in module is shown in Figure 4-19.
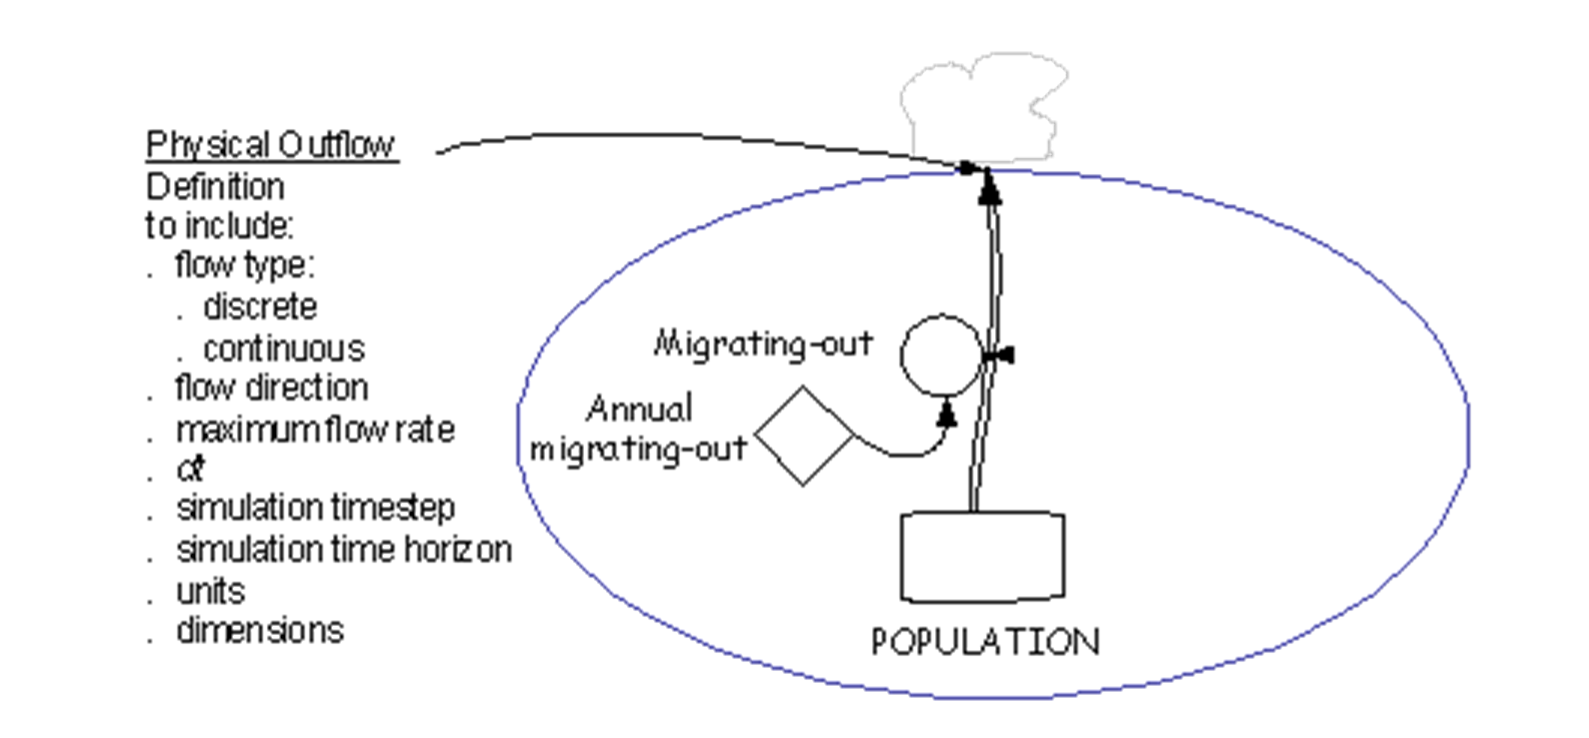
The Migrating-out module is shown as a stock-and-flow diagram in Figure 4-20.
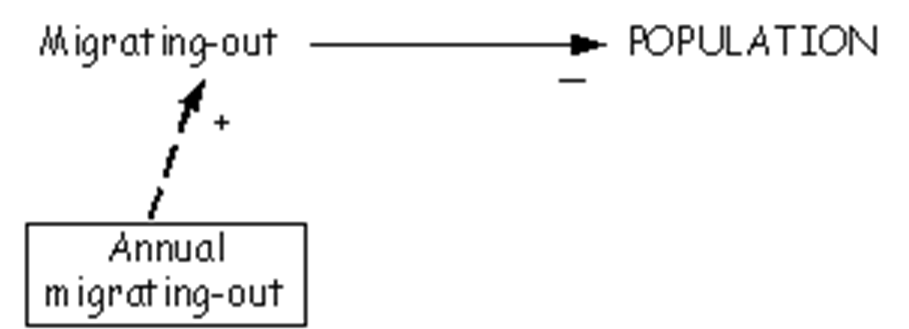
The equivalent influence diagram for Migrating-out is shown at Figure 4-21. Note that the solid arrow indicated the direction of influence for the material flow rather than the direction of the actual material flow.
Note that Annual migrating-out is imposed externally (see assumptions in 4.1.9), though we initially depicted it as endogenous in our stock-and-flow diagram.
References
- Sterman, J.D., 2000, Business Dynamics: Systems Thinking and Modelling for a Complex World, Irwin McGraw-Hill.