
4.1.7 Dynamic Hypotheses—Dying
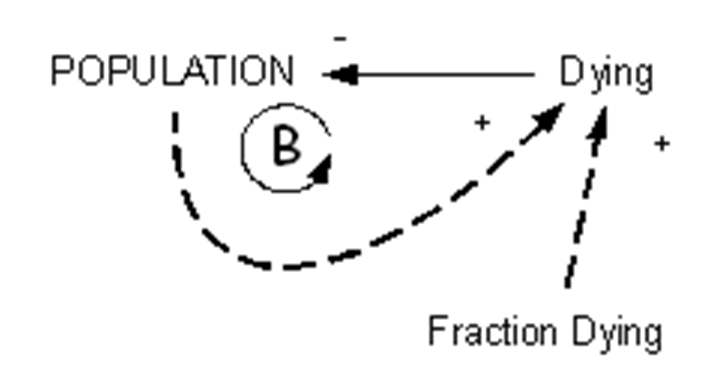
Textual Description. Each year a fraction of the population dies. This is part of a natural process. The bigger the population is, the greater the number of people dying.
Module Influence Diagram. The influence diagram for this module is shown in Figure 4-3. This, and the stock-and-flow equivalent shown in Figure 4-4, represents an archetypical linear first-order positive feedback module.
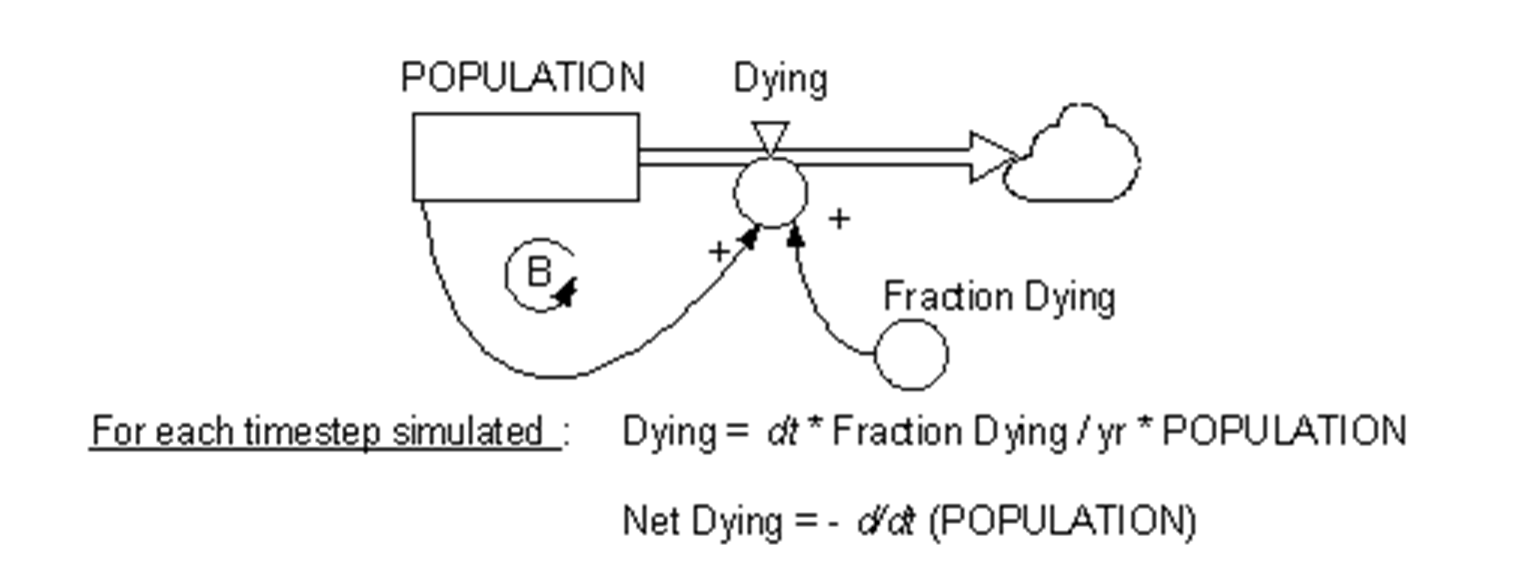
Module Stock-and-Flow Diagram. The stock-and-flow diagram for this module is shown in Figure 4-4. This is an archetypical linear first-order negative feedback module. Further details are provided in Appendix F6.
Assumptions. The following assumptions apply to this module and to the model overall:
- Deaths occur through natural ageing.
- Deaths from natural causes, including a range of known and common diseases occur at a steady rate.
- There are no age-group distinctions (though death rates would be expected to be higher amongst older persons).
Specific Exclusions from This Module. The following are specifically excluded from this module:
- Deaths from unusual or rarely-occurring events such as natural disasters.
- Deaths from epidemics or pandemics.
Specific Inclusions in this Module. The following are specifically included in this module:
- Initial size of population.