4.2.15 Analysing The Behaviour
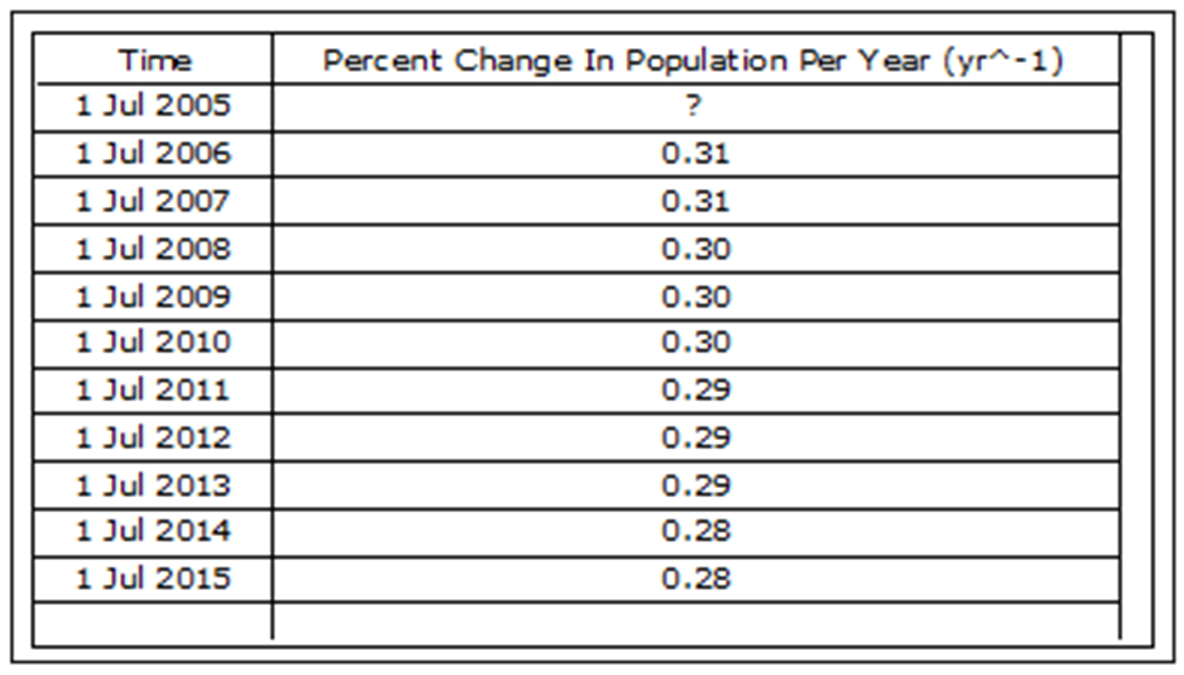
Once the model has been built and verified to ensure that it works as intended (details of verification are not included), dynamic behaviour is analysed. The model can be used now to analyse the change in population over the period simulated. Details are shown in Figure 4-29.
With only 3.5% of females giving birth each year, and migrating-in held constant (in effect, through a freeze in commencements of building new dwellings) the percentage increase in population drops from 2.0% in 2006 to 1.71% in 2015. It is reasonable to assume that the value at commencement of the simulation (July 2005) sufficiently close to 2.0% not to matter. How the model was set up to calculate this is shown at Figure 4-30. The icons of the auxiliary variables either changed or added to produce this updated model are highlighted. These variables are defined at Table 4-11.
Simulating this model over the 10 years shows that the population is growing but growth is becoming less than it should. Details, calculated in terms of percentage change per year, are shown in Figure 4-31.
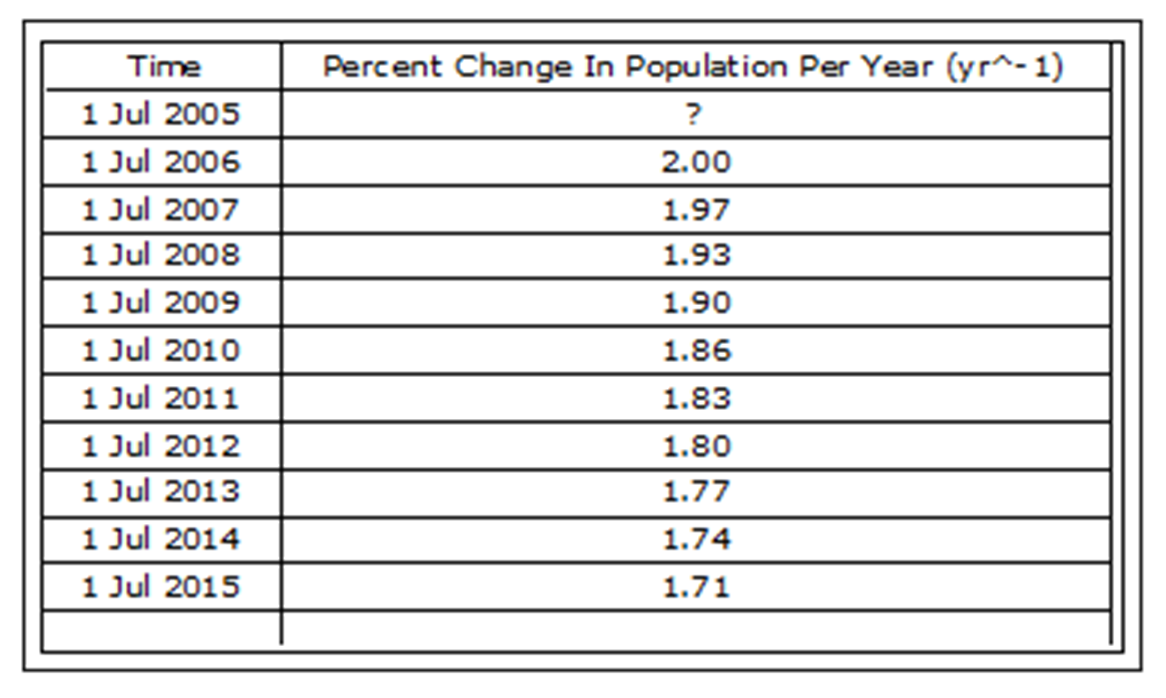
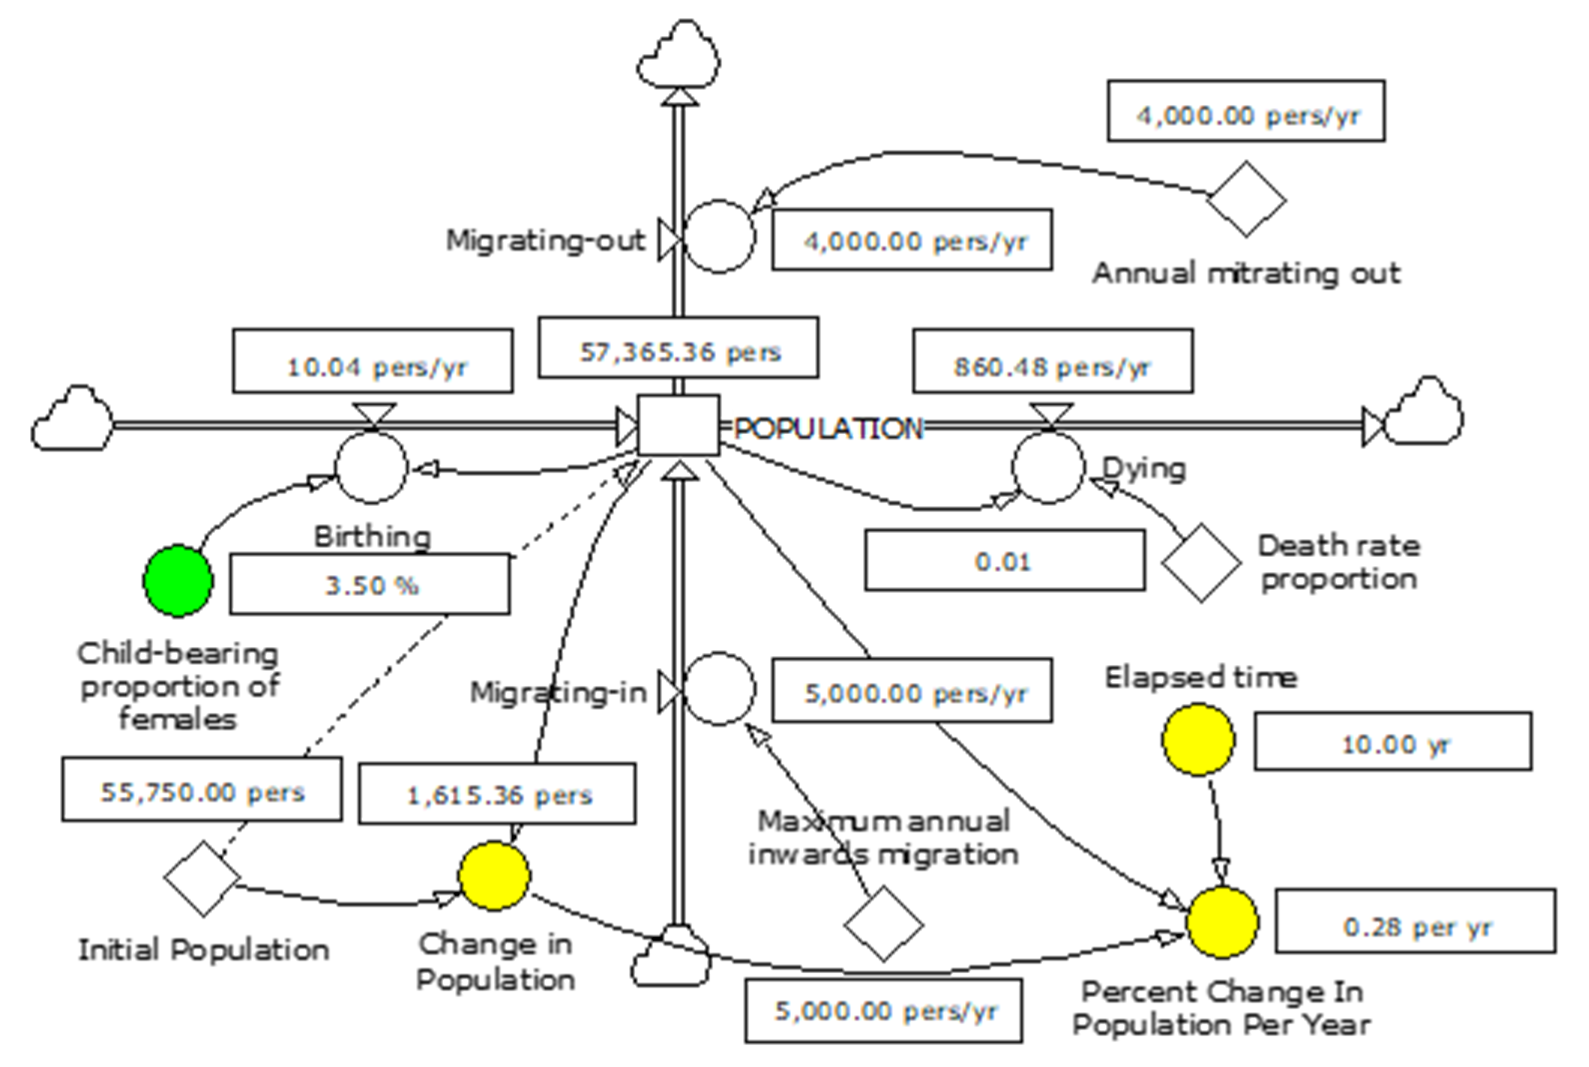
Table 4-11. POPULATION Model Variables Added or Changed
Variable | Definition | Comment |
|---|---|---|
Child-bearing proportion of females | GRAPH((TIME-STARTTIME),0<<yr>>,1<<yr>>, {3.5,3.5,3.5,3.5,3.5,3.5,3.5,3.5, 3.5,3.5})*1<<%>> | Changed to the form of a graph with annual data in anticipation of further information becoming available, which might prove relevant to our analysis. Note that this variable has also been changed from a constant to an auxiliary. If this is not done, Powersim™ Studio will read the first value (3.5%) for each time-step in the simulation |
Change in Population | POPULATION-'Initial Population' | |
Elapsed time | (TIME-STARTTIME) | This displays the time elapsed since the start of the simulation. |
Percentage Change in Population Per year | 'Change in Population'/'Elapsed time'/POPULATION*100 |