
4.1.9 Dynamic Hypothesis—Migrating-Out
Textual Description. Part of the annual decline in population is due to some citizens choosing to leave Charmville.
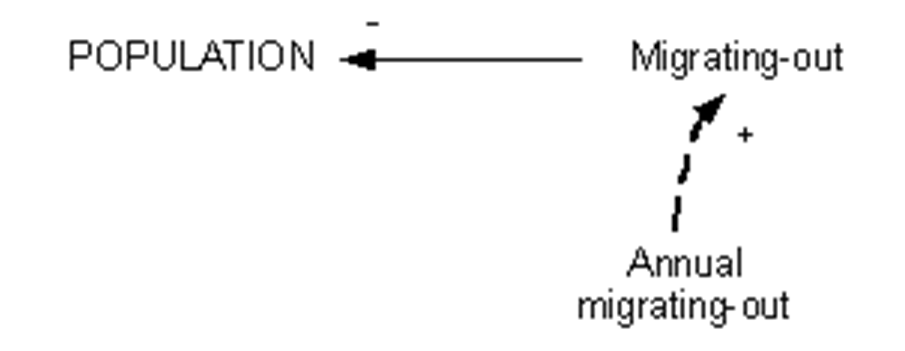
Module Influence Diagram. The influence diagram for migrating-out is shown in Figure 4-7.
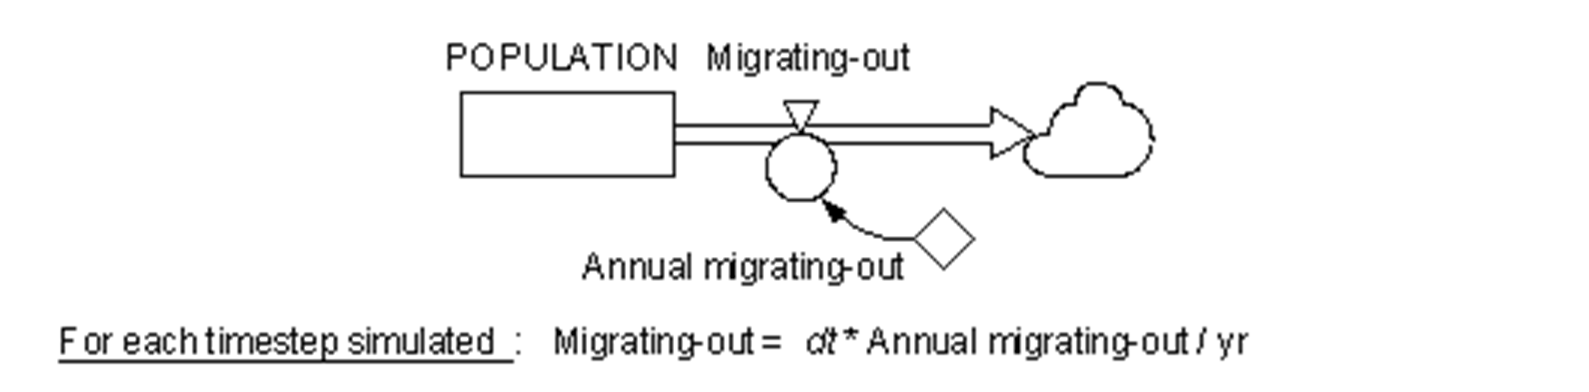
Module Stock-and-Flow Diagram. The stock-and-flow diagram for migrating-out is shown in Figure 4-8.
Assumptions. The following assumptions apply to this module and to the model overall:
- Migrating-out from Charmville is steady.
- Migrating-out from Charmville is controlled by exogenous factors such as:
- State of the country’s economy.
- Federal government policy directed at encouraging settle in other parts of the country.
- Rate of Migrating-out is influenced by a range of factors such as employment opportunities elsewhere.
- There are no age-group distinctions made in this model.
Specific Exclusions From This Module. The following are specifically excluded:
- Considerations of ages of migrants.
- Considerations of the size of population on migration—consequently, there is no information link from POPULATION to Migrating-out.
- Considerations of external forces which might cause Charmville citizens to leave.
Specific Inclusions in this Module. The following are specifically included in this module:
- Initial size of population.