
6.9.3 Developing An Influence Diagram For Threetwoone’s Problems
The influence diagram becomes an indispensable hypothesis for subsequent investigative discussions and, with amendment by the group, or at least by agreement among the principal stakeholders, becomes the basis for subsequent model development. Conventions for influence diagramming (Coyle, 1996) are shown at Figure 6-11.
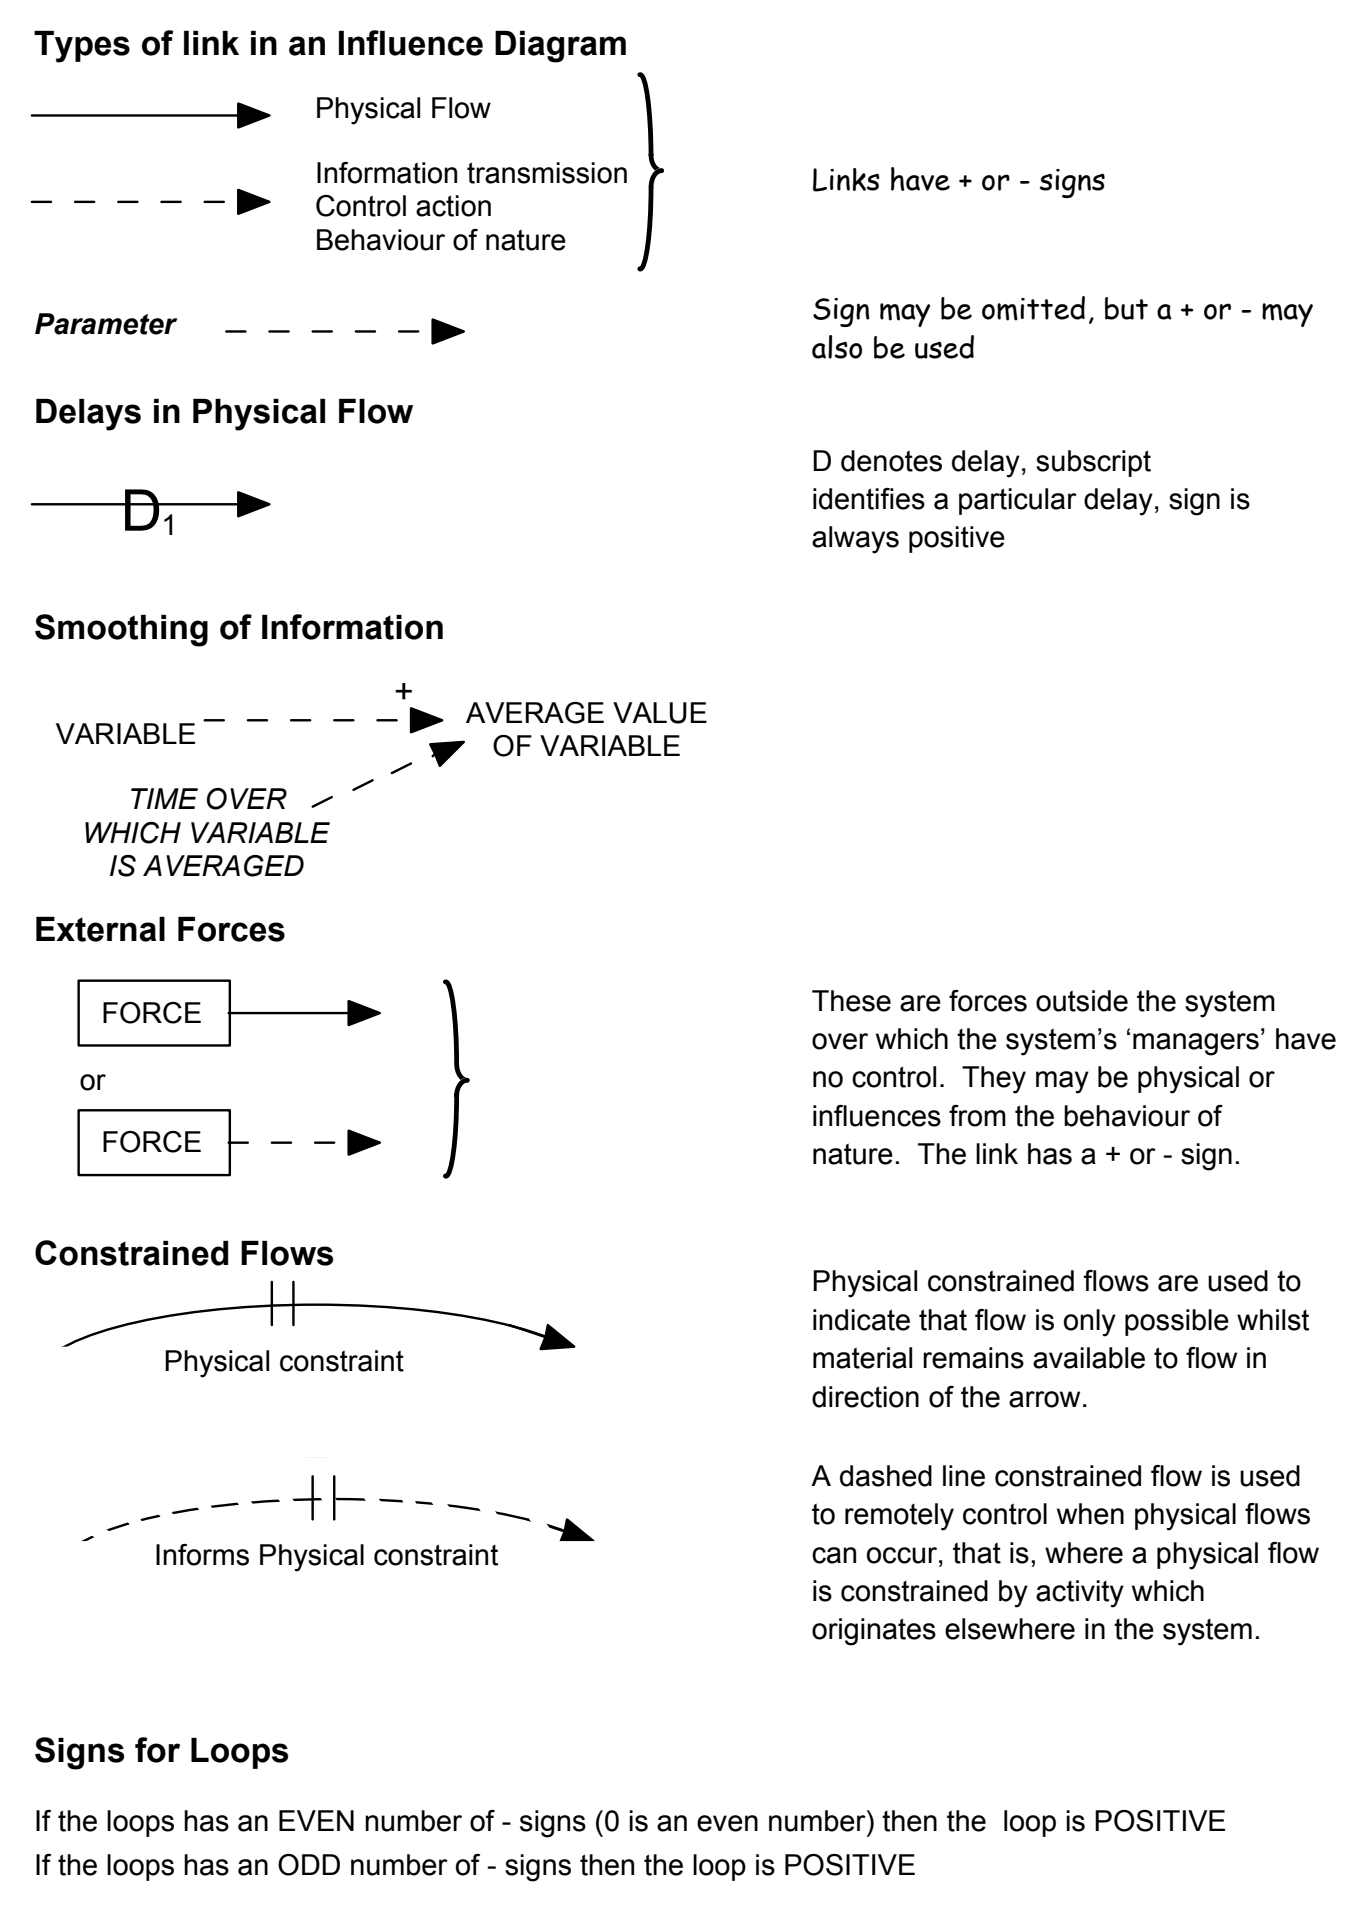
Building influence diagrams is necessary regardless of any subsequent choice to develop quantitative models. Stakeholders must have the influence diagramming conventions explained to them in terms they understand. This explanation must be extended to cover any influence diagrams produced. This is essential to enable their involvement in the revision and progressive refinement of influence diagrams.
Through influence diagramming, dominant mechanisms are identified and the links are mapped for all to see, appreciate, challenge, and ultimately accept or reject. Through further cycles of analysis, strategic assumptions are critically reviewed until the diagram is moderated to a form acceptable to the nominal group of stakeholders. The basic influence diagrams for the three sub-models identified, are at Figures 6-12, 6-13, and 6-14.
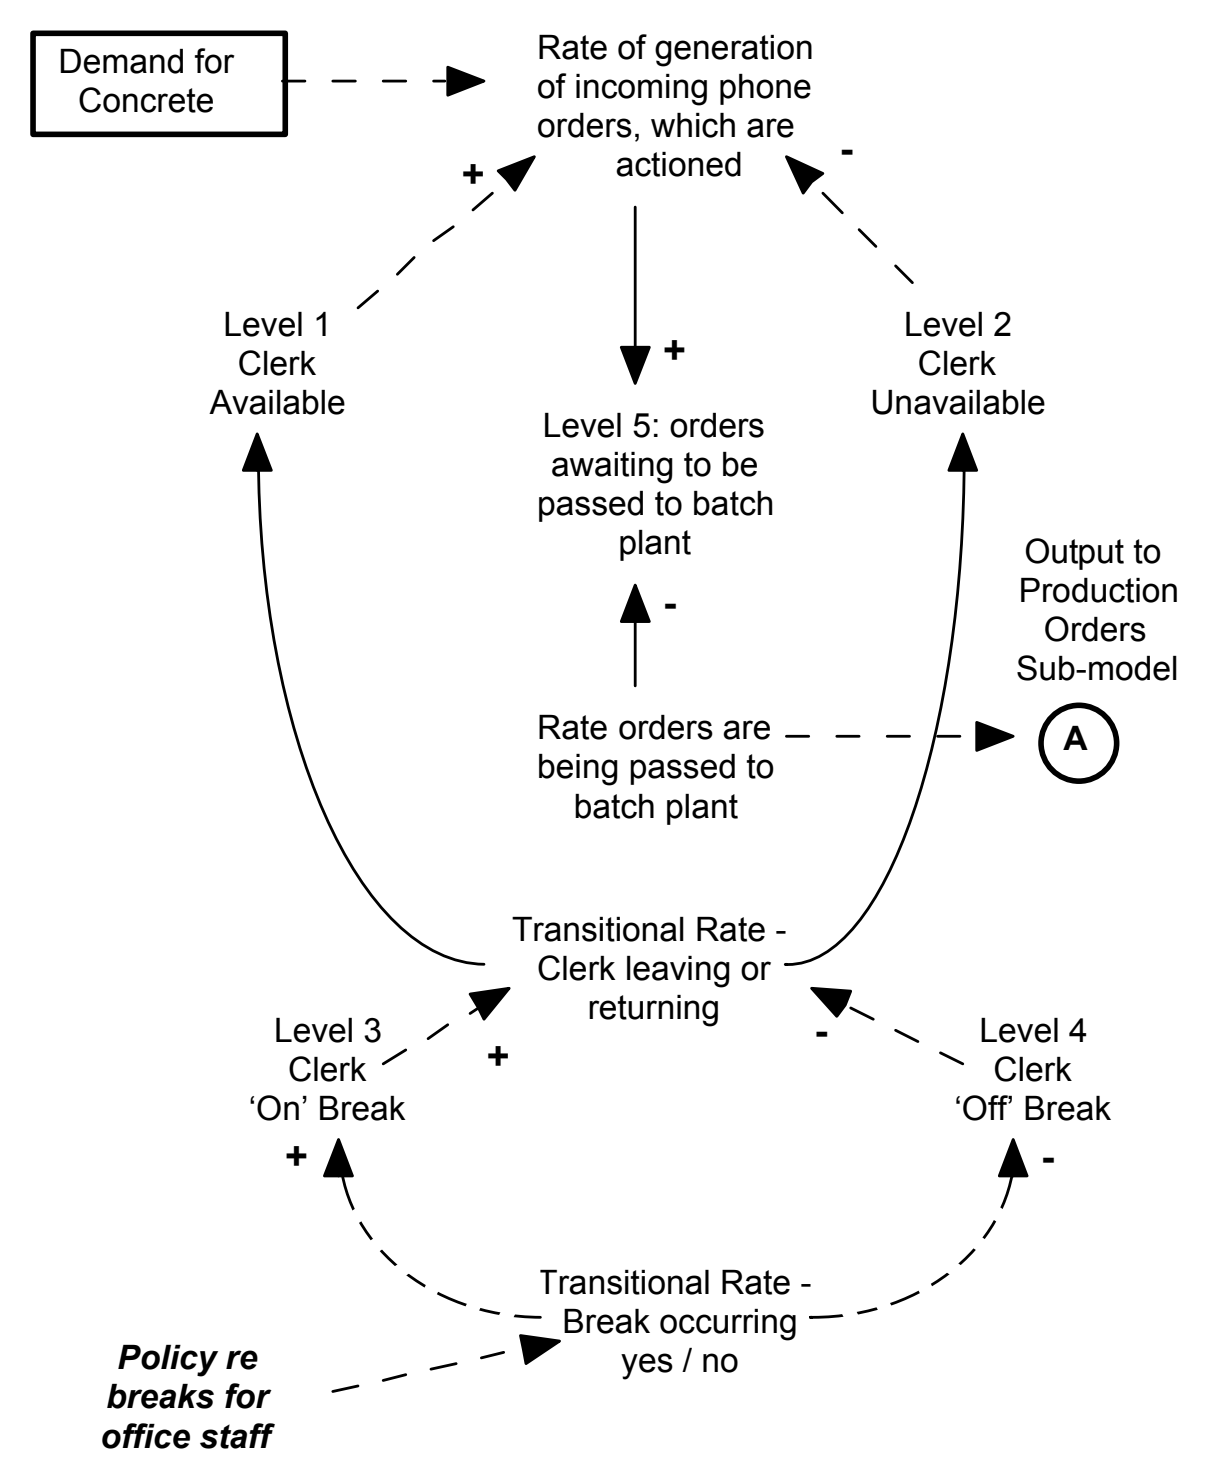
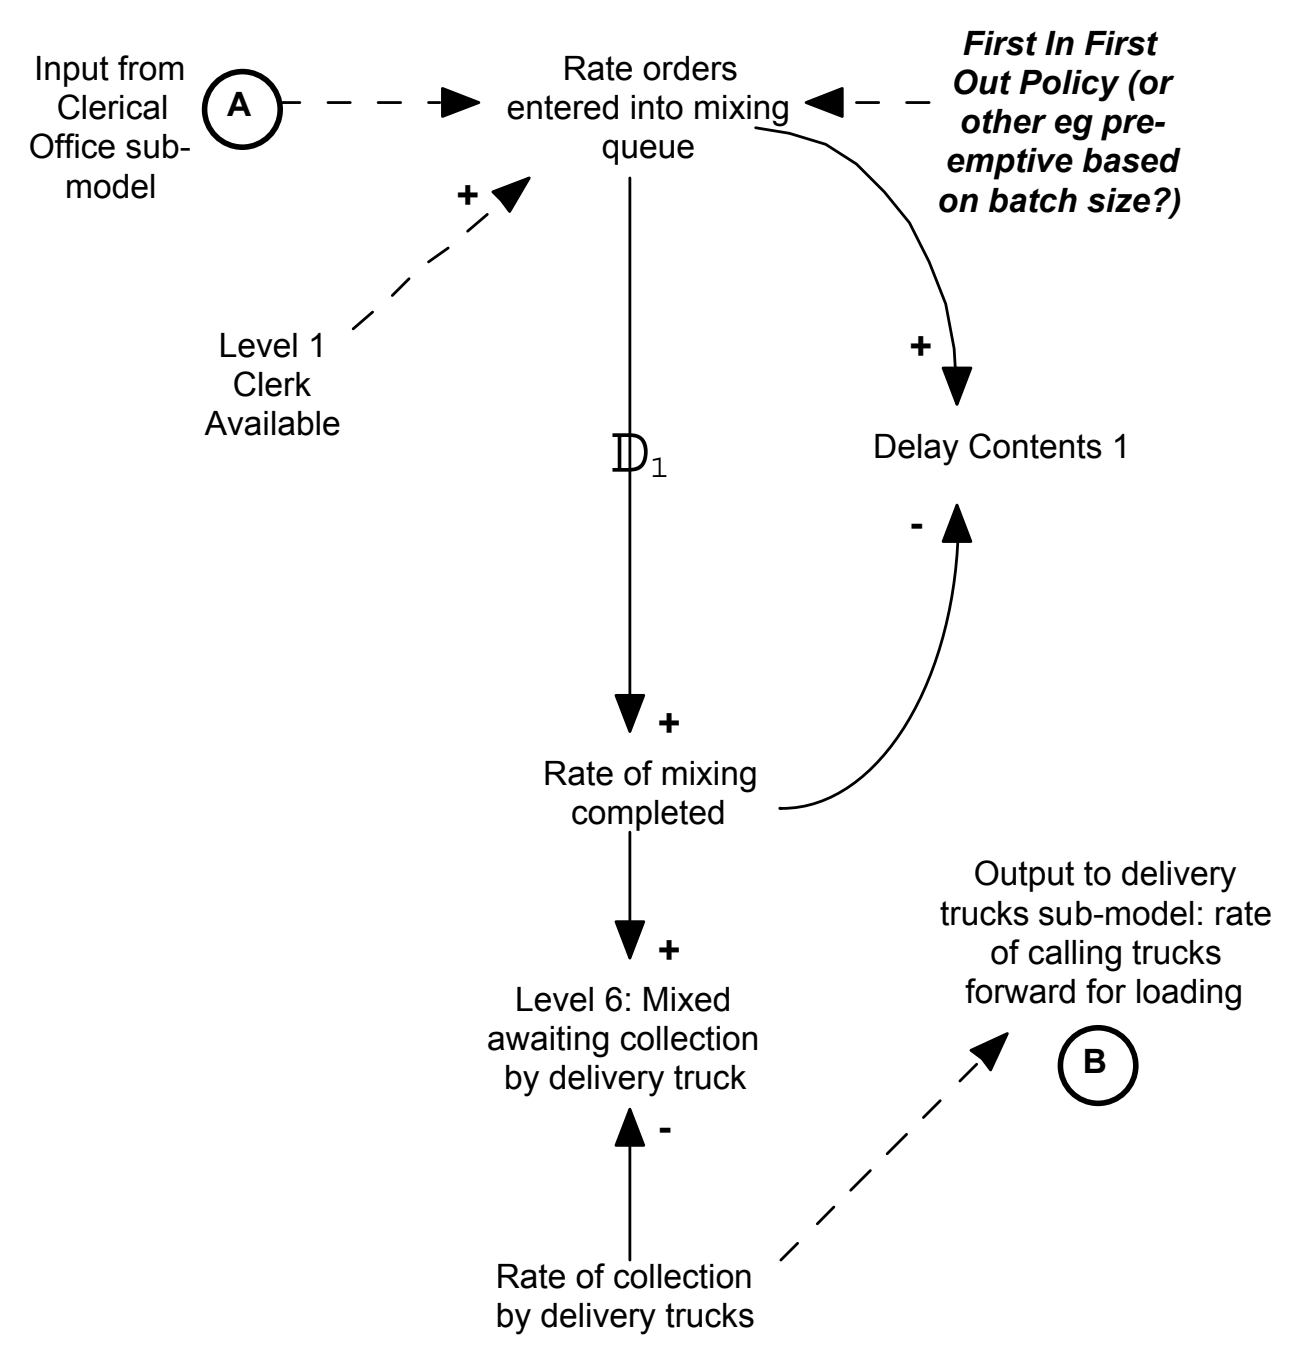
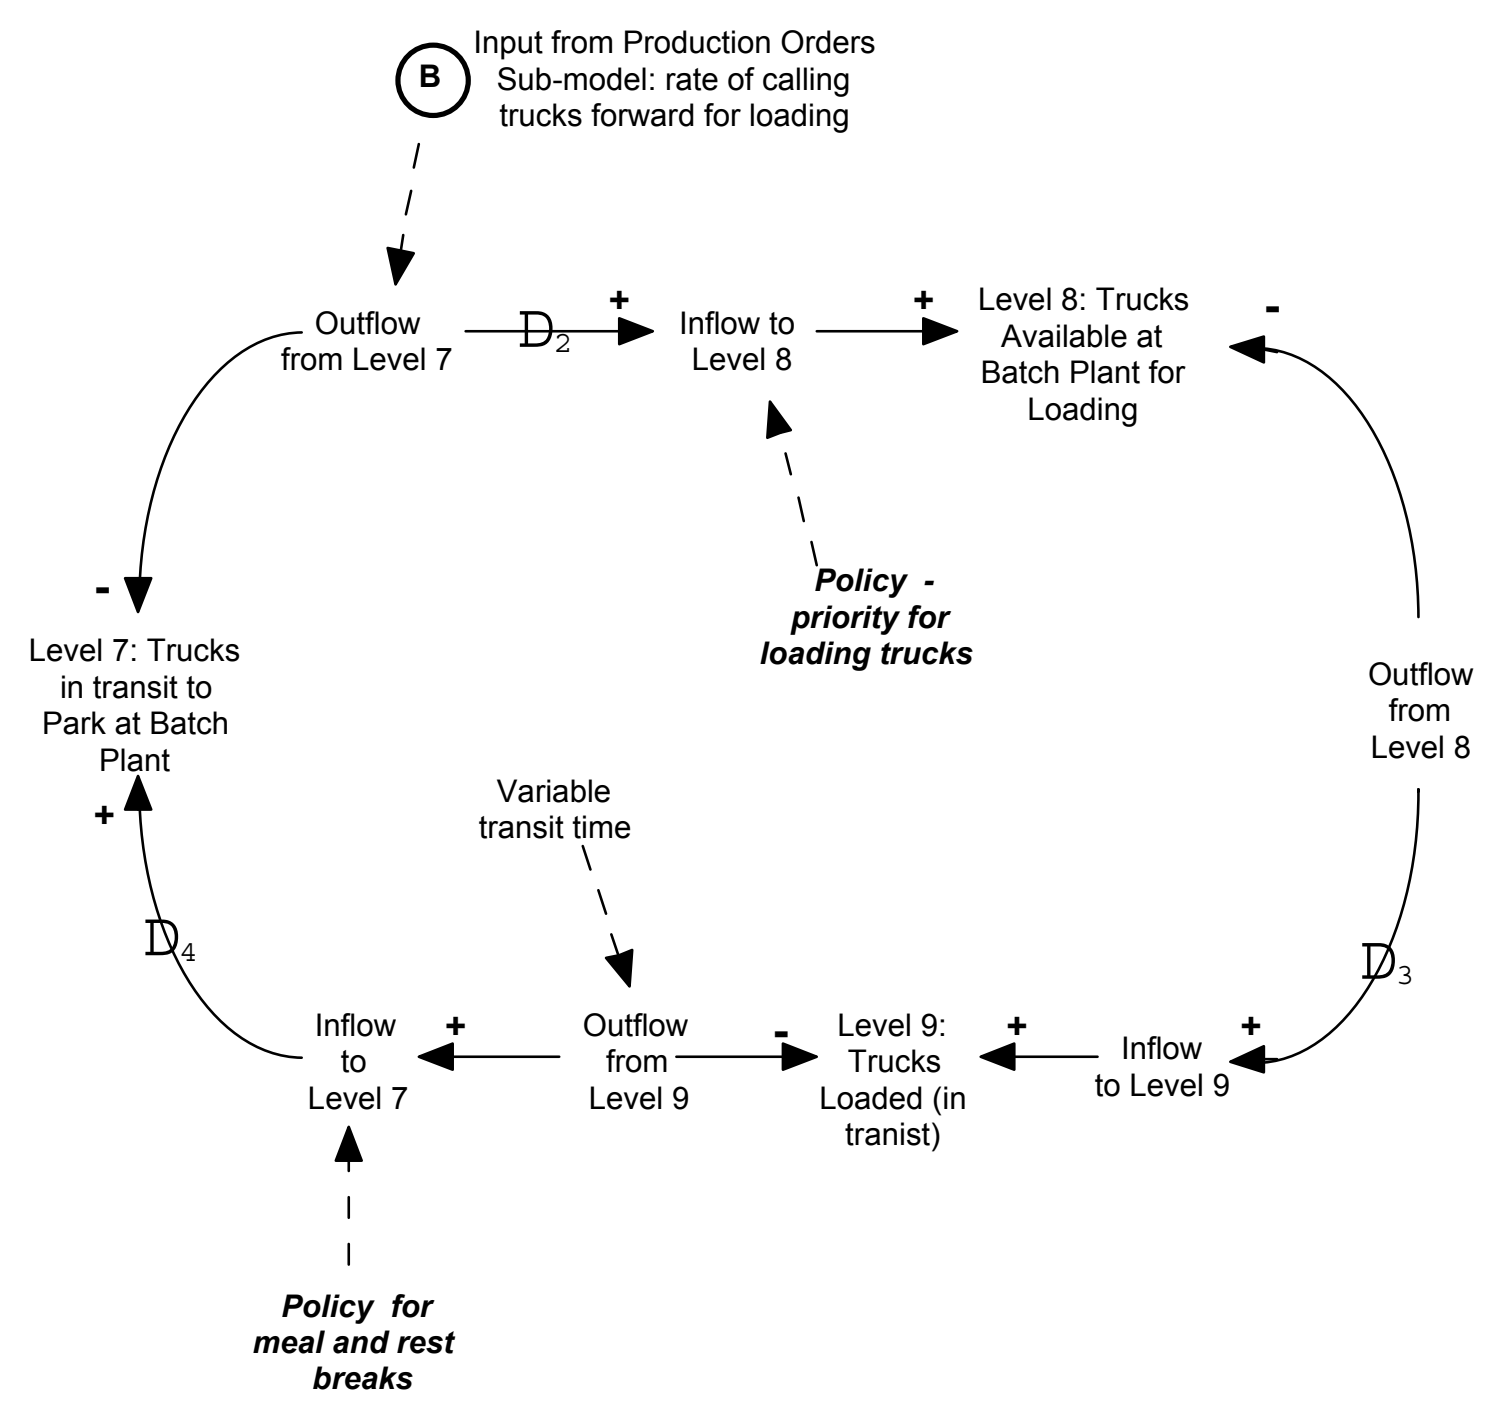
Causal loop diagrams (Section 6.9.2) and influence diagrams (Section 6.9.3) immediately provide certain insights about the structure of the problem, such as:
- what the external forces are, and where they act;
- what the current system management policies are, and where they impact;
- where the current system management policies impact; and
- where the feedback loops occur.
Influence diagrams, in particular, also provide the additional insights:
- which are stocks and which are flows, and the relationship between them;
- how the stocks and flows are connected;
- which are material flows and which are the information flows.
References
- Coyle, R.G., 1996, System Dynamics Modelling: A Practical Approach, Chapman and Hall, London.