2.2.3 Concept Mapping Methodology—By Example
To build a concept map of the findings of the Black Hawk helicopter crash Board of Inquiry, we start by considering paragraph 11 a. – k. of the ‘Causes’ quoted above. A relatively simple set of rules are needed to build and interpret a map, they are:
- Individual concepts are numbered for identification purposes only. Numbering is not intended to suggest importance or priority.
- Where a choice exists for placement of concepts on a map, more important ones should be placed towards the top. This is balanced against the need for overall compactness of the map, which may require concepts to be positioned adjacent. Maps are easier to understand when read from the bottom up.
- Causal relationships between numbered concepts are represented by arrows, where each arrow means ‘leads to…’.
- Connotative relationships, where causality may act in either direction at different times, are depicted by dashed lines (normally) without arrowheads. Further, causality may be ill defined and, hence, open to interpretation.
- Conflicting relationships, a particular case of the connotative relationship, exist when concepts at the opposite ends of a line have a state of stress between them. Solid double lines without arrowheads depict conflicting relationships.
- Delayed effects may be signified by a number of conventions. Here, an annotation ‘T’ will be used to signify delay, or temporal causality. In maps depicting higher levels of aggregation, temporal causality may be omitted without loss of meaning. We might consider every causal link to have some delay associated with it: few things in human systems, those involving man and his actions, occur without delay.
We can start anywhere, but for convenience we start with 11.a.:
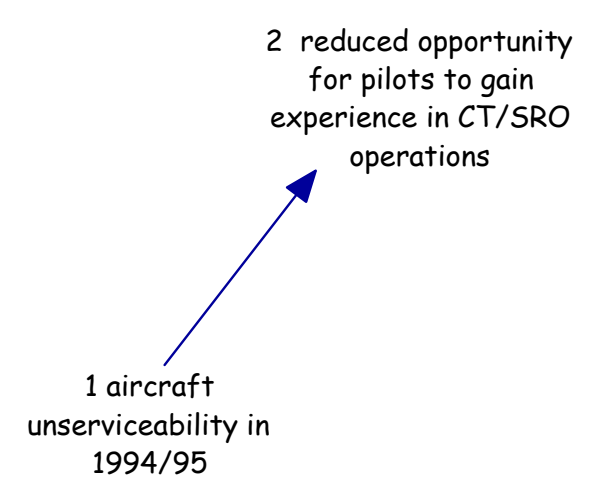
a. aircraft unserviceability in 1994/95 which reduced the opportunity for pilots to gain experience and proficiency in flying CT/SRO missions;
This contains two concepts, aircraft unserviceability in 1994/95 and reduced opportunity for pilots to gain experience and proficiency in flying CT/SRO missions. This is depicted using the ‘… leads to …’ logic, where an arrow (→) replaces the notion of ‘… leads to …’, as shown in Figure 2-1.
aircraft unserviceability in 1994/95 → reduced opportunity for pilots to gain experience and proficiency in flying CT/SRO missions
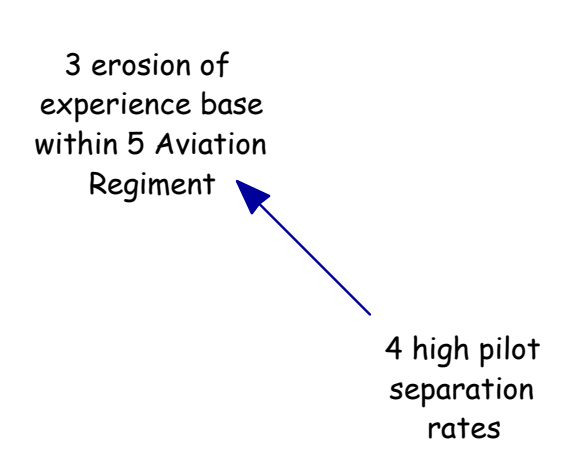
Similarly, 11.b. can be depicted as shown in Figure 2-2:
high pilot separation rates → erosion of experience base with 5 Avn Regt
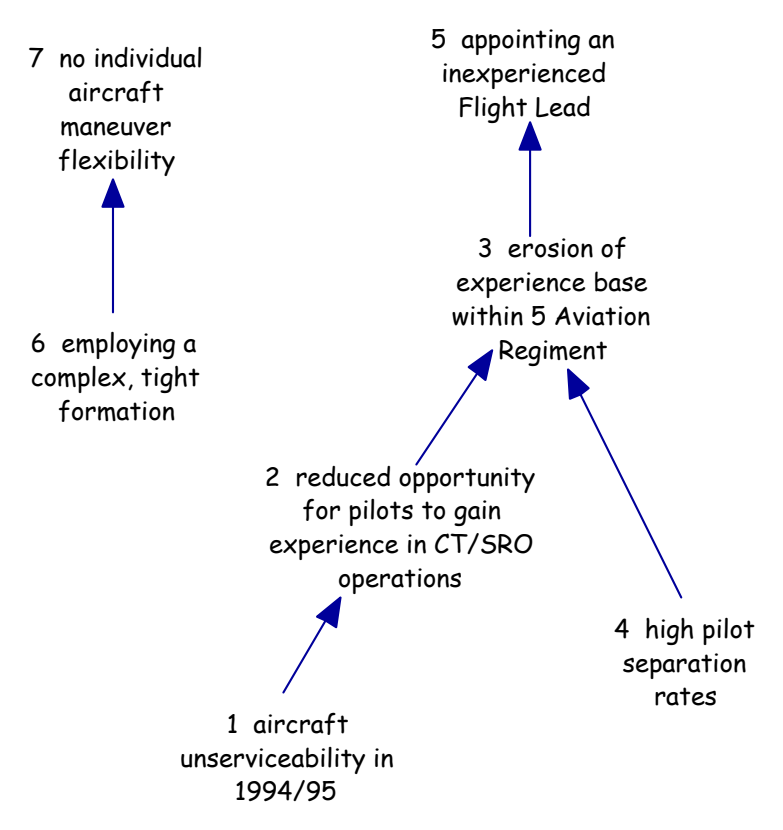
Those pairs of concepts linked by unambiguous causality can be progressively built into chains. These do not have to be complete at this stage. However, the critical requirement is to check that every link can withstand scrutiny of validation that one concept ‘leads to …’ the connected concept as shown by the direction of the arrow. As the map develops it might appear as depicted at Figure 2-3, noting that the diagram may have to be redrawn several times to tidy it.
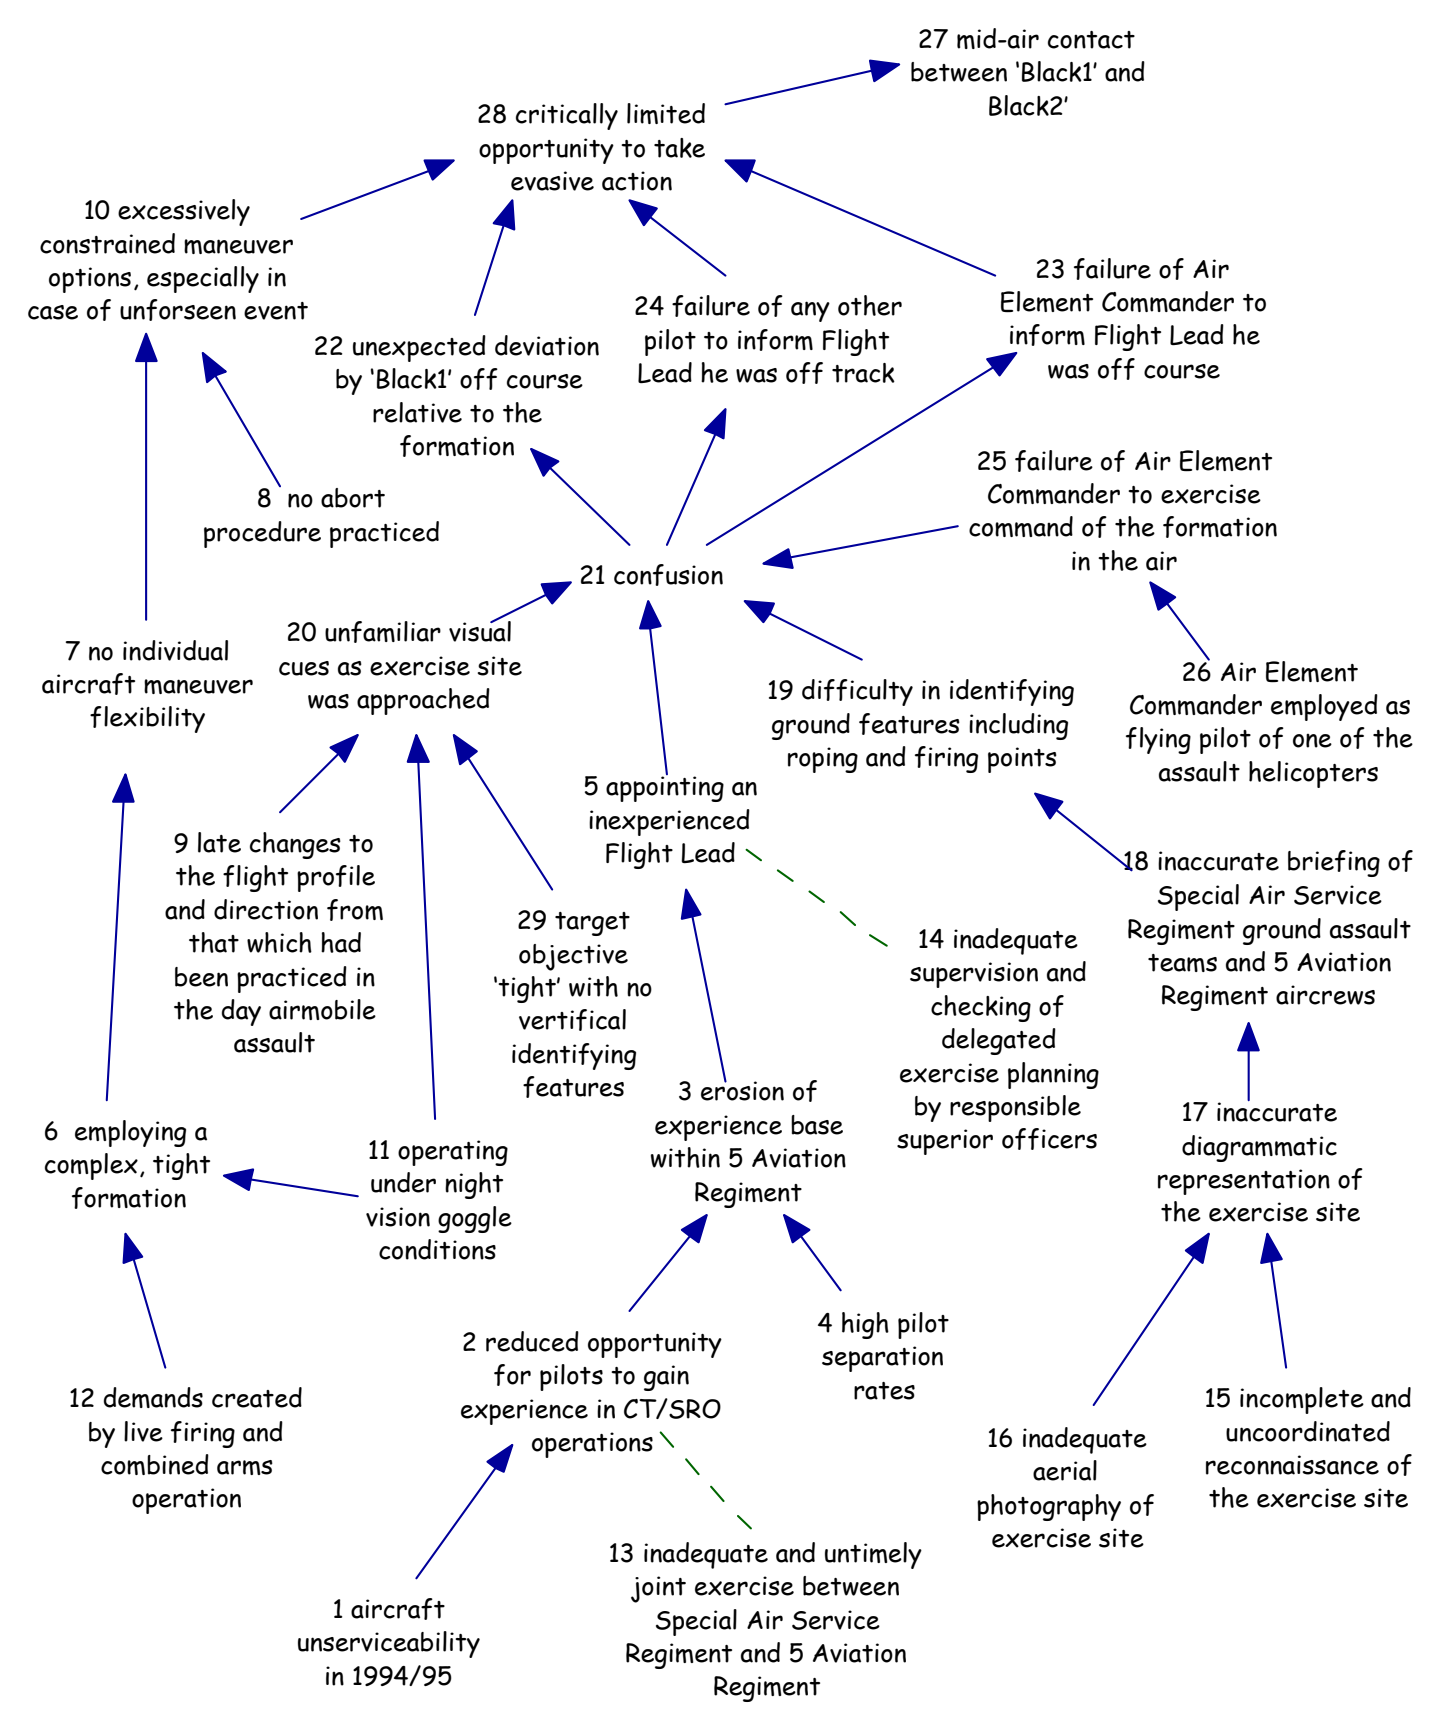
As map building proceeds, some concepts are found not to fit within the ‘leads to…’ logic without some form of ambiguity. In such cases, concepts are linked to the causal structure using a connotative link. An example is 11.c.: “c. inadequate supervision and untimely joint exercise planning between SASR and 5 Avn Regt”.
This has a logical link to Concept No 2 in Figure 2-2, reduced opportunity for pilots to gain experience in CT/SRO operations, but the nature and direction of causality is unclear. Also see Figure 2-4. Determining the exact nature of the link, and direction of causality, if any, is a little more difficult than with ordinary causal links. This demands thinking about possible circumstances where causality might manifest itself in different ways.
For example, we might ask questions like “… did reduced opportunity to gain experience in CT/SRO operations occur before, after, or concurrently with inadequate and untimely joint exercise between SASR and 5 Avn Regt?” To be able to answer this and similar questions requires closer analysis of the Board of Inquiry Report.
In the interim, the link is depicted legitimately as a connotative one, even though further analysis is needed. Connotative links almost always suggest a need for detailed investigation. This is explained further when we look at building quantitative models based on the logic suggested by, or depicted in, concept maps. Figure 2-4 depicts all aspects of causality gleaned from the Executive Summary of the Board of Inquiry Report. Scope, boundaries, and level of aggregation were pre-determined by the obligation the Board of Inquiry had to the Chief of Army according to their terms of reference. The structure of Figure 2-4 appears hierarchical, which might be interpreted as reflecting strong causality. Such an interpretation may be flawed. Further information is needed to assist in reading and understanding the map.