
Volume 10, Number 3, November 2007
Evaluation Of Data Collected By A Surveillance System For Gun Propelling Charges Utilizing Conscript Practice Troop Firings
- 1 Defence Forces Materiel Command Headquarters, P.O. Box 69, FI-33541 Tampere, Finland.
Abstract
The Finnish Defence Forces have implemented a surveillance system for gun propelling charges utilizing conscript practice troop firings. In this study the muzzle velocity data collected during troop firings of a 155-mm weapon system have been statistically evaluated. The elimination of the first round fired of each series of collected muzzle velocity data was found to reduce the variation in the data. For one charge zone, the study determined a need to verify the validity of standard muzzle velocity values in the firing tables. The muzzle velocity data collected in conscript troop firings were found to be suitable for the estimation of lot-to-lot and gun-to-gun variances if the data is not too unbalanced. The methodology for identifying and removing erroneously marked observations and outliers in the muzzle velocity data collected by conscripts has been developed and the evaluation of the results connected to each studied charge lot/zone has been conducted. The muzzle velocity data collected was found to be usable for numerous purposes, as long as the characteristics of the data are taken into consideration.
Introduction
The Finnish Defence Forces (FDF) have implemented a surveillance system for gun propelling charges utilizing conscript practice troop firings. The system is based on data collected on the muzzle velocity for each round fired. The system supplies the user and maintenance staff with information about deviations from the relevant firing table values for a specific charge/cartridge lot. The background and implementation of the system data have been presented in [1].
The muzzle-velocity data collected by this surveillance system for propelling charges can be applied in the recognition of possible changes of interior ballistics as a result of aging of the propelling charges [2–5]. The natural chemical and functional aging of the nitrocellulose propellants of gun propelling charges can be accelerated for example, if an imperceptible chemical compatibility problem and/or spontaneous opening of cartridge closing covers or their inner packages have occured. There may also be fractures in propellant grains or damages in charges due to handling and transportation. The fractures and/or brittleness in propellant grains can lead to propellant grain breakage during the internal ballistic cycle. Pressure fluctuations may at first lead to diminished porosity of the propellant bed and then enlargement of the burning surface. This phenomenon can lead to the maximum pressures defined during propelling charge development being exceeded and even cause a breech blow [6,7]. It would be beneficial to organize the monitoring of muzzle velocity values in troop firings during international operations conducted in hot climatic conditions, where aging of propelling charges is faster than in Finnish storage conditions.
There are also several other reasons to collect and monitor the muzzle velocity results in troop firings. In the case of defects discovered in the quality of the propelling charge determination or of the production of propelling charges [8] it is possible to assess the propelling charge lot specific deviations of specified muzzle velocities. Furthermore, because the muzzle velocity results collected in conscript troop firings are stored in a database, a prompt gun-specific picture of fired projectile/charge combinations and realized muzzle velocities is conveniently available in situations such as damage to the barrel or a firing accident.
The muzzle velocity data collected may be suitable for the analysis of round-to-round, gun-to-gun, lot-to-lot, and occasion-to-occasion variations in data. Round-to-round variation comes from, among other things, the variation of loading the projectile and from the difference in muzzle velocities of the first rounds and later rounds in a fired series. One source of round-to-round variation is the variation of projectile weight, present despite the projectile weight class-based projectile weight correction of muzzle velocity. Gun-to-gun variation comes mainly from the variation of the dimensions of each gun barrel and from barrel wear. One phenomenon peculiar to barrel wear is ballistic hump, a rise in muzzle velocity and chamber pressure taking place typically before firing of 200–300 rounds from a gun barrel [9]. The accurate evaluation of the magnitude of ballistic hump by carrying out test firings is an expensive study, for which several new barrels are needed. For the 155-mm gun dealt with in this paper, ballistic hump is a demonstrated phenomenon. Occasion-to-occasion variation is a result of many elements, like variation of ground or weather conditions and changes in the gun, projectile, or propelling charge during maintenance or storage.
The aim of this study was to use statistical methods to evaluate muzzle velocity data collected by a surveillance system for gun propelling charges utilizing conscript practice troop firings. Another aim was to develop a methodology to define muzzle velocity deviations from firing table values for gun propelling charge lots and zones.
Experimental
The sequence of the surveillance system for gun propelling charges utilizing conscript practise troop firings is shown in Scheme 1. The definition of muzzle velocity and the definitions of muzzle velocity value terminology and procedures to calculate the projectile muzzle velocities are given in STANAGs 4114 and 4500 [10,11].
The muzzle velocity values in field firings are measured by Weibel MVRS 700-SCD muzzle velocity Doppler radars mounted either permanently or temporarily on the guns. The radars are robust and it is convenient to type the data even in Finnish winter conditions. The radar dimensions are 195×187×67 mm and the weight is 5 kg. The radar has a built-in acoustic detector for starting the microwave transmission. Sample rate is 1.6–3,000 µs/sample and the velocity range 30–3,000 m/s. The parameter settings for gun models and charge/projectile combinations have been stored in the memory of the radars and are selected before a round is fired. The input data of gun barrel numbers, projectile and charge lots and the temperature of the charge have to be typed into the radar. After storage of information connected to about 700 rounds the radars have to be downloaded.
In order to check the quality, to store, to analyze and to present the muzzle velocity data collected in conscript troop firings a Muzzle Velocity Database has been programmed with Borland® Delphi. The Muzzle Velocity Database has a link to the national Fire Control Input (FCI) data with reference to specific gun/projectiles/fuze/charge combinations needed in order to calculate gun wear, projectile mass, and charge temperature corrections.
The Muzzle Velocity Database consists of a database management program and a data search and presentation program. The muzzle velocity and barrel wear data are fed into the database management program. The correctness of the data is checked, missing data can be added, the data from the FCI data are loaded and the data are also saved in the database management program. The data search and presentation program searches the charge/projectile/gun combination to be analyzed and shows the raw data in table format. The muzzle velocity corrections will be calculated using the FCI data. The search and presentation program presents the corrected muzzle velocity results graphically and in table format and the results can be exported from the database into other programs for further analysis.
The muzzle velocity and dispersion differences from the appropriate firing table values will be defined for each studied propelling charge lot. A procedure to give feedback about these results to the user has been introduced. The user can utilize information on these differences in future conscript troop firings.
| 1. Decision about ammunition combinations and gun propelling charge lots to be fired next year |
|---|
| 2. Muzzle velocity data collection in troop firings |
| 3. In connection with maintenance of guns Downloading of radars Collection of barrel wear data Mailing of data to DFMC-HQ |
| 4. Storage and processing of data in Muzzle Velocity Database |
| 5. Further data processing |
| 6. Feedback on the results to the user |
Results and discussion
Description of data on hand
The evaluated data comprised the muzzle velocities collected during conscript practice troop firings of a 155-mm gun and high-explosive projectiles. The data included the results for 29 bag type charge lots representing a full charge, zones 2 and 3 of a half serial charge and zones 2 to 4 of a full serial charge. There were four different projectile types in the data. The charges had been manufactured between 1989 and 2000. The data had been collected from 46 guns in five conscript firing camps taking place during 2004–2006. Each muzzle velocity (V0) observation V0,L,G,P,Z,F therefore represents a given gun propelling charge lot (L=1 to 29), gun number (G=1 to 46), projectile type (P=1 to 4), charge type/zone combinations (Z=1 to 6) and firing occasion (F=1 to 5). The data connected to 7,905 rounds were exported from the Muzzle Velocity Database and statistically analyzed using MATLAB® [12]. After removal of the results of series including not more than three rounds, the data set consisted of muzzle velocity results for 7,576 rounds and 754 series.
The muzzle velocities had been corrected for standard values of the temperature of the propelling charge, standard weight of the projectile and barrel wear. It was noticed during this study that barrel wear corrections had not always been sufficient because, for some of the guns, several hundred rounds had been fired after the latest barrel wear measurement. Under new instructions the barrel wear measurements will be carried out at intervals of not more than 200 rounds fired.
Analysis of sources of variation in data
Analysis of the muzzle velocity difference between the first rounds of series fired
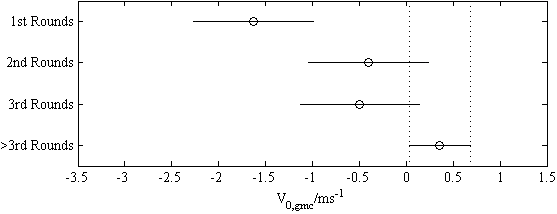
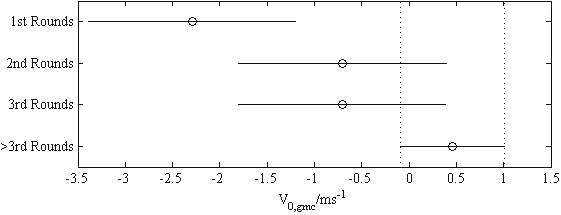
The assumption that the muzzle velocities of the first rounds of series fired differ from the rest of the rounds will be examined statistically in this section. Before the statistical analysis the data set was grouped to the first, the second, the third, and the subsequent rounds in the series fired. The results were scaled by subtraction of the firing table muzzle velocity value of the round combination in question from the muzzle velocity value of each round. After this the muzzle velocity data were mean centered group wise (V0,gmc). One-way analysis of variance (ANOVA) was applied to the total data set of 7,576 rounds and to a data set consisting of 3,888 charge zone 2 rounds. The resulting ANOVA tables are presented in Table 1 and 2 respectively. The 95 % confidence intervals of multicomparison test of group means are presented in Figures 1 and 2. It can be seen from Figures 1 and 2 that only the difference between the first round and the fourth and the subsequent rounds is statistically significant at the 0.05 level for both the total and the charge zone 2 data set. The difference was greater for charge zone 2, probably because lower charge zones are more often fired at the beginning of the firing with a cold barrel. Based on these results the variation in data can be made smaller by deleting the first round of each series fired before further analysis of data. The first round of each series fired has been deleted from the data sets to be discussed in the following sections.
| Source | SS | df | MS | F | Prob>F |
|---|---|---|---|---|---|
| Groups | 2,986.1 | 3 | 995.373 | 10.75 | 4.78533 ×10⁻⁷ |
| Error | 701,095.1 | 7572 | 92.59 | ||
| Total | 704,081.2 | 7575 |
| Source | SS | df | MS | F | Prob>F |
|---|---|---|---|---|---|
| Groups | 2,810.3 | 3 | 936.77 | 7.31 | 6.93134 ×10⁻⁵ |
| Error | 497,682.2 | 3884 | 128.137 | ||
| Total | 500,492.5 | 3887 |
Verification of the firing tables
The standard muzzle velocities for each projectile/charge combination of the 155-mm multi-charge weapon system studied are specified in firing tables. The suitability of muzzle velocity results collected in conscript practice troop firings to be used in the evaluation of the validity of the firing tables is presented in this section. The evaluation was based on the comparison of the muzzle velocity results of the rounds fired with a same charge lot and zone but with a different projectile type. The muzzle velocity results were scaled by subtraction of the firing table muzzle velocity value of the round combination in question from the muzzle velocity value of each round. If the firing table muzzle velocity value is correct, the means of scaled muzzle velocity results do not differ much from zero for the same charge lot with any charge /projectile combination.
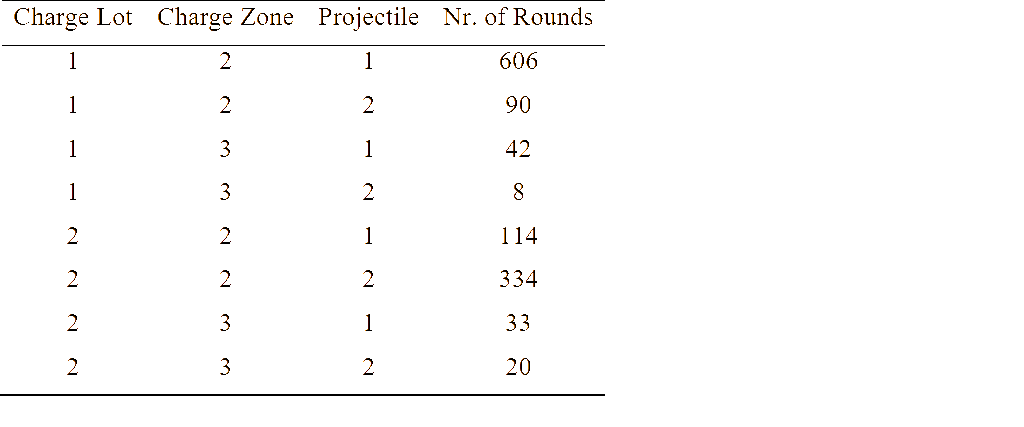
For projectile types with charge zone 2 a need to verify the standard muzzle velocity values in the firing tables was recognized. This was demonstrated with two charge lots which had been fired with both charge zones 2 and 3 and with two projectile types. The matrix of rounds fired is presented in Table 3. The above-mentioned scaled muzzle velocity mean differing equally from zero between projectile types was realized for two projectile types fired with charge zone 3 and for both charge lots studied. However the corresponding differences between projectile types for charge zone 2 were for lots 1 and 2 more than 15 ms-1. A check test firing has to be organized in order to verify the charge zone 2 firing tables. The test firing procedure (including firing schedule, guns, projectiles, charge zones and lots) to be used for determination of projectile/charge zone specific muzzle velocity values for firing tables has to be reviewed.
Estimation of lot-to-lot and gun-to-gun variance in data
The estimation of the muzzle velocity and especially chamber peak pressure variances coming from round-to-round, gun-to-gun and occasion-to-occasion is a part of the qualification of the charge/ammunition/gun combinations [6]. The suitability of muzzle velocity data collected in conscript firings to be used for focusing the estimates of lot-to-lot, gun-to-gun and occasion-to-occasion variances will be discussed in this section. For demonstration a charge zone 4 muzzle velocity data set consisting of 429 rounds from five charge lots fired from seven guns was statistically analyzed. The muzzle velocity values were mean centered before the analysis.
The unbalanced two-way ANOVA with 95 % confidence and random effects for comparing the muzzle velocity data means with respect of factors charge lot number and gun number was applied. MATLAB® function anovan was used to fit a model including the main effects and interaction of these two factors, which in the data set chosen represented a random selection from the larger set of factors. The null hypothesis was that in the model developed the coefficients for charge lot number, gun number, and their interaction was equal to zero.
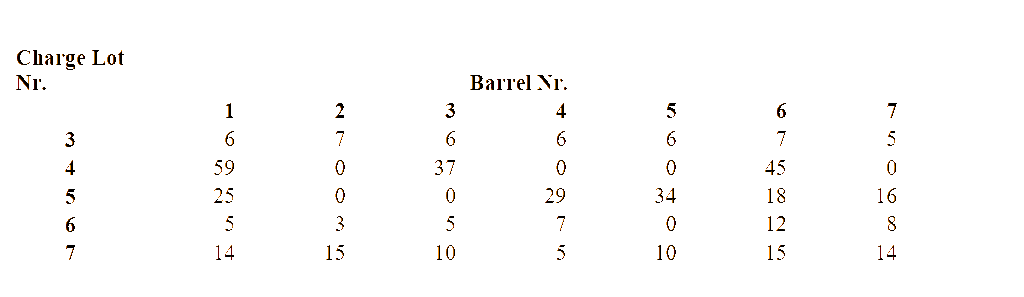
The muzzle velocity data collected from conscript firings are usually unbalanced—that is, the same number of rounds has not been fired for each combination of charge lot numbers and gun numbers. The charge zone 4 data set was unbalanced, as can be seen from the cross-tabulation presented in Table 4.
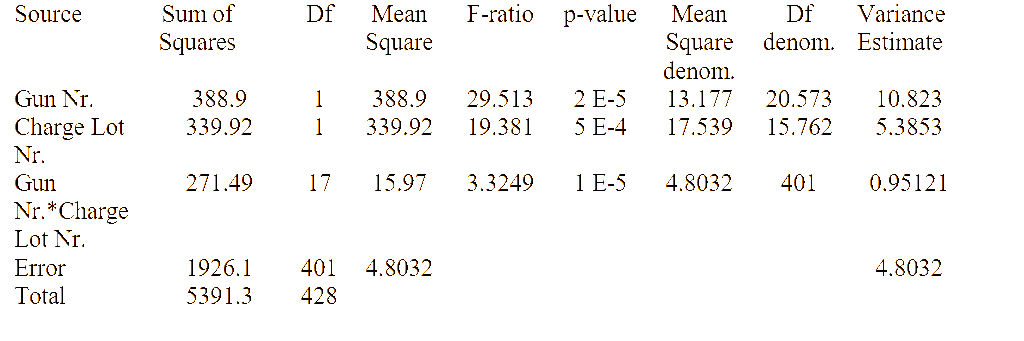
The resulting ANOVA table is presented in Table 5. Based on the very low probabilities (p-values) in the three first rows in Table 5 the null hypothesis could be rejected. As a conclusion, the muzzle velocity varies from lot-to-lot and from gun-to-gun and there is a two-way interaction between charge lots and guns. Despite the unbalanced data, the interaction between the factors gun number and lot number could in this case be calculated. The variance estimates for gun number, charge lot number and their interaction can be seen in the right hand column of Table 5. The estimates of standard deviation, i.e. the square roots of variance estimates, were 3.29 ms-1 for the gun number, 2.32 ms-1for the charge lot number, 0.98 ms-1 for their interaction and 2.19 ms-1 for the remaining variability not explained by any systematic source (error).
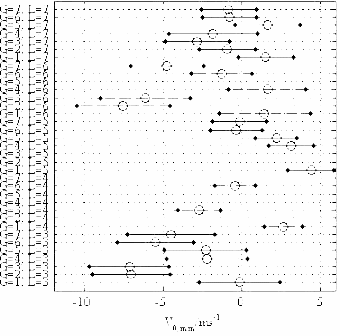
A multicomparison test was carried out for the data set of charge zone 4 using MATLAB® function multcompare with Bonferroni adjusted critical value, for the population of mean centered muzzle velocity marginal means (i.e. the effect of unbalanced design has been fixed) of gun numbers and charge lot numbers. The results are presented in Figure 3. It can be seen from the population marginal means computed for 95 % confidence intervals in Figure 3 that, because part of the intervals of the means do not overlap, there are statistically significant differences in the muzzle velocities between both the charge lots and the guns. For a gunner it would be a useful piece of information before the firing to know the expected muzzle velocity differences coming from the charge lot and gun in question.
The gun-to-gun variance estimates in the results presented in this section are likely to diminish slightly after the introduction of up-to-date barrel wear measurements. The reasons for the fairly high variation in charge lot-to-lot muzzle velocities have been discussed in [8].
A three-way ANOVA including occasion-to-occasion variance could not be carried out, because of the lack of rounds fired for each combination of charge lot numbers, gun numbers and firing occasions.
A method developed to analyze gun propelling charge lot and zone specific muzzle velocity data collected in conscript troop firings is described in this section. The aim was to remove possible erroneously marked observations (most often an incorrect projectile type number) and outliers from the muzzle velocity data, to analyze round-to-round and gun-to-gun variation in the data and finally to estimate the charge lot and zone specific deviation from the firing table muzzle velocity. In order to do this a MATLAB® function was programmed. This function presents the main results with four graphs and in a tabular form.
The demonstration of the methodology developed was carried out using charge zone 2 muzzle velocity data, which was purposefully chosen to include two projectile types having different firing table muzzle velocities. The data matrix included 540 muzzle velocity results for charge lot 8, representing projectile types 3 and 4 fired from twelve guns. The series with fewer than four rounds and the first round of each series had been removed from the data to be discussed in this section. The charge lot muzzle velocities are presented as mean centered. The results calculated by implemented analysis method are presented for 540 rounds in graphical form in Figure 4.
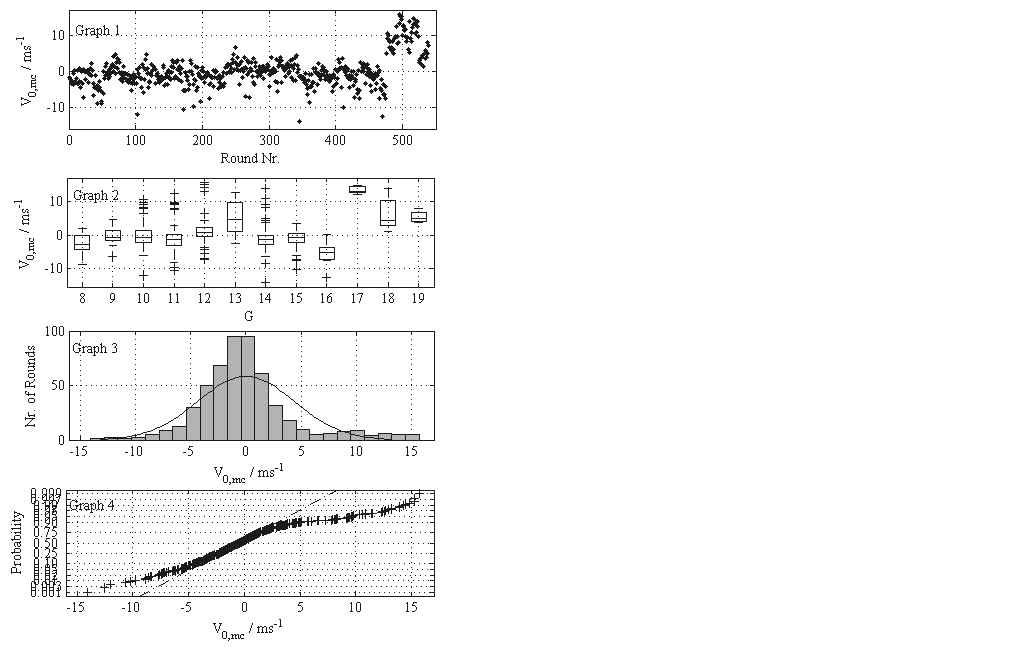
An overview of the charge lot specific variation in the results is given in Figure 4 Graph 1. The mean centered muzzle velocities (V0,mc) of a charge lot are presented chronologically round by round, series by series and gun by gun. It can be seen from Figure 4 Graph 1 that the most deviant observations are round numbers greater than 476 representing projectile type 4. The standard deviation of muzzle velocity 4.38 ms-1 is higher than the typical value expected for the studied round combination equipped with projectile 3
By studying Figure 4 Graph 2 the round-to-round and gun-to-gun variation in the data can be estimated based on a box plot of the mean centered muzzle velocities presented for each gun. Each box has horizontal lines at the median and at the lower quartile and upper quartile values. Whisker lines extend from the box out to the most extreme data value within 1.5 times interquartile range. The values outside the whiskers are indicated with the symbol + and in this context are classified as outliers. It was seen in Figure 4, Graph 2, that variation of muzzle velocity on guns 13 and 18 was higher than typically seen for round combination equipped with projectile 3. The medians of data for guns 8 and 16 are lower and for guns 13 and 17–19 higher than the rest of the guns. There are also several outliers in the observations on guns 10–12 and 14–15.
The distribution of mean centered muzzle velocities and a superimposed normal density are presented in Figure 4, Graph 3. It can be seen 1n Figure 4, Graph 3, that the data are not normally distributed, but are biased, especially in the higher values.
Figure 4, Graph 4, presents a normal probability plot for graphical normality testing. The mean centered muzzle velocities (dV0,mc) vs. probability (symbols +) and a line joining the first and third quartiles of the data based on a robust linear fit of the sample order statistics are displayed. The line is extrapolated out to the ends of the data. Because the plot in Figure 4 Graph 4 does not appear linear, it is seen here, too, that the data does not come from a normal distribution.
The main findings in this artificial example were that there was higher than expected variation in muzzle velocity than is typical for the round combination equipped with projectile 3 and there was grouping in the data. The data representative of higher muzzle velocity level, i.e. round numbers greater than 476 (representing projectile type 4), were removed from the data. The remaining outliers (19 rounds) marked in Figure 4 Graph 2 were also removed. In the corresponding real case the muzzle velocity levels of two data groups should be identified to present known round combinations. It has also to be checked that identified projectile types were used during the firing occasions where the studied charge lot was fired.
Because the main purpose of this evaluation is to determine the muzzle velocity mean of studied charge lot, and the sample mean is known to be sensitive for outliers, the recognized outliers are removed from the data. On the other hand, if the results removed were not real outliers a too low standard deviation of muzzle velocity can be determined for the charge lot studied.
It can be seen from the resulted data in Figure 5, Graphs 1 and 2, that round-to-round and gun-to-gun variations in the data are lower if compared to Figure 4. Based on Figure 5, Graphs 3 and 4, the data now come mainly from a normal distribution.
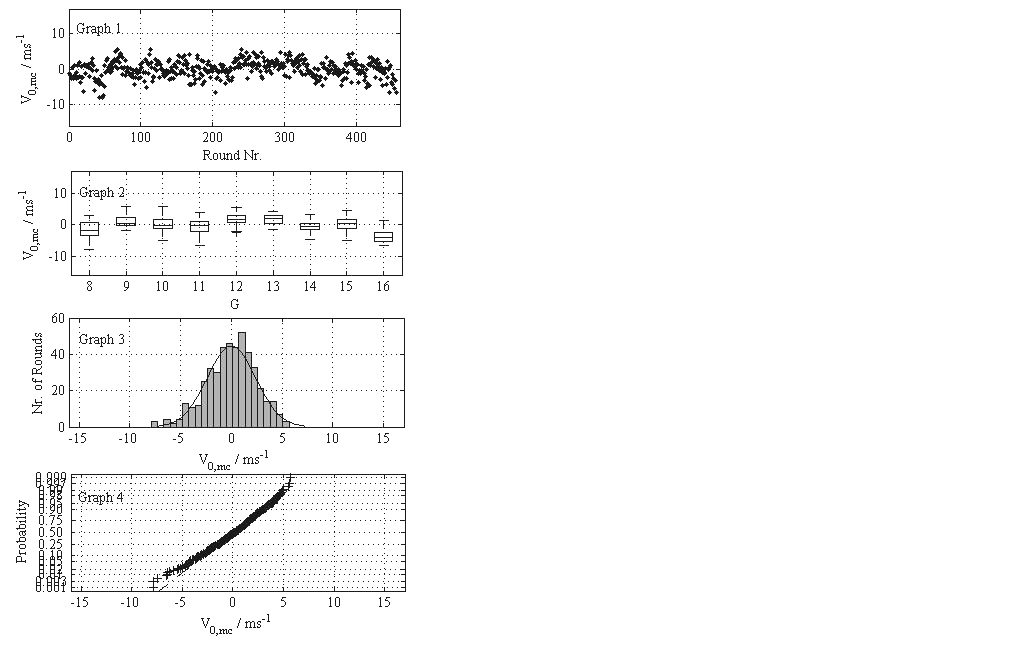
The MATLAB® function developed presents the statistics for the charge lot/zone combination studied as the muzzle velocity mean, the standard deviation of muzzle velocity and the 95% confidence intervals. In this demonstration, the impact of data removal on the muzzle velocity mean was –0.97 ms-1. The standard deviation of muzzle velocity after data removal was 2.40 ms-1, which value is typical for gun, projectile and charge zone combination studied.
The statistics of the results for each gun are also presented tabulated from as the number of rounds fired, the percentage of rounds fired, the muzzle velocity mean and a standard error of the muzzle velocity. As an option the deviation of muzzle velocity means for guns compared to selected (standard) gun in the results can be calculated.
Based on the statistical analysis of the corrected muzzle velocities from which outliers have been removed, the muzzle velocity mean, standard deviation and their 95% confidence intervals can be presented for each studied charge lot, charge zone (and projectile type) studied. If greater deviation from the specific firing table muzzle velocity than the highest allowed is discovered, the user will be provided with charge lot and zone specific expected muzzle velocity deviations,
The evaluation methodology described above is going to be instructed in the FDF. The typical expected muzzle velocity variations for the charge lots and guns have been provided in order to facilitate the identification abnormalities in the results of the charge lot studied.
Conclusions
This study has evaluated the muzzle velocity data collected using a surveillance system for gun propelling charges utilizing conscript practice troop firings. As a consequence of the statistically significant difference in muzzle velocity of the first round fired in a series, it is possible to reduce the variation in the data by deleting the first round fired in each series. The probable deviation in firing table muzzle velocity recognized for charge zone 2 round combinations gave reason to review the firing table definition procedures, in particular the design of the test firing plan and the analysis methods of results. The muzzle velocity data collected in conscript firings were found to be suitable for the analysis of lot-to-lot and gun-to-gun estimates of variance if the data are not too unbalanced.
The methodology for identifying outliers and erroneously marked observations in muzzle velocity data collected in conscript troop firings was developed and the evaluation of the muzzle velocity results connected to each gun propelling charge lot studied carried out. Thus possible charge lot specific deviations from the firing table muzzle velocity values can be defined and given to the user.
Because the data set dealt with in this study also included muzzle velocity results for several barrels fired less than 300 rounds, some effort was taken to solve the possibility of presenting a ballistic hump curve based on the data set at hand. To achieve a ballistic hump curve the effect of different muzzle velocity areas in the data because different charge zones and projectile types was compensated by scaling. After this the data of each series fired were interlocked chronologically. A sufficiently explicit and continuous ballistic hump curves could not be distinguished from the muzzle velocity data so far at hand, mainly because there were often only a few rounds in series fired and because round-to-round variation.
Altogether, it was found that the muzzle velocity data collected by the surveillance system for propellant charges utilizing conscript practice field artillery troop firings can be used for numerous purposes, but the characteristics of the data have to be taken into consideration.
References
[1] H.M. Nyberg and T.P.O. Muikku, “Conscript Practice Troop Firings Utilizing Surveillance System for Propellant Charges”, 37th International Conference of ICT, Karlsruhe, 27–30 June 2006, Stadthalle Karlsruhe, Germany 2006.
[2] B. Vogelsanger, B. Ossola, U. Schädeli, D., Antenen and K. Ryf, “Ballistic Shelf Life for Medium and Small Calibre Ammunition—Influence of Deterrent Diffusion and Nitrocellulose Degradation”, 19th International Symposium on Ballistics IBS 2001, Interlaken, Switzerland 2001.
[3] F. Volk, M.A. Bohn and G. Wunsch, “Determination of chemical and mechanical properties of double base propellants during aging”, Propellants, Explosives, Pyrotechnic, Vol. 12, No. 3, June 1987, pp. 81–87.
[4] M..A. Bohn, “Methods and Kinetic Models for the Life Assessment of Solid Propellants”, AGARD Conference 586: Service Life of Solid Propellant Systems, Athens, Greece, 1997.
[5] C.A. van Driel and W.P.C de Klerk, “Stability of Propellants, Thermal or Functional”, 31st International Annual Conference of ICT, Frauenhofer Institut, Karlsruhe, Germany, 2000.
[6] “Definition of Pressure Terms and Their Interrelationship for Use in the Design and Proof of Cannon and Ammunition”, STANAG 4110, 1991, 2nd Ed., NATO Military Agency for Standardization.
[7] A.W. Horst, “Pressure Wave Phenomena in Large-caliber Guns”, in: L. Stiefel (Ed.), Gun Propulsion Technology, Vol. 109 Progress in Astronautics and Aeronautics, American Institute of Aeronautics and Astronautics, Inc., Washington, DC, U.S.A., 1988, p. 75.
[8] H. Nyberg, T. Hurme and O.-P. Penttilä, “Multivariate Analysis Applied to Test Procedure for Determining Gun Propelling Charge Weight Part I. Preliminary Analysis of the Data Set”. Chemometrics and Intelligent Laboratory Systems, Vol. 87, No. 1, May 2007, pp. 131–138.
[9] M..A. Henderson, in L.W. Longdon, (Ed.), Textbook of Ballistics and Gunnery, Volume II, Her Majesty’s Stationery Office, London, 1984, p. 452.
[10] “Measurement of Projectile Velocities”, STANAG 4114, 1997, 3rd Ed., NATO Military Agency for Standardization.
[11] “Procedures to Determine Field Artillery Muzzle Velocity Management, Interchangeability and Prediction”, 1996, STANAG 4500, Ed. 1, NATO Military Agency for Standardization.
[12] Statistics Toolbox for Use with MATLAB®, User’s Guide, Version 4, 6th Ed., The MathWorks, Inc., MA, USA, 2002.