
Volume 5, Number 3, November 2002
Electro-Optical Systems Analysis: Part 2
- 1 Head Electro-optics Group, School of Engineering and Applied Science, Cranfield University, Royal Military College of Science, Shrivenham, Swindon, WILTS SN6 8LA, United Kingdom.
Abstract
This paper is the second in a series of short tutorial articles loosely based on tutorial sessions given at the Royal Military College of Science to Masters of Science (MSc) students who are studying on defence technology courses. The purpose of the tutorials is to enable students to do first-pass (rough) calculations on various aspects of electro-optical systems. This type of analysis is typical of that which they may carry out in their potential future role as defence analysts. This second paper looks at calculating the power received at a detector from a target that may be considered to be either a point source or an extended source. Such calculations enable the estimation of, for example, the lock-on range of an infrared (IR) homing missile.
Introduction
In any theatre of conflict or potential conflict the shear number of infrared homing missiles available is quite bewildering. These missiles range in complexity and cost from the simple hot-spot trackers such as SA7 to the complex fully imaging systems such as IR Maverick or the Advanced Short Range Air to Air Missile (ASRAAM). The success of these missiles is also very impressive with IR missile systems accounting for approximately 55% of worldwide combat aircraft losses in the past 20 years. It is necessary in some instances, for example in defence analysis, to make rough calculations on the feasibility of the operation of such systems in various conditions with little or practically no data available on the systems to be used. In some circumstances the data may simply be a report that an IR missile was used against a particular target and a poor quality photograph of the alleged missile. Under these circumstances it is therefore appropriate to undertake a process of very low-fidelity modelling to enable a decision of the probability of successful utilisation. This paper looks at such a low-fidelity model for IR homing missile systems.
Detector projected area
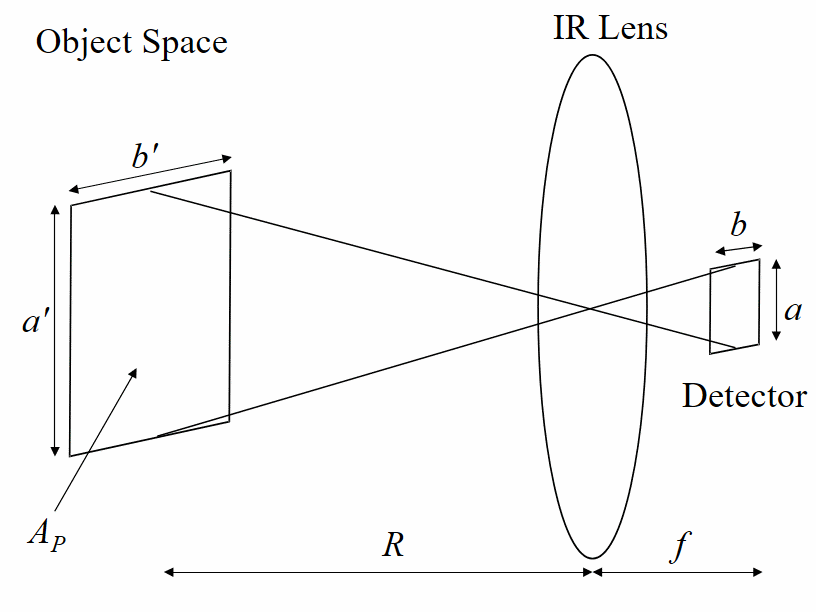
To calculate the lock-on range of an IR missile it is first necessary to ascertain if the target is a point source or an extended source. This is achieved by determining the projected area of the detector AP in object space as depicted in Figure 1 where a and b are the dimensions of a single detector element in the IR missile seeker, f is the focal length of the seeker optics and R is the range to the target, and hence the projected area is derived as follows:
(1)
The target is then considered to be a point source if the area of the target AT is smaller than the projected area AP (this is also known as a sub-pixel target) and conversely the target is considered to be an extended source if AT is bigger than AP.
Point source target
When the target is present in the projected area the power that falls on the detector will consist of two components, one from the target itself and the other from the background, which is also present in the projected area. When the target is not present in the projected area the power on the detector will
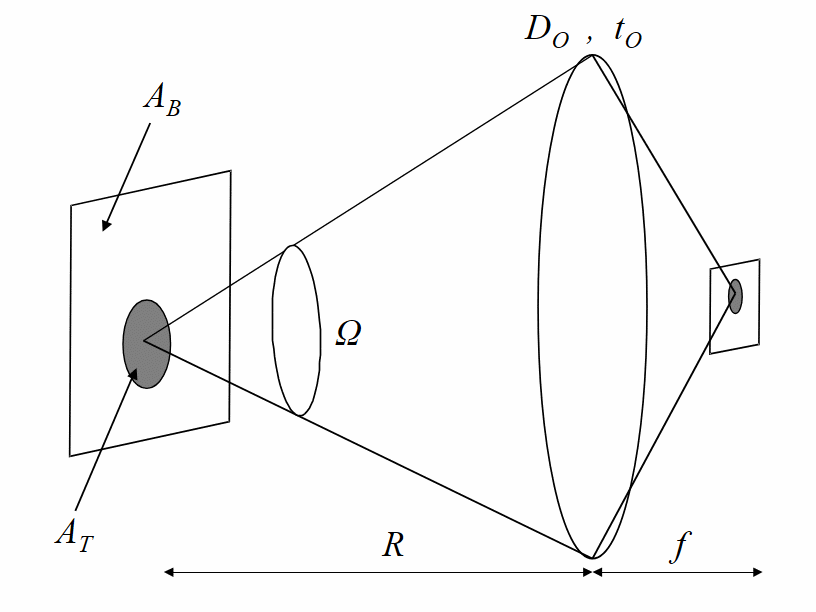
obviously be from the background component alone. With reference to Figure 2, the power at the detector when the target is in the projected area PT can be given as:
(2)
where NT and NB are the target and background radiance (W/m2/steradian) respectively, AT is the area of the target, AB is the area of the background in the projected area, tO is the transmission of the seeker lens, and Ω is the solid angle subtended by the lens of the seeker which may be given by:
(3)
and where ta is the atmospheric attenuation and may be approximated by:
(4)
where σ is the atmospheric attenuation coefficient and may be characterised as σ = 0.2 km-1 on a good day and σ = 0.7 km-1 on a bad day, and obviously:
(5)
When the target is not in the projected area then the power on the detector PB is from the background alone and may be given by:
(6)
In order to evaluate the IR missile lock-on range it is the difference between these two powers PT and PB that is important and this ΔP must be detectable, that is:
(7)
where S/N is the signal-to-noise ratio (the lower this value the higher the likelihood of false alarms) and NEP is the noise equivalent power of the detector used (values for the NEP may be found in any detector manufacturer’s literature). Therefore substituting in for PT and PB yields:
(8)
This should not be a surprising result as it shows the inverse square relationship with range if we neglect atmospheric factors. Re-arranging for R now yields the lock-on range:
(9)
Extended source target
In the extended source case, as depicted in Figure 3, when the target is bigger than the projected area, then the power at the detector is simply from that portion of the target that is encompassed by the projected area.
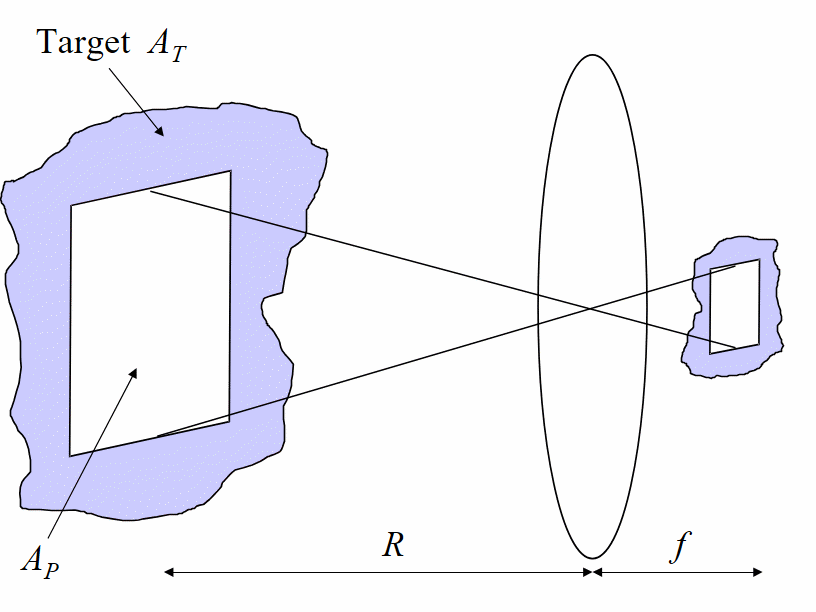
Thus:
(10)
This must be compared to the power from the background (without the target present) as given in Equation (6) and hence ΔP is evaluated as:
(11)
and noting that the f-number of an optical system may be given by:
(12)
This yields:
(13)
This may, at first, appear to be something of a surprising result, as the expression is independent of range (again if we neglect the atmospheric factors). However it is simply the inverse square dependence of the solid angle cancelling with the square dependence of the projected area.
Evaluating radiance
To obtain values for the target and background radiance, we first assume that both the target and background are Lambertian radiators and can therefore be evaluated from a simple modification to Planck’s Radiation Law:
(14)
where the first radiation constant c1 = 3.74×10⁸ W/m2/µm4, the second radiation constant c2 = 1.44×10⁴ µmK, λ is wavelength, T is the temperature of the object (target or background) in Kelvin, and ελ is the spectral emissivity of the object.
Spectral emissivity
The spectral emissivity is a difficult parameter to deal with in low fidelity modelling, hence the target and background are usually assumed to be graybodies (that is, independent of wavelength). This is a good approximation for solids and typical targets and backgrounds would have a value of ε≈0.9, and target solids (such as vehicle skins) may typically be a few Kelvin to a few 10’s of Kelvin hotter than the background. Gases are more difficult to deal with but a reasonable approximation for exhaust plumes can be made by stating that the Doppler broadened emissions of the dominant carbon dioxide and water vapour species have ε ≈ 0.5 over the wavelength range of the broadened line (that is, λ1 ≈ 4.1 µm and λ2 ≈ 4.5 µm for CO2), and typical exhaust plumes can have temperatures ranging from 400K to 1000+K.
Summary
The above low fidelity model simply yields a few straightforward equations, which can be used to evaluate the lock-on range of an IR missile system. More often than not Equation (9) is the best starting point, as the target would usually be a point source at this range. The fidelity of the model can be increased by considering the target to be made up of more than one area and simply summing the contributions from each of these areas. This can also be applied to the background if other than a non-uniform background is required. Values for (or good estimates of) the variables in the equations can easily be found from manufacturers data sheets, photographs of equipment, or even web sites. Temperature profiles of various military targets (including aircraft) can even be found on the web, as well as technical descriptions of various IR missile systems. It is unlikely that the exact performance of the real equipment will be determined, but more often than not the results obtained are surprisingly close and demonstrate the power of low fidelity modelling when coupled to sound ‘engineering estimation’.
Bibliography
[1] M. Richardson et al, Surveillance and Target Acquisition Systems, Brassey’s Land Warfare Series, 1997.
[2] J. Accetta and D. Shumaker (eds), The Infrared and Electro-Optical Systems Handbook, SPIE Press, 1993.
Mark A. Richardson is head of the Electro-Optics group at the Royal Military College of Science, Shrivenham, England.