
Volume 3, Number 3, November 2000
Modelling The Signature Vulnerability Of A Main Battle Tank
Abstract
If commanders are to have the freedom to move around the battlespace to locations where they can best influence the battle at the critical time and place they must be sure in the knowledge that they can do so undetected. Infrared (IR) sensors, with ever increasing sensitivity, are now well established in the land environment. IR signature management is therefore becoming evermore pertinent in that environment. Innovative design and the use of modern materials can reduce the external temperature range of a vehicle but can be expensive. It is therefore paramount that vulnerable areas on a vehicle are identified so that appropriate thermal camouflage can be applied in the most cost-effective manner. High-fidelity thermal signature models are available but are time consuming to run and heavy on computer processing power. A simple, easy to use thermal signature model would provide a ready alternative to the more exacting complex models. Whilst not attempting to replace the high-fidelity models for the detailed analysis of thermal signatures, a simple model would have utility as a first filter of trials data and the initial testing of signature reduction concepts. A single temperature difference model of the Main Battle Tank for input into a Minimum Resolvable Temperature Difference (MRTD) model is presented. The model is used to predict detection range reduction and thereby identify the areas on a MBT that require thermal signature reduction.
Introduction
In modern warfare commanders must have the freedom to move around the battlespace to locations where they can best influence the battle at the critical time and place [1]. An essential component to achieving this freedom to manoeuvre is the capability to detect; discriminate; identify (through active or passive, non-cooperative methods); and prioritise both ground and aerial platforms at ranges in excess of the effective ranges of the threat’s detection and weapon systems, and inside the threats detection and response time. The capability must be effective day or night in adverse weather, in cluttered background environments, and in the presence of threat countermeasures. The achievement of this goal is initiated with the exploitation of the electromagnetic spectrum to provide surveillance information of the battlespace.
Infrared (IR) sensors, with ever increasing sensitivity, are now well established in the land environment. IR signature management in that environment is therefore becoming evermore important. The IR radiation is generated by a combination of solar radiation, reflection and heating and by heat generation by the object. This radiation can be observed as an apparent temperature difference between the object and its surroundings. Detection can result from either a positive contrast when the object radiates more than the background or a negative contrast when the background radiation is higher. The detection of objects therefore depends on a number of factors, such as operating environment and activity of the object. In the case of a Main Battle Tank (MBT) this creates a wide range of thermal signatures varying from the negative contrast of a wind-chilled stationary MBT to the positive contrast of a MBT on the move.
Signature management in the IR region is complicated by the environmental conditions, such as solar heating, wind chill, rain or snow, which can cause unpredictable thermal contrast. The thermal contrast is a function of the external temperature and emissivity of the object. Innovative design and the use of modern materials can reduce the external temperature range of an object but can be expensive. It is therefore paramount that vulnerable areas are identified so that appropriate thermal camouflage can be applied. This paper presents a method of generating a single temperature difference model for input into a Minimum Resolvable Temperature Difference (MRTD) model. The model was used in a case study based on a contemporary MBT to predict detection range reduction and thereby identify the areas on the MBT that require thermal signature reduction.
Thermal contrast
In a normally lighted visual scene there is no shortage of contrast variations between the objects in the scene. The contrast arises from the surface properties of the materials of which the objects are made. In visual images there is colour contrast as well as brightness contrast. Colour contrast results from the variation of energy between spectral wavelength bands, whereas brightness contrast results from the energy variation between the objects and the surrounding environment. This contrast mechanism applies equally to infrared or thermal scenes as it does to visual scenes. Planck's radiation law states that every object at a temperature above absolute zero emits electromagnetic radiation, and the higher the temperature the higher is the emitted intensity. This equally applies to the background of a scene. Therefore for an object to be detectable there must be a difference in the radiated energy originating from the object and the radiated energy originating from the background. This thermal contrast can equally be positive, object energy greater than background energy, or negative and can be expressed as:
(1)
where MObject = Power per unit area from the object
MBackground = Power per unit area from the background.
This thermal contrast expression accounts for the brightness contrast in a scene. The colour or spectral variation is defined by Planck’s law, which represents the power per unit area per unit wavelength as:
(2)
where Mλ = Spectral Radiant Emittance (Wm-2µm-1)
c1 = First radiation constant = 3.74 x 10⁸ Wm-2µm4
c2 = Second radiation constant = 1.44 x 10⁴ µmK
λ = Wavelength of the radiation
T = Temperature of the object (K)
An expression for the thermal contrast at a specific wavelength can therefore be derived by substitution of Equation (2) in to Equation (1). Similarly, the thermal contrast over a band of wavelengths can be derived by integrating Equation (2) with respect to wavelength prior to substitution into Equation (1).
Emissivity
Planck's law is strictly valid only for ideal blackbodies, which by definition have 100 % absorption and maximum emitting intensity (exitance). Real objects can be handled by introducing emissivity (ε), a factor less than unity, equal to the ratio of the emitting intensity of the object and that of a corresponding blackbody having the same temperature as the object. Objects with a less than unity and almost constant emissivity are named Graybodies. Figure 1 illustrates the spectral emittance and emissivity relationship between a blackbody, a Graybody and a selective radiator.
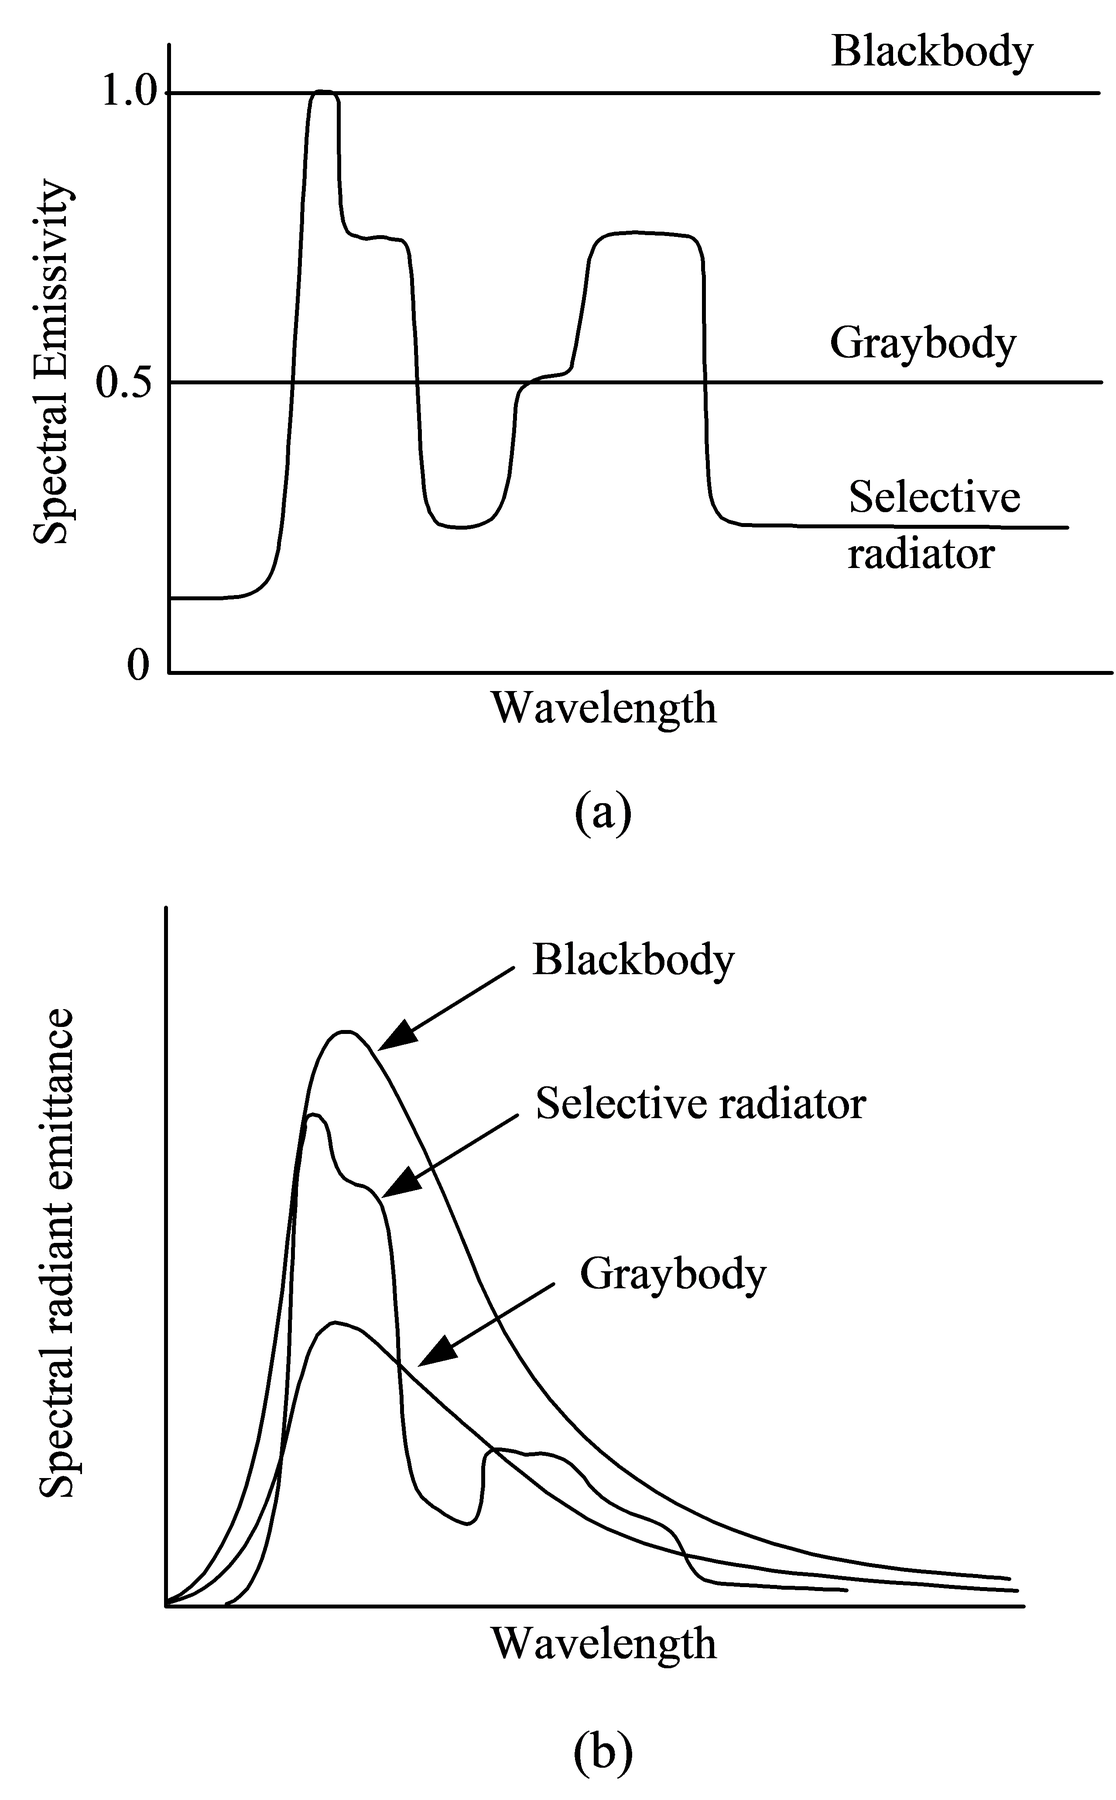
Typically the emissivity of solid materials is largely independent of wavelength. It is therefore possible to describe the thermal contrast of an object or target viewed over a spectral band from wavelength λ1 to wavelength λ2 as:
—(3)
Minimum Resolvable Temperature Difference (MRTD) Model
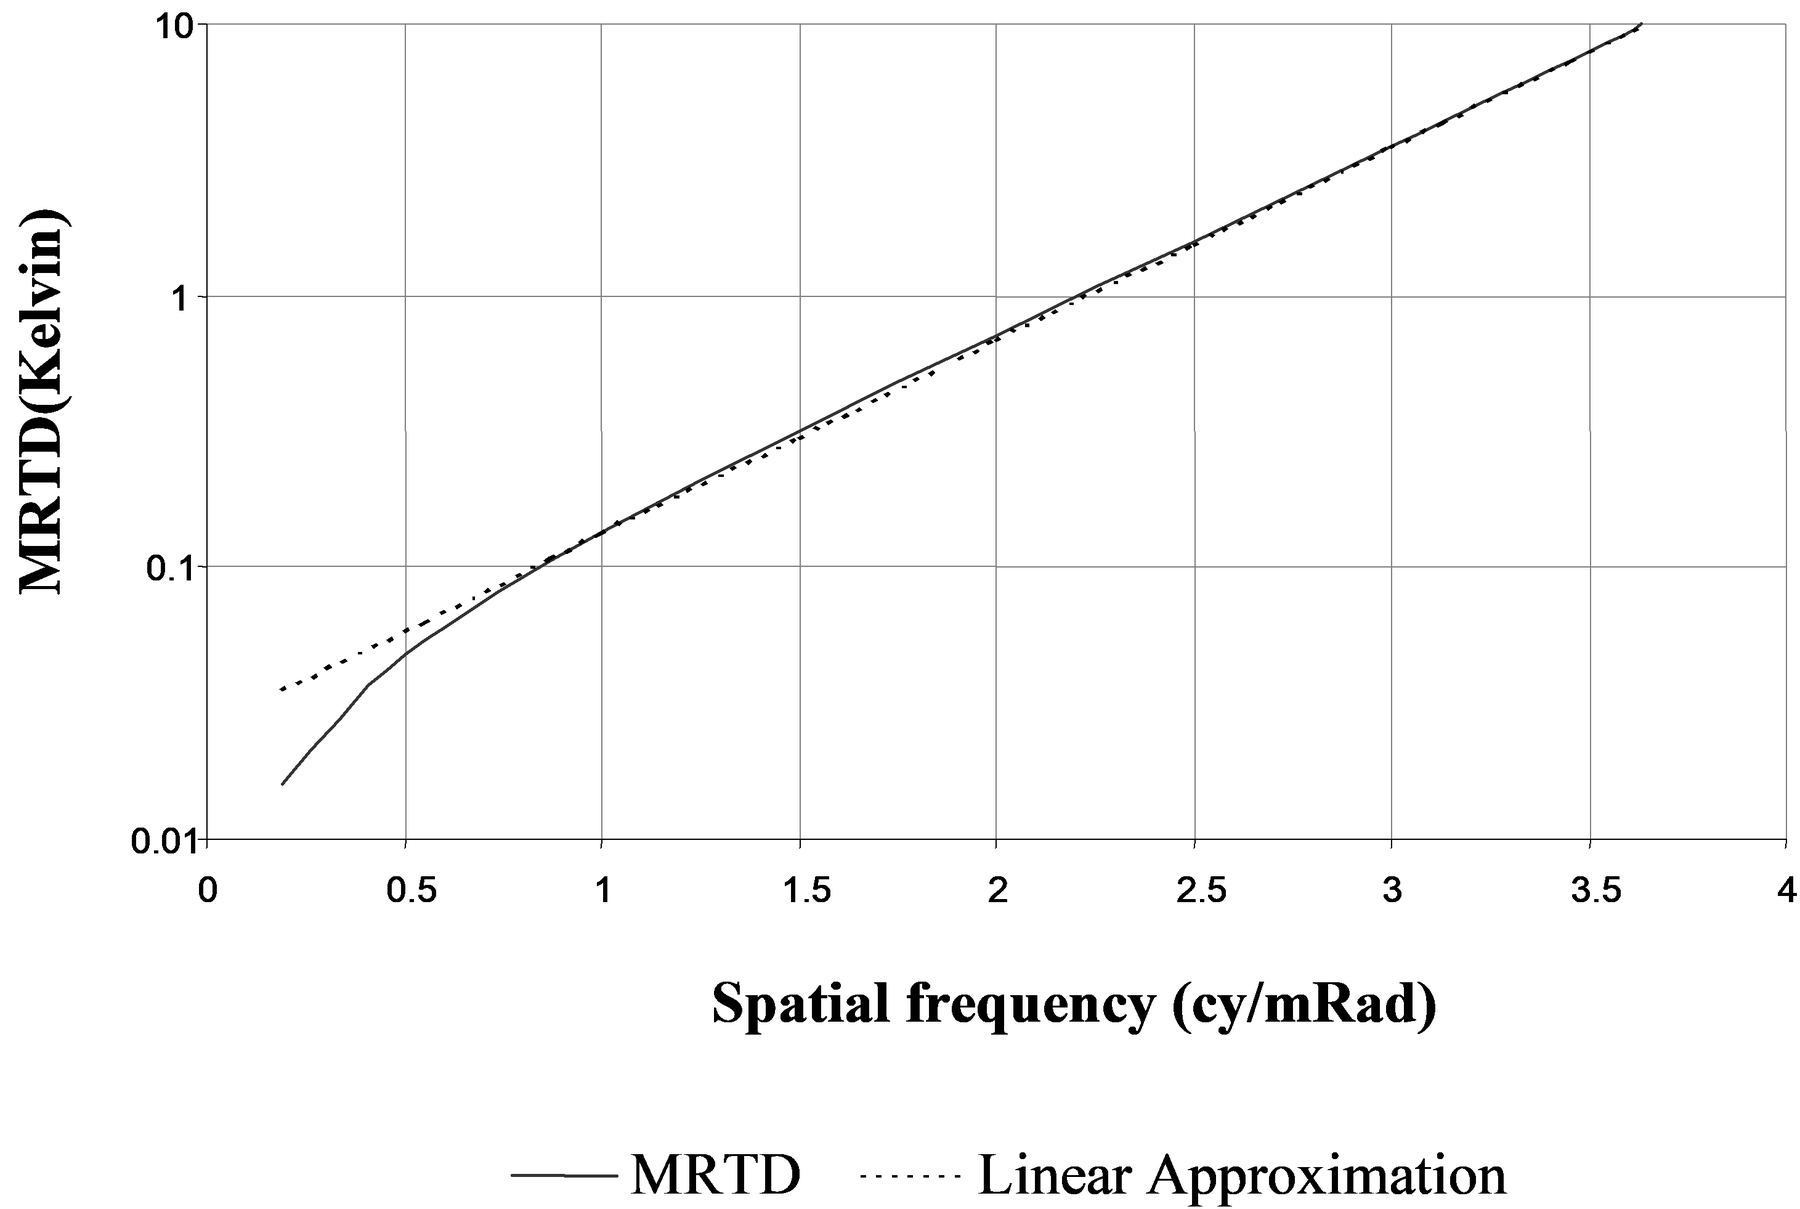
The thermal contrast of a target provides a figure of merit for the detectability of the target in a scene. However, the detection of a target in a scene also depends on the performance of the detecting system. The performance of a thermal imaging system is typically described by its ability to perceive temperature differences in a scene and its ability to perceive spatial details in a scene [2]. These two properties are inter-related and can be described by the widely accepted parameter of the MRTD of the system. The MRTD is measured from a thermal contrast between a uniform background and 4-bar pattern in the foreground. The MRTD curve shows the dependence of the minimum resolvable temperature on the spatial frequency associated with the bar to bar spacing. The MRTD curve for a contemporary thermal imager is at Figure 2.
Single temperature difference model
The technique described by Richardson [2] was employed to generate a single temperature difference for a contemporary MBT. To summarise the technique the target is considered to be composed of many areas each with a different temperature and emissivity and that the total power emitted from the target over the waveband of interest is given by:
(4)
where:
= Total exitance of the ith element
and = The area of the ith element
The background immediately adjacent to the target is similarly considered to be composed of many areas and that the total power can be calculated in the same manner. Conditional on these calculations is that:
(5)
It is therefore possible to derive the difference between the target and background power, thus:
(6)
This difference power can then be used to derive the equivalent difference temperature referenced to standard laboratory temperature of 293K (20°C) such that:
(7)
where P’ = the power emitted by a blackbody (ε=1) target of area A at 293K. Solving Equation (7) for ΔT provides the input value for range calculations based on the Johnson criteria for detection, recognition and identification. The spatial frequency is related to the Johnson criteria and critical spatial dimension of the target by:
(8)
where N = Number of resolvable cycles for detection, recognition or identification (Table 1)
R = Range to target
H = Critical target dimension
| Criterion | Number of Resolvable Cycles (N) [2] |
|---|---|
| Detection | 1.0 0.25 |
| Recognition | 4.0 0.8 |
| Identification | 6.4 1.5 |
The atmosphere is modeled by where σ is the atmospheric attenuation coefficient. The MRTD curve is assumed to be log-linear and can therefore be represented by:
(9)
where m and c are characteristics of the MRTD curve. It is then possible to derive an expression for range thus:
(10)
where ln(10) accounts for the conversion between base 10 and natural logarithms. Computational methods can now be used to produce a single detection, recognition or identification range for a complex object given the power and size of the individual radiating elements making up the object.
Temperature Survey of Contemporary Main Battle Tank
The exitance of individual elements composing a MBT is given by:
(11)
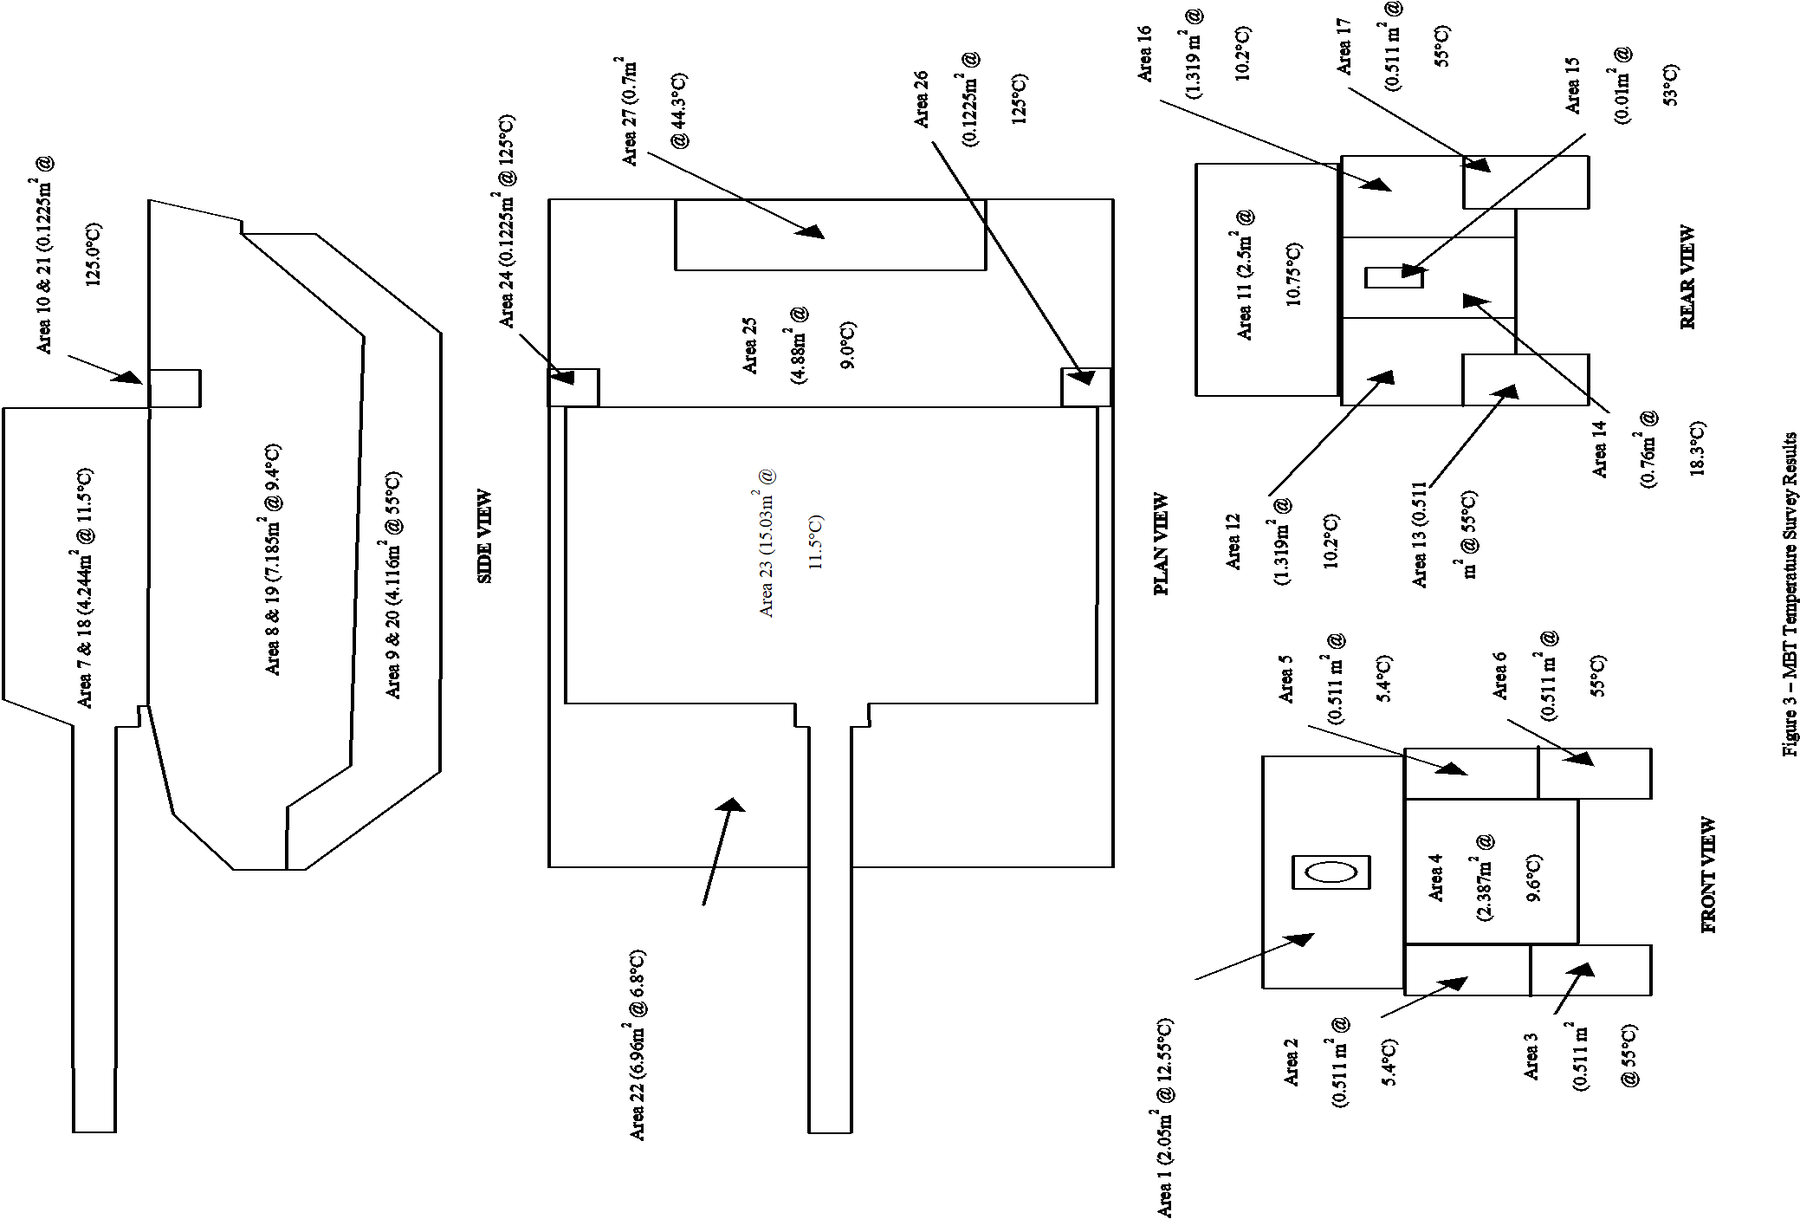
where T = Contact temperature and ε = Emissivity of the radiating element or T = Radiometric temperature and ε = 1. Conditional on the above statement is that the radiometric temperature measuring equipment operates over the waveband of interest. It is therefore possible to conduct a radiometric temperature survey of a MBT in order to derive the radiating power from each element. The results of the survey for a MBT with typical values for road wheel and track temperatures are at Figure 3.
Observation viewpoint model
Implicit within the power calculations presented so far is that the observation viewpoint is normal to the radiating surface. This is clearly not true for all viewpoints and to account for this variation Equation (4) must be modified to include an observation viewpoint factor. In the model presented all surfaces were considered to be either normal or parallel to the ground. However, an orientation factor could be included to improve the accuracy of the model. Taking individual elements to be Lambertian radiators it is possible to group elements into regions and apply an appropriate viewpoint factor. In this model the elements were grouped into the regions of front, left side, back, right side and top. This allowed matrix mathematics to be used with columns of the matrix representing the regions of the MBT.
Model implementation
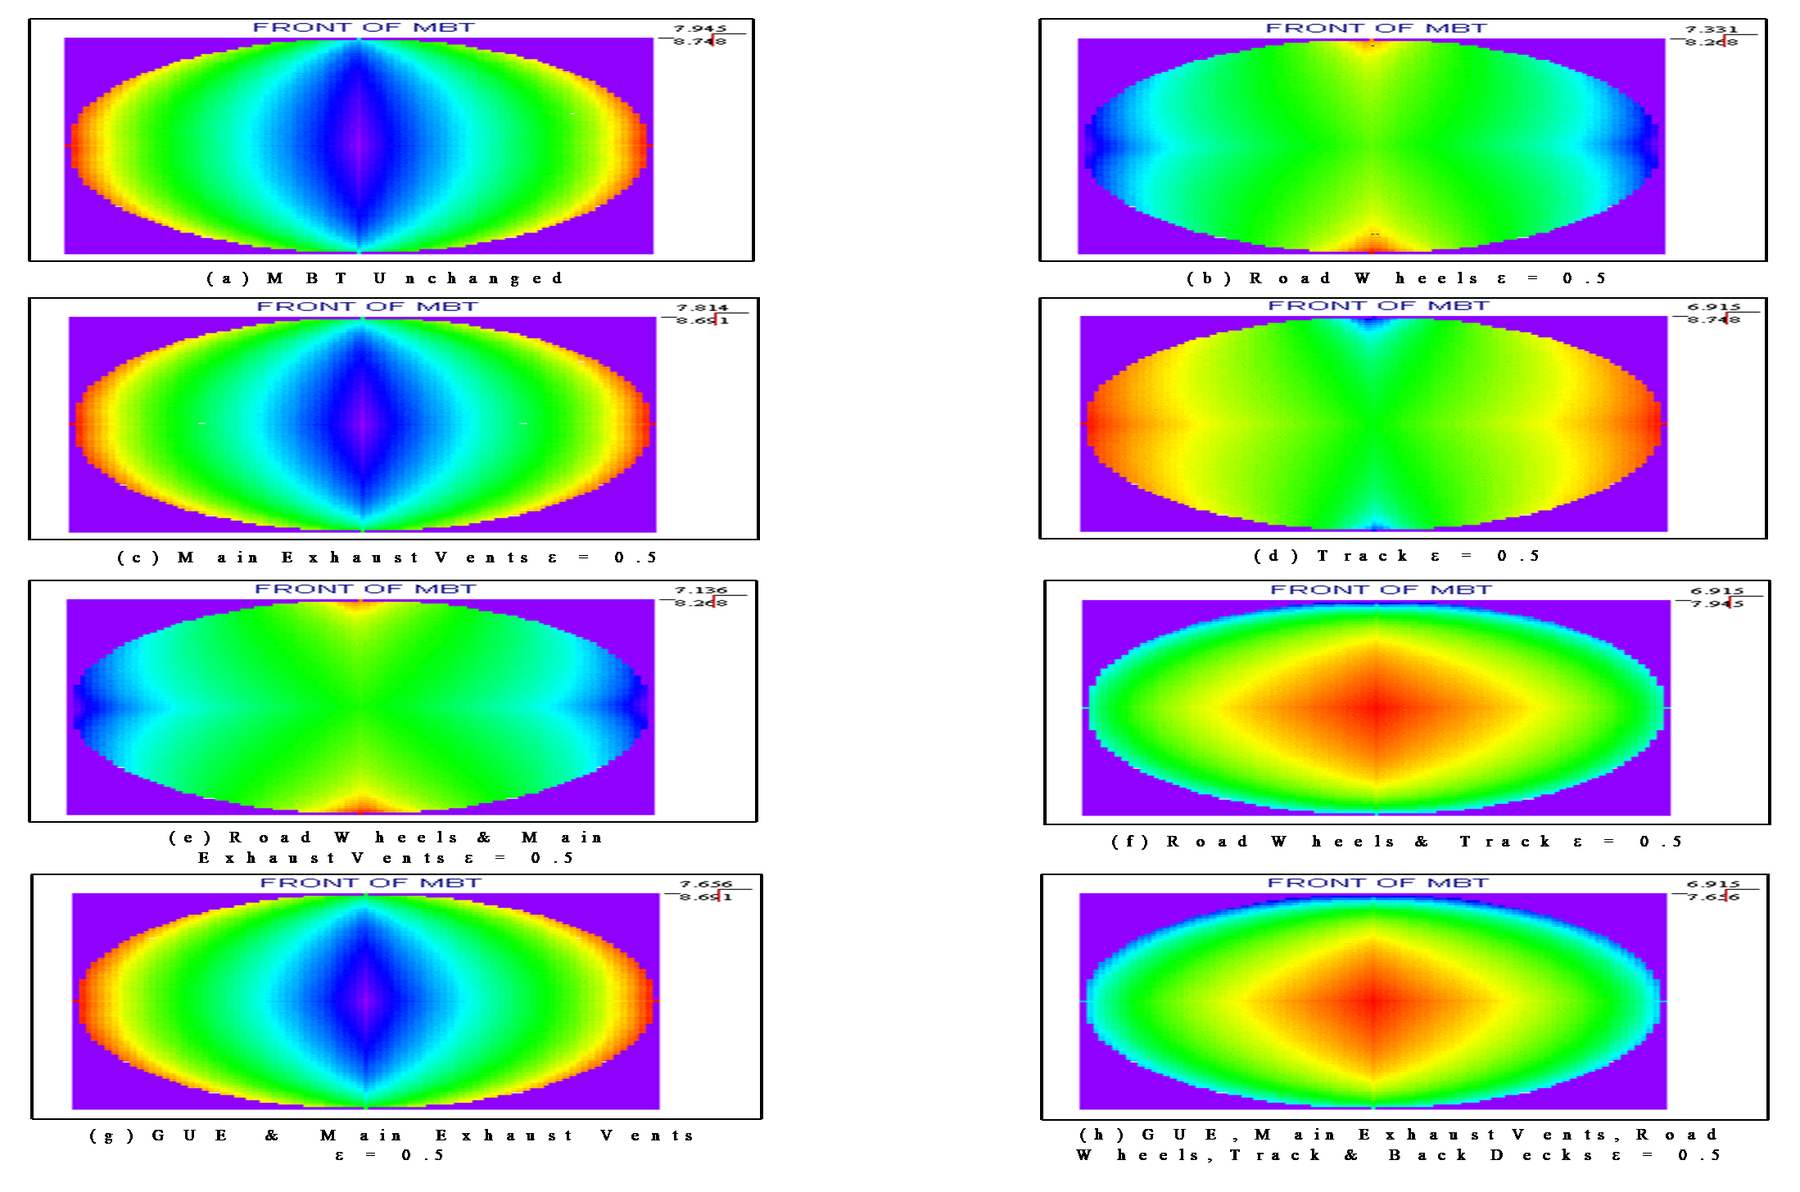
Mathcad was used as the software application platform for the model. Three input matrices were used to enter the radiometric temperature, the area and the emissivity of the individual elements. The emissivity matrix allows the analysis of the effect of thermal camouflage techniques on the overall detection, recognition and identification range. The model program displays the results as a hemispherical colour plot of the detection, recognition or identification range of the object being viewed. The centre of the plot is directly above the object, the azimuth observation angle is referenced to the 12 o’clock position on the plot. The elevation observation angle is the radial magnitude from the centre of the plot, with the centre representing 90° and the circumference of the circle representing 0°. Increasing values are represented across the colour spectrum from purple (minimum value) through blue, green and yellow to red (maximum value) and provide a qualitative measure of the vulnerable areas of the object. Each plot is colour spectrum scaled separately from the minimum value of the plot data in order to enhance differential variation in each plot. The minimum and maximum values are shown in the top right corner of the plot, with the minimum value uppermost.
Predicted vulnerability of MBT
Figure 4 shows the colour plots for the detection range of a contemporary MBT with thermal camouflage applied to various areas. The method of camouflage is arbitrary but is taken to provide a 50% reduction in emissivity. The minimum and maximum percentage improvement can be calculated from:
(12)
(13)
Comparison of Figures 4(a)-(d) thus indicates that a reduction in detection range of 5.8-8.4% is achievable by camouflaging the road wheels only whereas a detection range reduction of 0.6-1.6% is possible by camouflaging the main exhaust vents only. Moreover, up to 14.8% reduction in detection range is possible by camouflaging the track only, however, in this case the reduction is limited to the front and rear views. It is therefore evident that thermal camouflage should be focussed on the road wheels and track before the main exhaust vents. This is confirmed by Figure 4(f), which shows a detection range reduction of 10.1-14.8%. In this configuration the top of the MBT becomes the most vulnerable to thermal detection. Application of thermal camouflage to the main exhaust vents, engine compartment decking and Generator Unit Engine (GUE) exhaust then becomes appropriate resulting in an overall detection range reduction of 14.2-14.8%.
Summary
There are many thermal signature prediction models available that provide far greater fidelity and resolution than the model presented in this paper. This model is not attempting to emulate these models but rather provide a quick and flexible method of obtaining qualitative data on the thermal signature of a target. The model fits on a single floppy disc and can easily be run on a desktop or laptop computer. As such the model would have utility as a first filter of data during trials work or as a concept development tool for testing signature reduction ideas. The parameters used by the model are input as matrices thus the detail of the model, and thereby resolution, can easily be adjusted to suit the user’s requirement. Large matrices will, however, increase the amount of computer memory the model uses and slow down the processing, which took approximately three minutes per run for the MBT model presented.
There are, however, a number of limitations to the model that are worthy of note. Firstly, the model presented assumed that elements were either parallel to or normal to the ground. In all but the simplest cases this will not be true and an orientation offset would need to be included. The offset would typically consist of two additional input matrices; one for the azimuth offset angle and one for the elevation offset angle. In this way complex shapes can be handled by the model, although, there will be an increase in the processing time. Secondly, the model does not account for environmental effects, such as rain, wind chill or solar heating. However, knowledge of the effect that environmental conditions have on the temperature difference and emissivity of the elements can be used to produce snapshot predictions for each case. Finally, the model assumed a log-linear MRTD curve, which, from Figure 2, is not valid at very low temperature differences and spatial frequencies. In fact the model gives a pessimistic prediction in this region. Typical conditions in the land environment are well removed from this region operating in the few degrees of temperature difference region. However, it is possible that detection range predictions of very low temperature difference targets in very high levels of atmospheric attenuation (σ>1.5) will be over pessimistic.
It was not possible to fully validate the model due to the cost and logistic burden of conducting a field trial. Nevertheless, the model results were compared against a previous study [2] that did include field trials and demonstrated a very strong correlation between results.
References
[1] Training and Doctrine Command, Pamphlet 525-66, Future Capabilities, 1 May 97.
[2] M Richardson, “Reducing Complex Infra-red Scenes to a Single Temperature Difference”, Journal of Defence Science, Vol. 3, No. 3, p. 397, July 1998.