
Volume 3, Number 3, November 2000
Muzzle Flow Field Studies
Abstract
Recent experimental studies on muzzle blast overpressure histories of an 81mm mortar system have revealed a number of reproducible features following the main blast front. Some of these features are shock fronted, with pressure rises of similar magnitude to that in the main blast front. The time lapse indicates that these may be associated with the precise geometry of the projectile. A study was therefore undertaken, using our previously validated CFD code, to examine the evolution of the flowfield behind the blast front. The primary concern is to achieve an improved understanding of the changing flowfield, and how this determines the features of the experimentally measured pressure history.
Introduction
Recent advances in computational fluid dynamics (CFD) techniques have led to the development of a number of codes, [1–3], for computation of intermediate ballistics flowfields during projectile launch. These have been applied to several different studies, to follow the flow through muzzle brakes, to clarify heat transfer and patterns of particulate damage in muzzle brakes, and to examine the separation of sabots in this flow regime. Such codes are increasingly being employed to assist the understanding of these highly transient complex flowfields, where only limited experimental data is available. In this paper such a study of a muzzle flowfield, employing both experimental measurements and CFD analysis to provide greater understanding of experimental measurements, is described. The paper describes the work in the form of a case study.
81mm mortar firings
An experimental study of overpressure histories in the muzzle flowfield of an 81mm mortar system was undertaken recently as part of an ongoing study of gun-break signatures. Twenty rounds were fired on full charge, and the pressure histories were recorded at six different positions in the resulting flowfield, at distances between 10 and 30 calibres (D) from the muzzle, on rays at angles of 5o, 30o and 60o from the forward extended barrel axis. Kistler type 603B gauges mounted side-on to the radial flow in a pancake configuration, connected to charge amplifiers, were used to measure the static pressure. The gauge positions were selected to give a reasonable spread of locations in the forward sector of the near field, without the risk of the gauges being damaged by close encounters with the projectile.
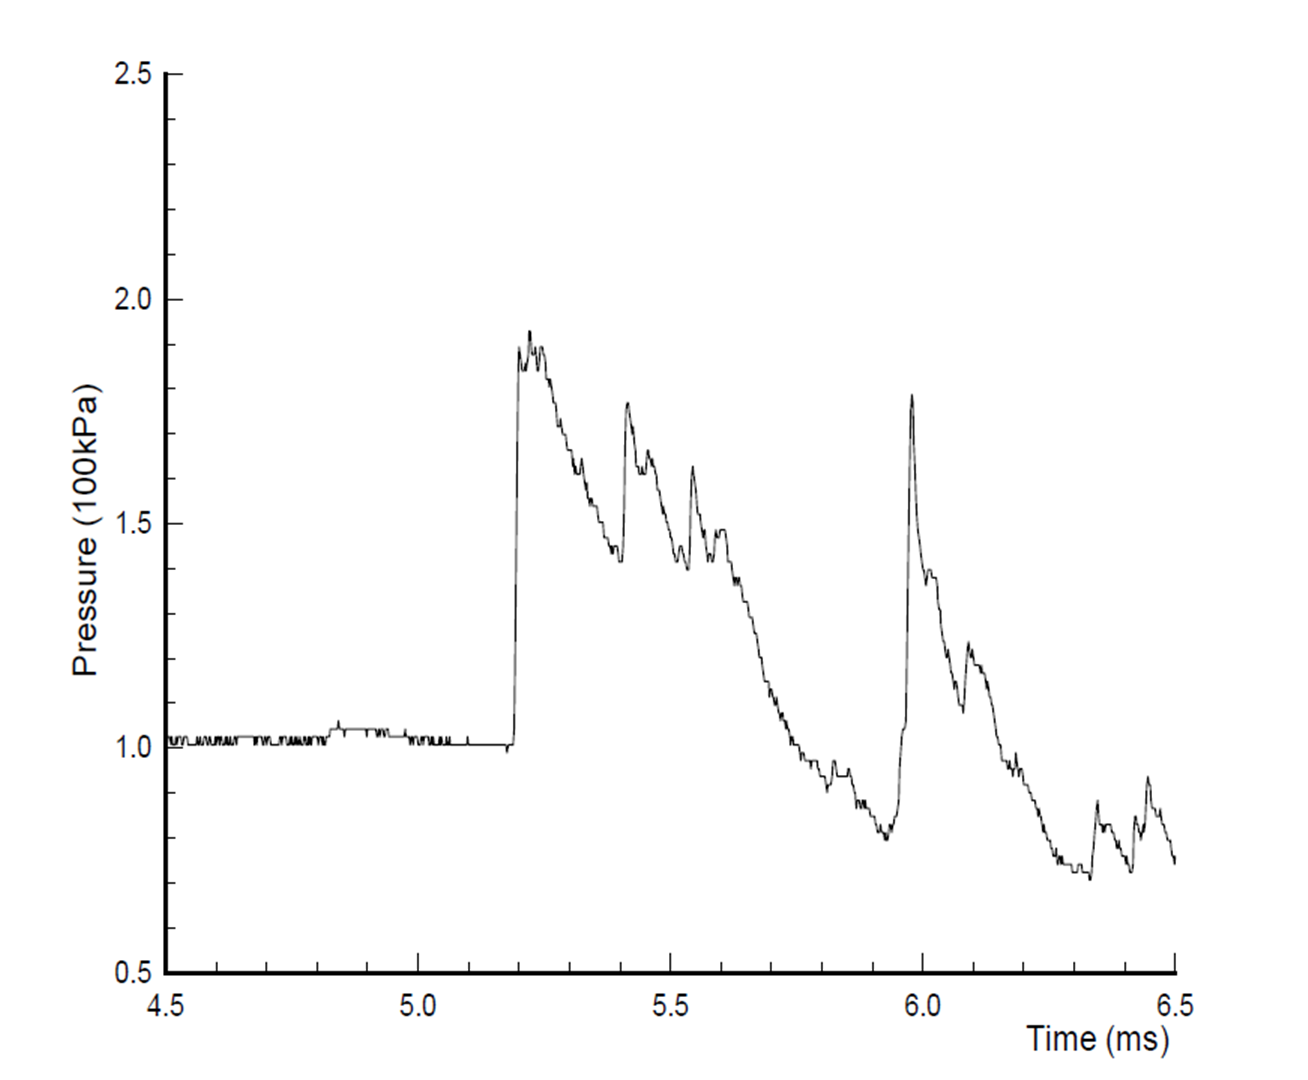
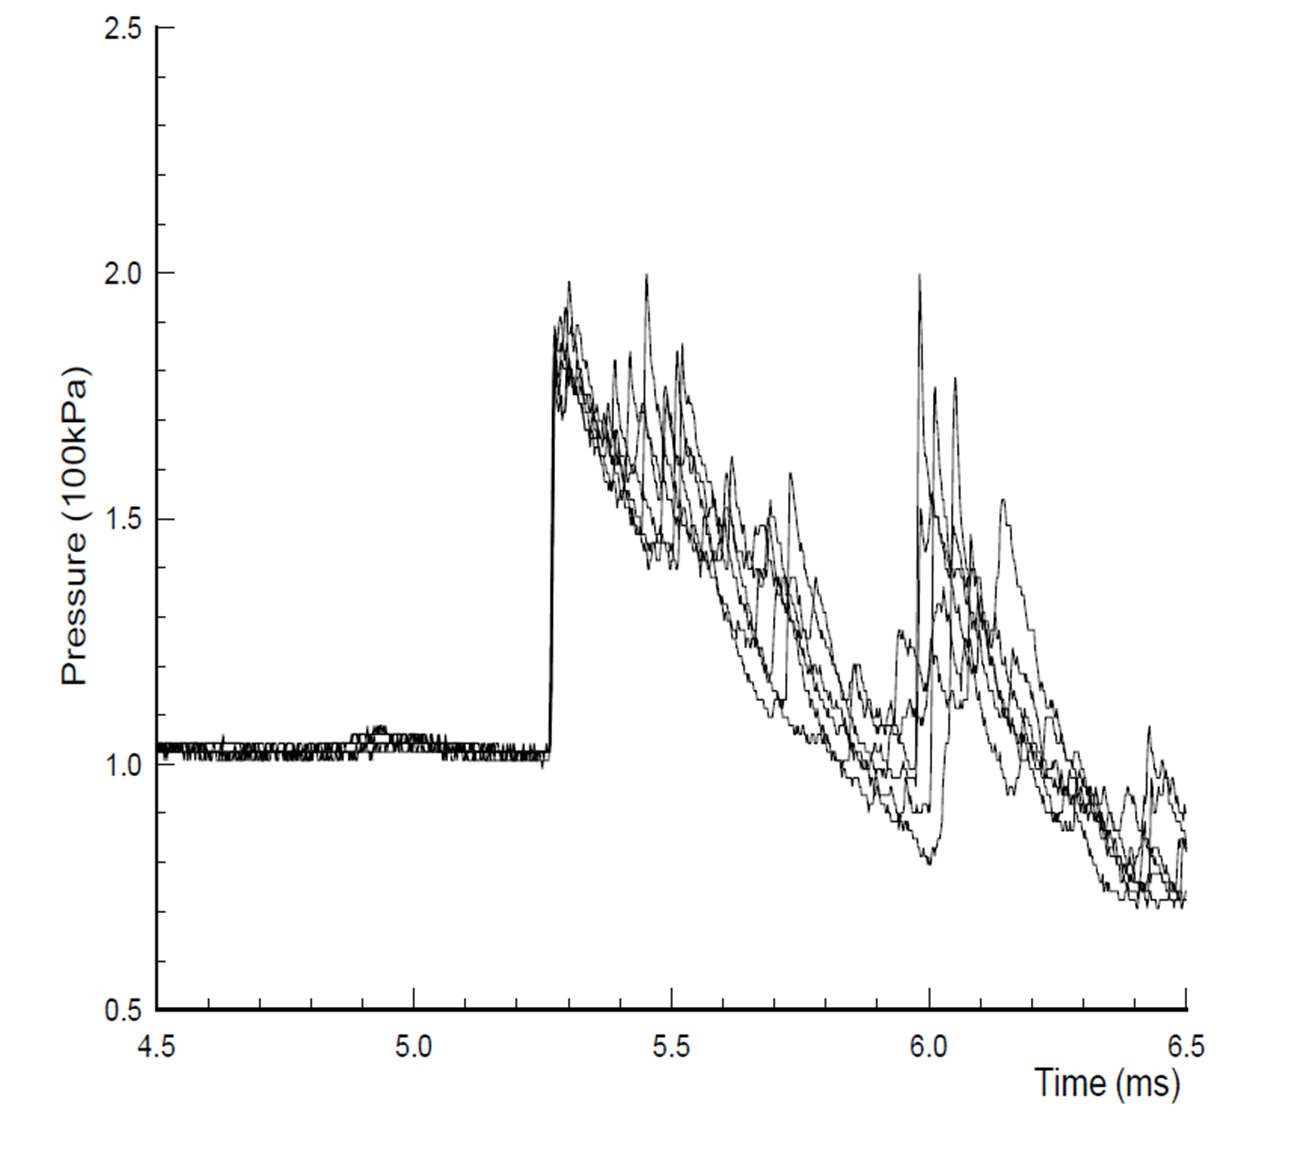
When the recorded pressure histories were examined two features of interest were noted. The first was a number of shock-fronted features behind the main blast front, see Figure 1, which appeared on several traces from some, but not all the rounds. In some cases these shock-fronted features were, if anything, more conspicuous at greater distances from the muzzle. It is of particular interest to determine whether these features are directly related to the projectile geometry. The second feature was that when the traces recorded at the same location for different rounds were overlaid, with the blast arrival times matched, the first part of the signals showed broad agreement, but there was significant divergence of the traces a fraction of a millisecond after the blast arrival, although there was overall similarity—see Figure 2 for example. This was noted at several different gauge locations, but the cause was not clear. Hence this study was initiated.
MBIB2 code
The MBIB2 code [1] is a two-phase flow code developed originally for the study of particulate impact on the muzzle brake during the intermediate ballistics phase of projectile launch. It is assumed that the highly transient compressible, but inviscid, flow is symmetric about the barrel axis. Turbulence is not included in the current code. A moving projectile may be included in the simulation if required, and has been included in this study.
The code solves the finite volume form of the equations of conservation of mass, momentum and energy for the gas phase using a cell-centred Eulerian approach. If a particulate phase is present, mass and momentum equations for this phase are added. Zalesak’s multi-dimensional flux corrected transport algorithm [4] is employed to limit the overshoots and undershoots commonly associated with the numerical computation of shock waves. The low-order flux is calculated using a first order exact 1D Riemann solver, and the higher order flux is predicted using a second-order central difference scheme based on a predictor-corrector method.
It is assumed that both gases, that is the propellant gas efflux and air, satisfy the ideal gas law with the appropriate gas constant, and that the mixture properties are given by appropriate weighted averages.
A number of calculations have been undertaken to validate this code against published results in [3,5], and have demonstrated that the results from this code are in good agreement with experimental data.
Numerical simulations
The general form of the intermediate ballistics flowfield has been described in a variety of texts—see for example [6]. A quasi-steady stucture exists, consisting of a main blast front, ahead of a contact surface, behind which is a highly overexpanded jet bounded to the front by the Mach disc, and to the sides by the so-called barrel shock. A vortex forms from the initial shear layer near the junction of the Mach disc and the barrel shock. Experiments with open cylindrical shock tubes have also been used to examine the structure of these fields as described in [3], where high-resolution shadowgraphs of such a flowfield are shown. The questions of interest here are to what extent these structures are correctly reproduced by the current code, and how these structures interact to produce the features of the experimental pressure histories discussed above.
Initial simulations showed that a reasonably accurate representation of the bomb geometry, particularly to the rear of the obturating ring, is essential if the correct blast front strength is to be calculated. This is to be expected when it is appreciated that the geometry of this part of the bomb determines the opening of the gun tube, and hence the supply of propellant gas to the blast wave. No attempt was made to represent the tail fins within this axisymmetric simulation.
In addition care must be taken to ensure that the inlet conditions, applied to the propellant gas flow inside the mortar tube are sufficiently accurate. An internal ballistics code was used to calculate the internal flow history after the bomb exits the mortar tube, and this history was then used as the inlet condition where the tube enters the intermediate ballistics computational domain.
Results and discussion
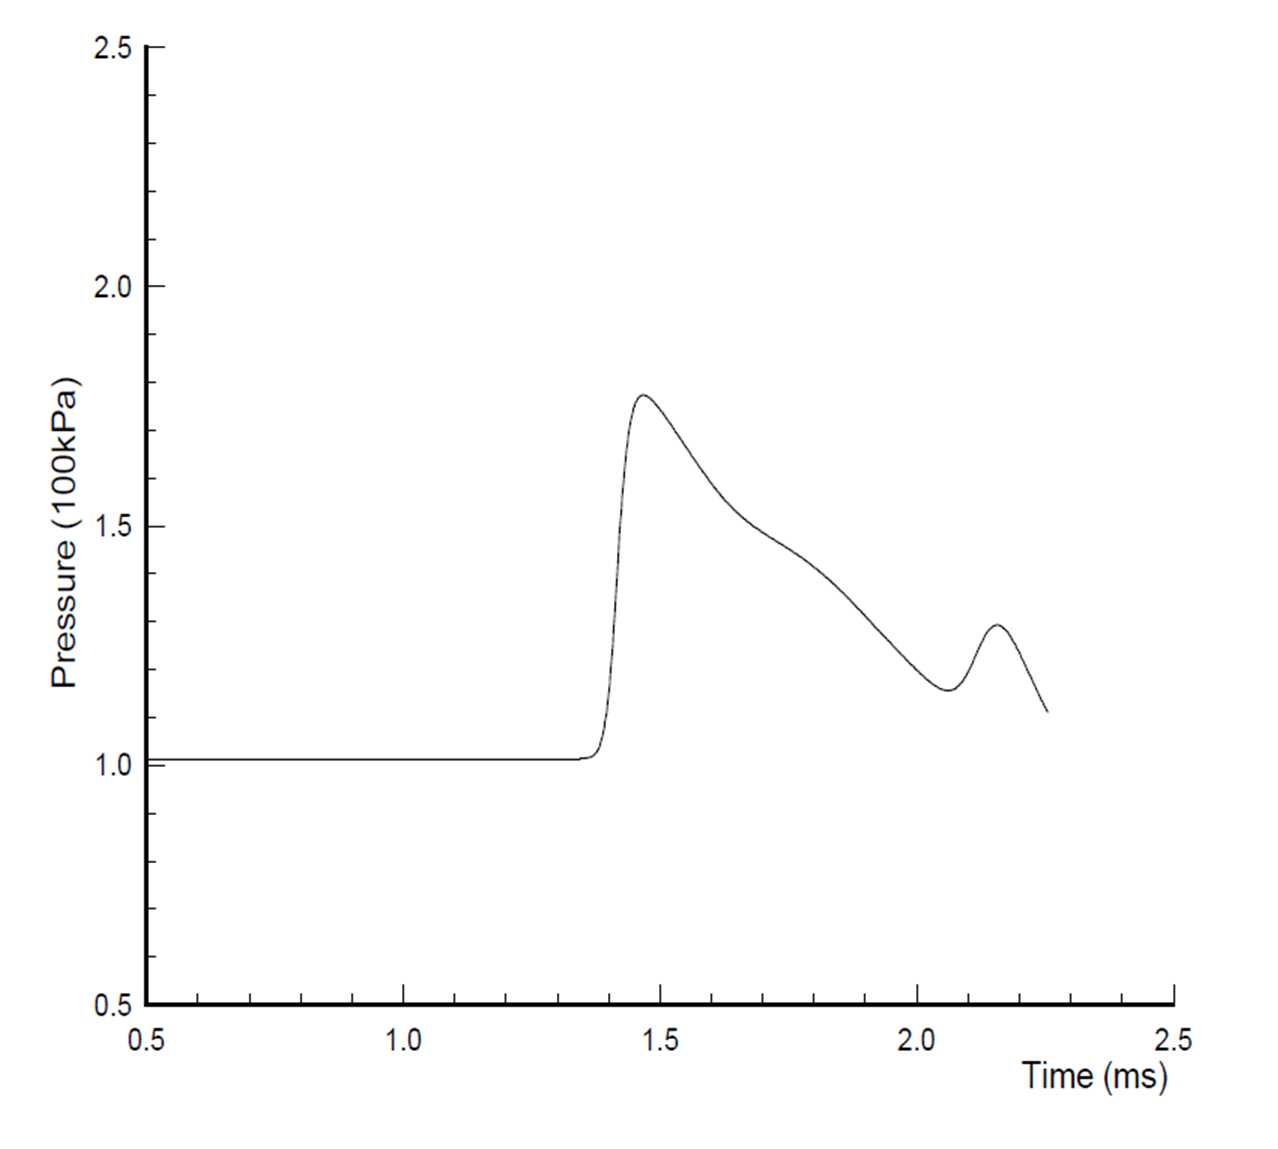
After suitable mesh refinement to ensure that the results were well converged, the pressure history in Figure 3 was calculated. It is seen that there is a pressure rise 0.7 ms after the passage of the blast front, which matches in timing the second shock in Figure 1, (allowing for the different time origins, the experimental time origin being trigger time, and the numerical time origin being the instant of first gas release from the gun tube). However, even allowing for some smoothing due to numerical diffusion, it is clear that the second peak in the simulation is very much reduced in magnitude. So this feature can be reproduced to some extent, but what causes it?
Examination of the simulated pressure distribution in the blast flowfield illuminates this. Figure 4 shows the pressure contour plots at 1.75ms and 2.15ms, as calculated with mesh size dx = 3.3mm, dr = 3.1mm, as for Figure 3. The former time is that of the maximum extent of the shock bottle which shrinks thereafter, and the latter the time of the second pressure peak at the 60o, 10D gauge. A clear bow shock is formed around the tail of the projectile while it is enveloped in the expanding propellant gas. Note the formation of a vortex which progresses forward as the shock bottle weakens. The symbol + marks the location of the pressure gauge under discussion.
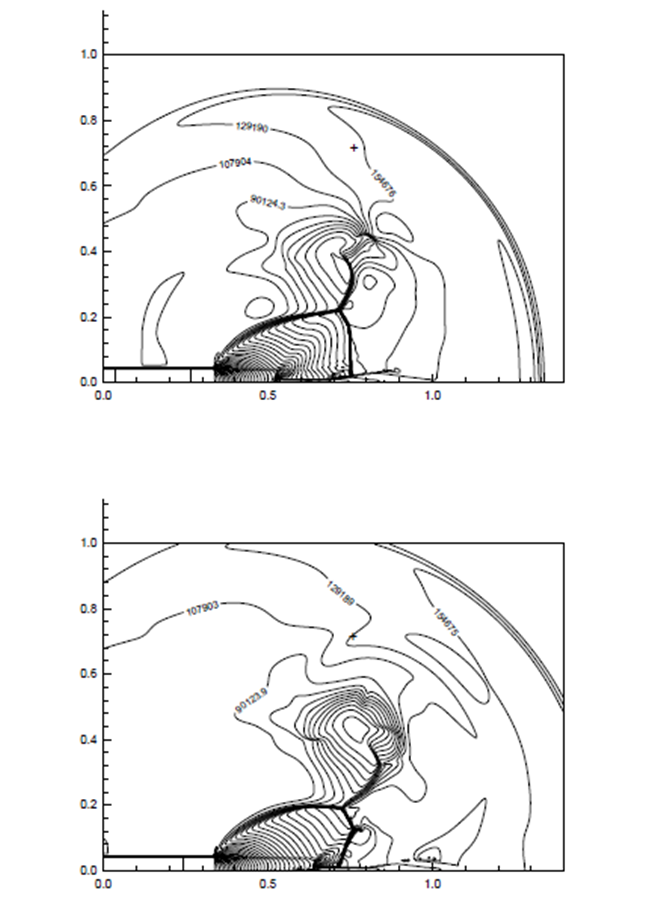
The blast front propagates outwards, weakening as it does so. In addition a high-pressure region forms behind the front and this spreads, resulting in a pressure ridge which sweeps past the gauge position in the direction of polar angle increasing, peaking at approximately 2.15 ms, as seen in the lower part of Figure 4. With the gauge mounted in a mushroom plate configuration, this ridge will reflect from the gauge plate causing a further increase in pressure. Thus the feature will be intensified resulting in a pressure history at the gauge such as that seen experimentally.
The variability of the pressure histories at this gauge location becomes evident some 0.2 ms after the blast front passes, which is apparently the time at which the vortex forms and begins to intrude at the gauge location. Similar variability is seen to commence at the 30o, 10D gauge on the other side of the vortex at the same time, which is somewhat longer after the passage of the blast front past this point.
Conclusions
By combining experimental measurements with CFD simulations greater understanding of the muzzle flowfield of a mortar system has been achieved. The hazards of pressure measurement in complex flowfields have also been shown: some at least of the shock-fronted features are due to disturbance of the flowfield by the pressure gauge mountings. Although it was intended that the gauges were mounted side-on to the flow, the mountings should have been rotated so that the normal to the plates pointed in the azimuthal direction, not towards the axis.
The power of CFD simulations to enhance our understanding of muzzle flowfield evolution, and clarify features on experimental pressure histories has been amply demonstrated. CFD can be employed to fill in details of the flow which are beyond the reach of experimental techniques in this hostile environment, and thus improve the overall picture of complex flowfields. In addition simulations can assist the design of experiments in order to capture the data of greatest significance, and hence ensure the most cost-effective use of trials weapons and facilities.
Acknowledgement
The author is most grateful to DERA for permitting the use of their experimental data for comparison purposes.
References
[1] A. Dawes and A. Crowley, “Gas-particulate Flows with Heat Transfer into Muzzle Brakes”, 15th International Symposium on Ballistics, Jerusalem, 1995.
[2] R. Cayzac, E. Carette, T. Alziary de Roquefort, C. Vaglio, and J. Brossard, “Intermediate Ballistics Computations and Validations”, Ballistics ’98, 17th International Symposium on Ballistics, Midrand, South Africa, 1998.
[3] J. Wang and G. Widhopf, “Numerical Simulation of Blast Flowfields Using a High Resolution TVD Finite Volume Scheme”, Computers & Fluids, 18, pp. 103-137, 1990.
[4] S. Zalesak, Fully Multidimensional Flux Corrected Transport Algorithms for Fluids, Journal of Computational Physics 31, pp. 335-362, 1979.
[5] G. Widhopf, J. Buell and E. Schmidt, “Time-dependent Near Field Muzzle Brake Flow Simulations”, AIAA/ASME 3rd Joint Thermophysics, Fluids, and Heat Transfer Conference, St. Louis, AIAA preprint 82-0973, 1982.
[6] G. Klingenberg and J. Heimerl, Gun Muzzle Blast and Flash, Progress in Astronautics and Aeronautics, Vol. 139, AIAA, 1992.