
Volume 17, Number 3, November 2014
Complementary Use Of Simulation And Experimental Methods In Deriving Pcd/h For Target Components
- 1 Modeling and Simulation Division, Agency for Defense Development, Yuseong, PO Box 35, Daejeon, 305-600 KOREA.
Abstract
The V/L code simulation method has been employed to develop Pcd/h of an electric relay which was used as a target in an experimental study for achieving its Pcd/h. Three different simulations have been conducted to reproduce kill probabilities of the relay resulted from the experiment. While vulnerability simulations produced much lower kill probabilities than the experiment result, a lethality simulation correctly reproduced it. It is discussed that if the lethality simulation setup correctly re-enacted the experiment, the experiment result cannot be interpreted as correct Pcd/h of the relay. Rather the correct one should be the result of the vulnerability simulation performed with the same setup as the lethality simulation. Finally, this paper concludes with stress on the need and importance of complementary use of the simulation and experiment methods in deriving component Pcd/h.
Introduction
A component Pcd/h is defined as a judgment that is used to determine whether a component is damaged or killed [1–3]. It is usually expressed in terms of the probability of rendering a component non-functional given it is subjected to some damage mechanism. Component Pcd/h are indispensable in component based vulnerability and lethality assessment, because they are to be used to determine the status of each component to evaluate functional status of the target on a system level after being subjected to an attack. The most satisfying method of developing Pcd/h of a component might be to perform experiments on a real component hitting with a damage mechanism. Unfortunately, this is almost impossible because it involves huge expense in components, manpower, financial resources, and time.
In this paper, a simulation method is employed to develop component Pcd/h of an electric relay which was used for an experimental study done by Hartmann et al [4]. The method is to describe a component in the same way with a complete target of a V/L (Vulnerability and Lethality) simulation code and to assess vulnerability of the component on the complete target [2,5]. Three different simulations are conducted using AVAL which is a Swedish V/L simulation code [6]. The first simulation is a vulnerability simulation performed with a setup which was originally developed by Hartmann et al [5]. The second is another vulnerability simulation with a modified setup. The last is a lethality simulation performed with the same setup as the second one. Kill probabilities obtained from these simulations are compared with the experiment results.
The lethality simulation rather than the vulnerability simulations correctly reproduces the same result as the experimental study. This reflects that, if the simulation setup exactly re-enacted the experiment, both the lethality simulation and the experiment results are not Pcd/h. Rather the correct one should be the result of the vulnerability simulation performed with the same setup as the lethality simulation. This paper concludes with stress on the need and importance of complementary use of the simulation and experiment methods in deriving component Pcd/h.
Review of the experimental study
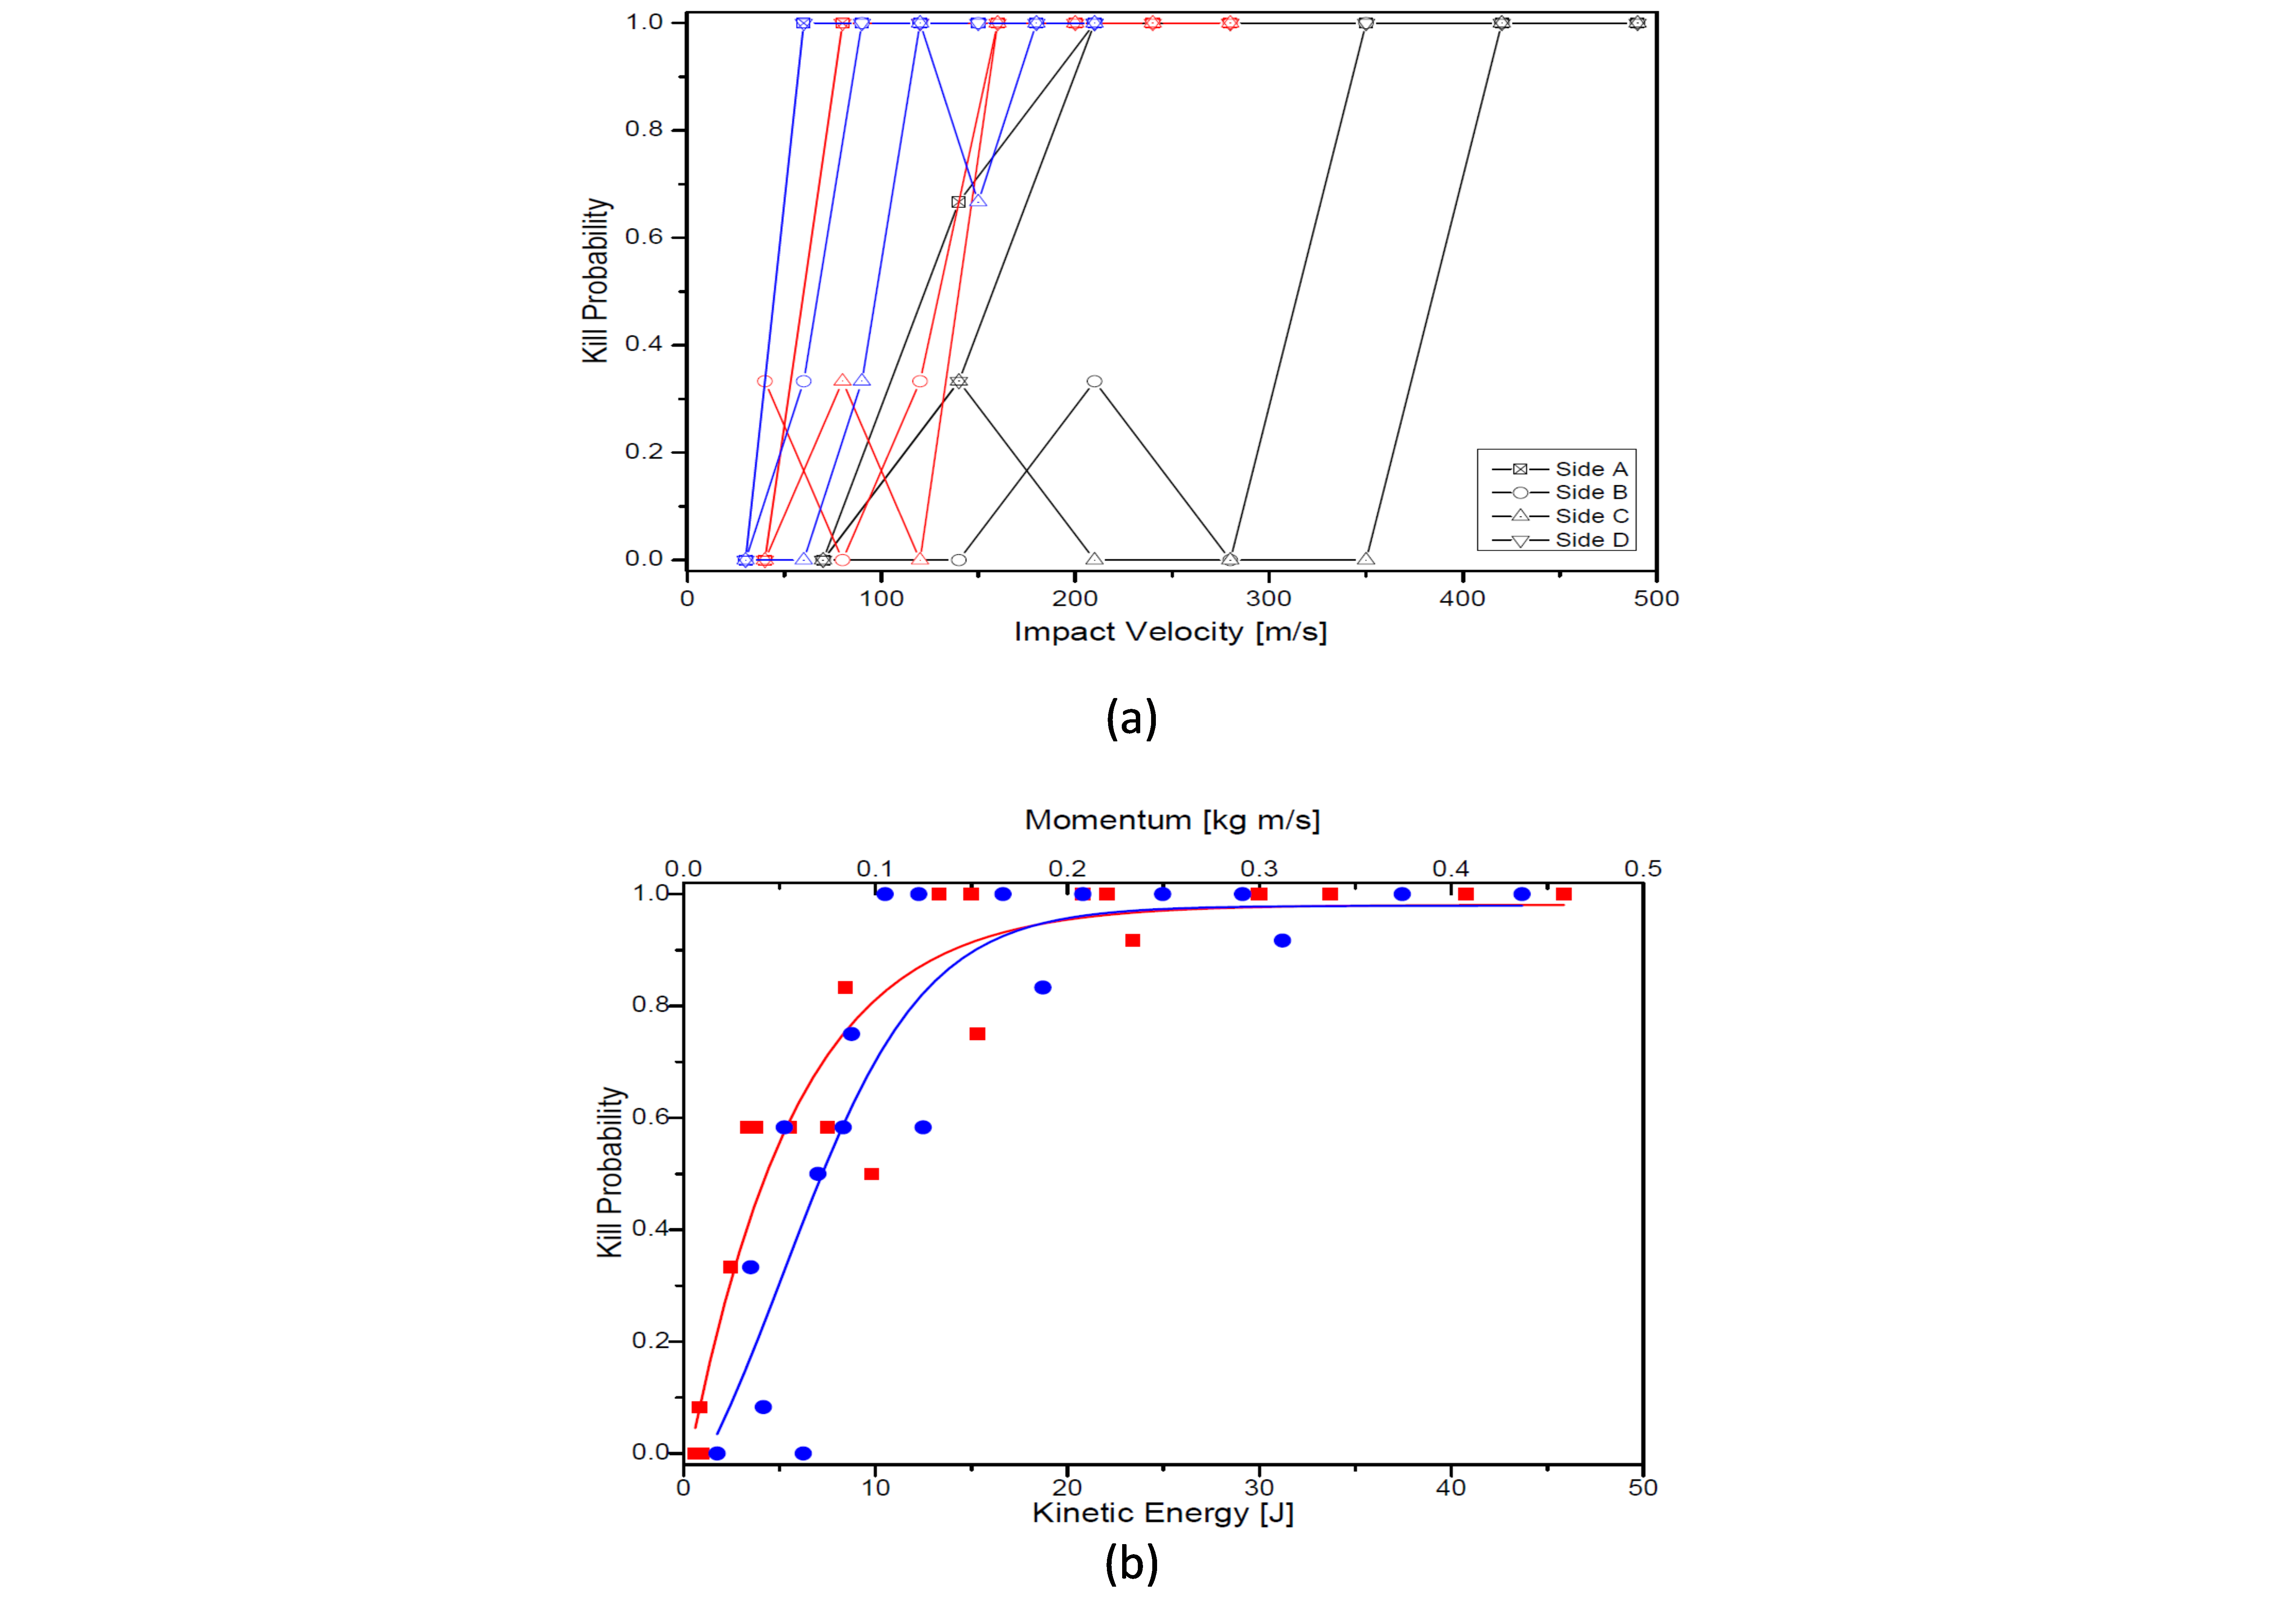
The experiment by Hartmann et al [4] might be the only work which can be found from scientific journals that faithfully followed typical procedures of the experimental method in developing Pcd/h. They selected an electric relay as a target component, and roller bearing balls of diameter 4, 6, and 8 mm as projectiles. They first performed preliminary tests to estimates the ballistic limit V50 of each projectile for the plastic shell of the relay. Next, they hit the relay on four faces (except top and bottom) at various velocities. They repeated three times for all combinations of faces, projectile sizes, and impact velocities, and finally made about 160 shots. Kill probability for each combination was calculated and averaged for four faces, and then expressed as functions of momentum and kinetic energy.
Figure 1(a) presents kill probabilities of the relay for every experiment combinations. It shows that the relay is less vulnerable to impacts on sides B and C than on sides A and D at lower velocities, but it becomes equally vulnerable to impacts on all sides at higher velocities above 5V50 for all projectiles. Figure 1(b) presents averaged kill probabilities as functions of momentum and kinetic energy. Note that the labelling rule for the faces follows that of [4].
Here, several remarks should be added for subsequent work. First, only four of six sides (excluding top and bottom) were impacted due to limitations in the experimental setup. Second, they used somewhat large projectiles compared to subcomponents of the relay and empty volumes between them. Third, they assumed that hit points were evenly distributed over the impacted sides.
Simulation setups
In the simulation method the first step is to develop a geometrical description of a component, fault trees, and Pcd/h of subcomponents in the same way with a complete target of a V/L simulation code.
Target description of the relay
The simulation setup for the electric relay was originally developed by Hartmann et al and used for some simulations [5]. Figure 2 shows geometrical description and all critical components of the relay. It is assumed that the relay is stopped from operating when any critical subcomponent is damaged, and only a fault tree is defined for stopping its operation. In the original description, the internal steel structure (ISS) was not regarded as a critical component. However, in this paper it is assumed that the ISS should be considered as a critical component to match the simulation with the experiment results. As can be seen later, this assumption will improve the simulation results.

Penetration properties of the projectiles
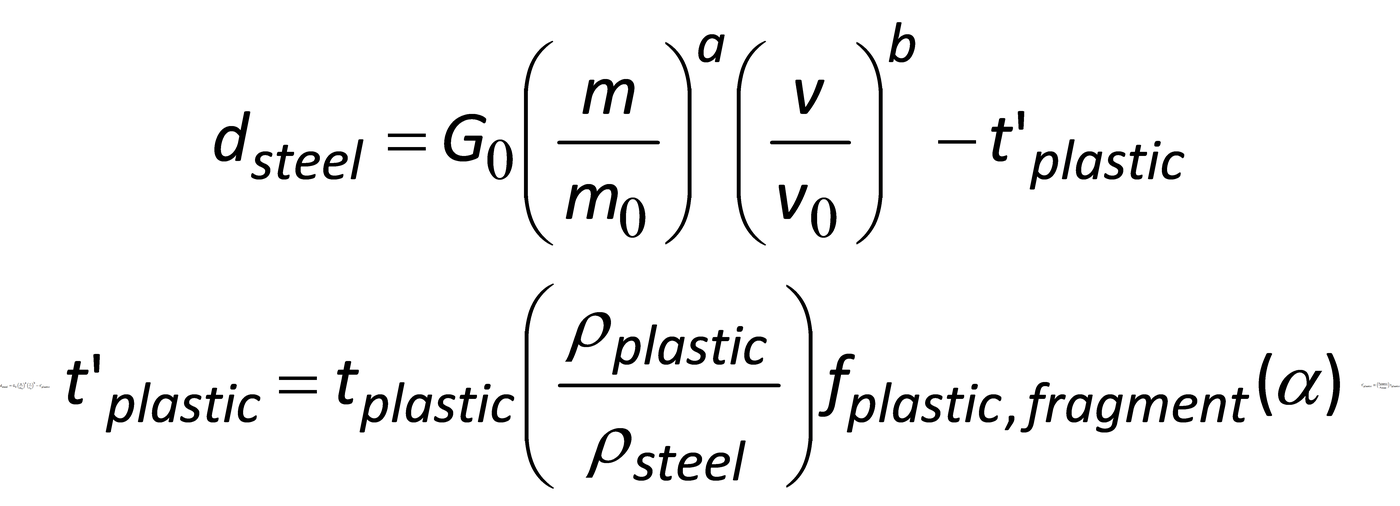
In AVAL the penetration depth into homogeneous mild steel of a projectile is assumed to be a function of its mass and velocity and is calculated according to [6]:
where m0 and v0 are mass and velocity of a reference projectile and G0 is the reference penetration depth in homogeneous mild steel of the projectile at normal impact. The parameters a and b are usually set to be 1/3 and 1, respectively. In this paper the reference values are defined to match the experimental ballistic limit V50 for the plastic shell: m0=0.25×10⁻³ kg, v0=687.7 m/s, and G0=1.465×10⁻³ m. With these reference values, the projectiles can marginally penetrate the 1 mm plastic shell.
Subcomponent pcd/h
Most of subcomponents seem to be quite fragile to the impact of such large projectiles, and resulting component Pcd/h of the relay will not be so sensitive to variations in their Pcd/h. Subcomponents are so fragile that kill probabilities are saturated at relatively low impact velocities. Moreover, inaccuracies introduced by variation in subcomponent Pcd/h are far exceeded by the inaccuracies introduced by face averaging [3]. In the following simulations, Pcd/h developed in [5] are used for such components. However, the ISS also must be quite critical and fragile as will be discussed. According to the experiment results, ISS seems to protect critical subcomponents at low impact velocities. ISS of 1 mm steel plate is located along B and C faces, and kill probabilities for impact on sides B and C are less than those for sides A and D at low impact velocities. However, it might fail to protect the critical subcomponents at high impact velocities over 5V50. Projectiles may perforate the steel plate at such high impact velocities and hit critical subcomponents. However, calculations using penetration model (1) and (2) show that this cannot happen at 5V50. To perforate both plastic shell and steel plate of 1 mm thickness, the impact velocity should excess 8V50. This tells that something must happen near 5V50. Every critical subcomponent besides contactors is sustained on ISS, and the relay can normally operate only when their arrangement is kept properly. On the other hand, the ISS is rather weakly riveted on the bottom plastic plate, so it is possible to lose its support by impact before it is perforated. Once it loses its support, then the arrangement of subcomponents is disordered leading to an inoperable state of the relay. Unfortunately, it is hard to treat such a dynamical phenomenon in current V/L simulation codes. A way to treat failure of ISS should be considered to match with the experiment. One way is to regard it as a critical component which is pretty fragile to impacts and to define its Pcd/h. However, it is hard to estimate its Pcd/h analytically or empirically for such a hard component.
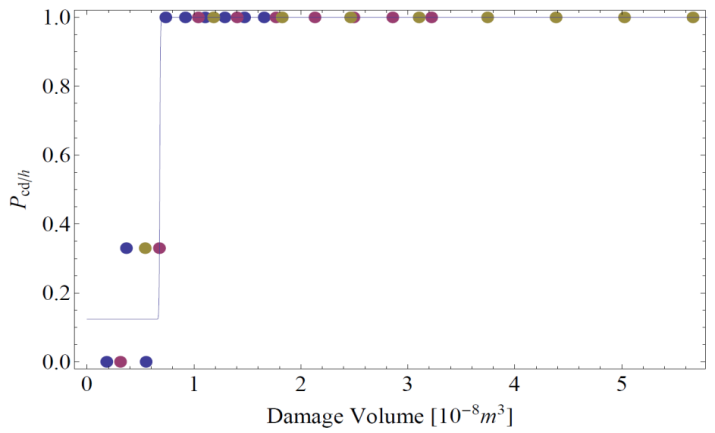
To estimate Pcd/h of the ISS, it is assumed that the relay becomes inoperable when the ISS loses its support, and kill probabilities for impacts on B and C are compatible with its Pcd/h. Since Pcd/h should be expressed as a function of damaged volume instead mass and velocity of projectiles for use in AVAL, it needs to calculate damage volume and to match with its kill probability. To do this, penetration depth into a steel plate is first calculated, and then damage volume is calculated. Penetration depth into a steel plate is given by
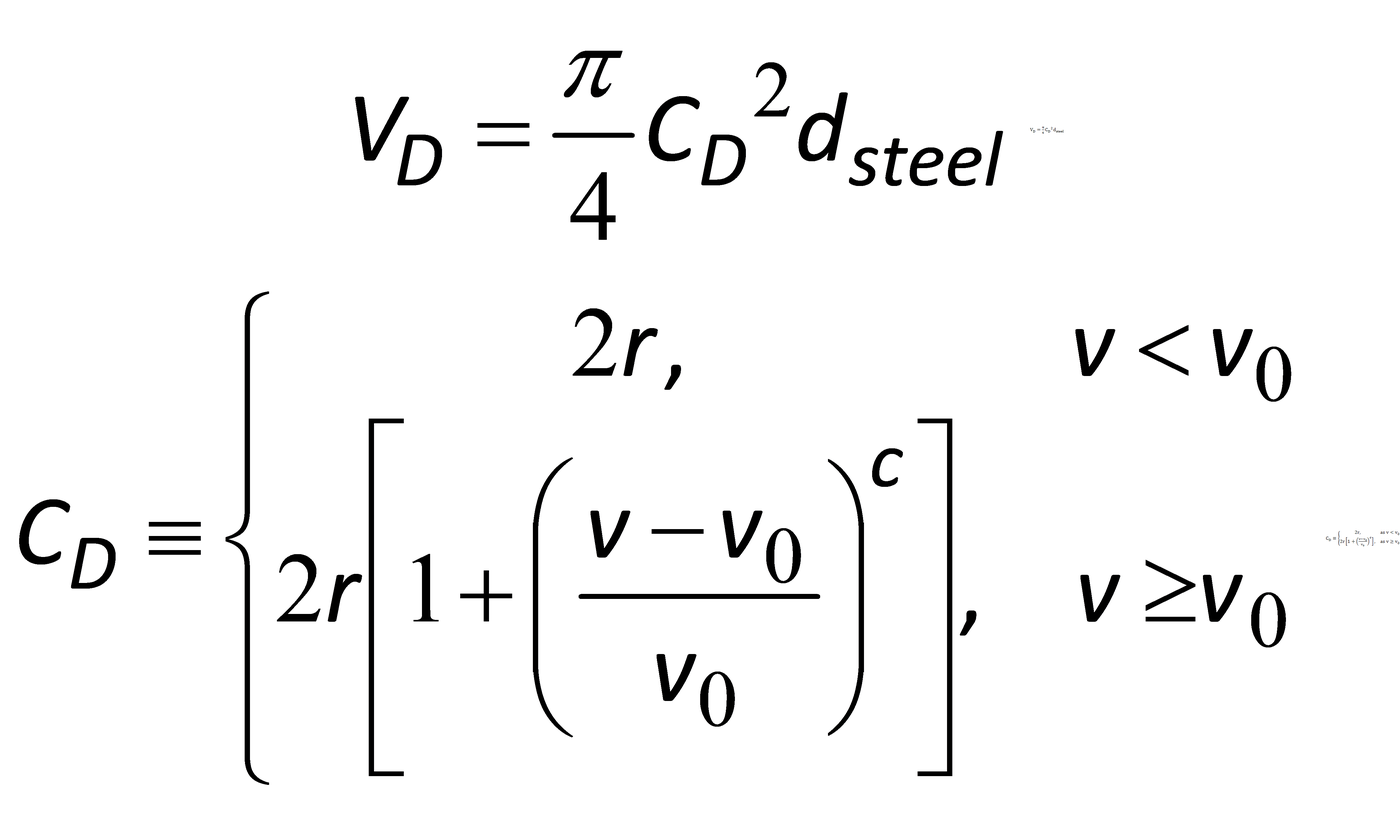
where and are the thickness of the plastic shell and reduced thickness adjusted according to density ratio of plastic over steel. On the other hand, damage volume is calculated by:
where r is radius of a projectile and CD is an effective diameter of a hole caused by the projectile. The coefficient c is a constant to be determined from experiments, but it is now irrelevant for impact velocities considered. Figure 3 shows the estimated Pcd/h curve for the ISS. The points are values estimated from the experiment data and the solid line is the Boltzmann fit curve of the data.
Simulation types
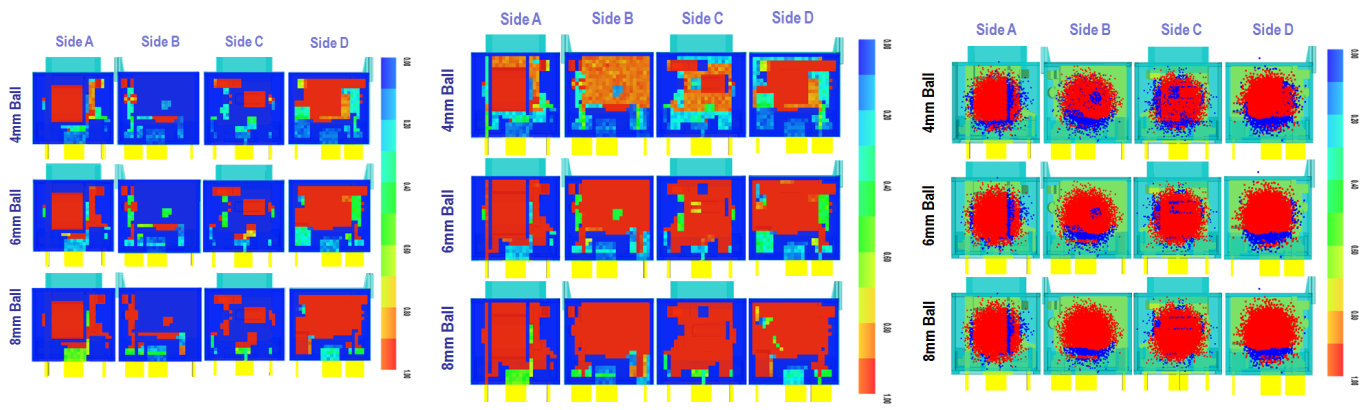
Three different simulations are conducted. The first is a vulnerability simulation performed with the setup developed by Hartmann et al [5]. The second is also a vulnerability simulation done treating the ISS as being critical. The last one is a lethality simulation done with the same setup with the second. In vulnerability simulations, the V/L code generates 26×23 grids of 1×1 mm2 on each face and 100 random shot lines evenly in each grid, and so hit points are evenly distributed all over impact faces. For each shot line, the code finds whether the relay is killed or not. Probability of kill is calculated for each grid as the proportion of shots disabling the relay, and averaged over all grids for a given set of parameters. In lethality simulation, an aim point is located at the centre of each impact face, and hit points are distributed around the aim point according to a Gaussian normal distribution. Ten thousand shots are simulated on each face and the kill probability is calculated as the proportion of shots disabling the relay. Figure 4 shows graphical results of the three simulations for impacts of 5V50. Here red grids or points represent shot lines hitting and killing critical subcomponents, while blue ones represent shot lines missing or which fail to kill them.
Simulation results
The first simulation
In this simulation, the ISS is not regarded as a critical component, but a structural component. So it is not included in the fault tree and is excluded from the evaluation of the target status. Figure 5 presents kill probability curves for all impact velocities and projectiles, and averaged kill probability curves as functions of momentum and kinetic energy. These results show that the relay is much less vulnerable for impacts on sides B and C than for impacts on sides A and D even at velocities above 5V50 contrary to the experiment results. It is also clear from Figure 4(a).
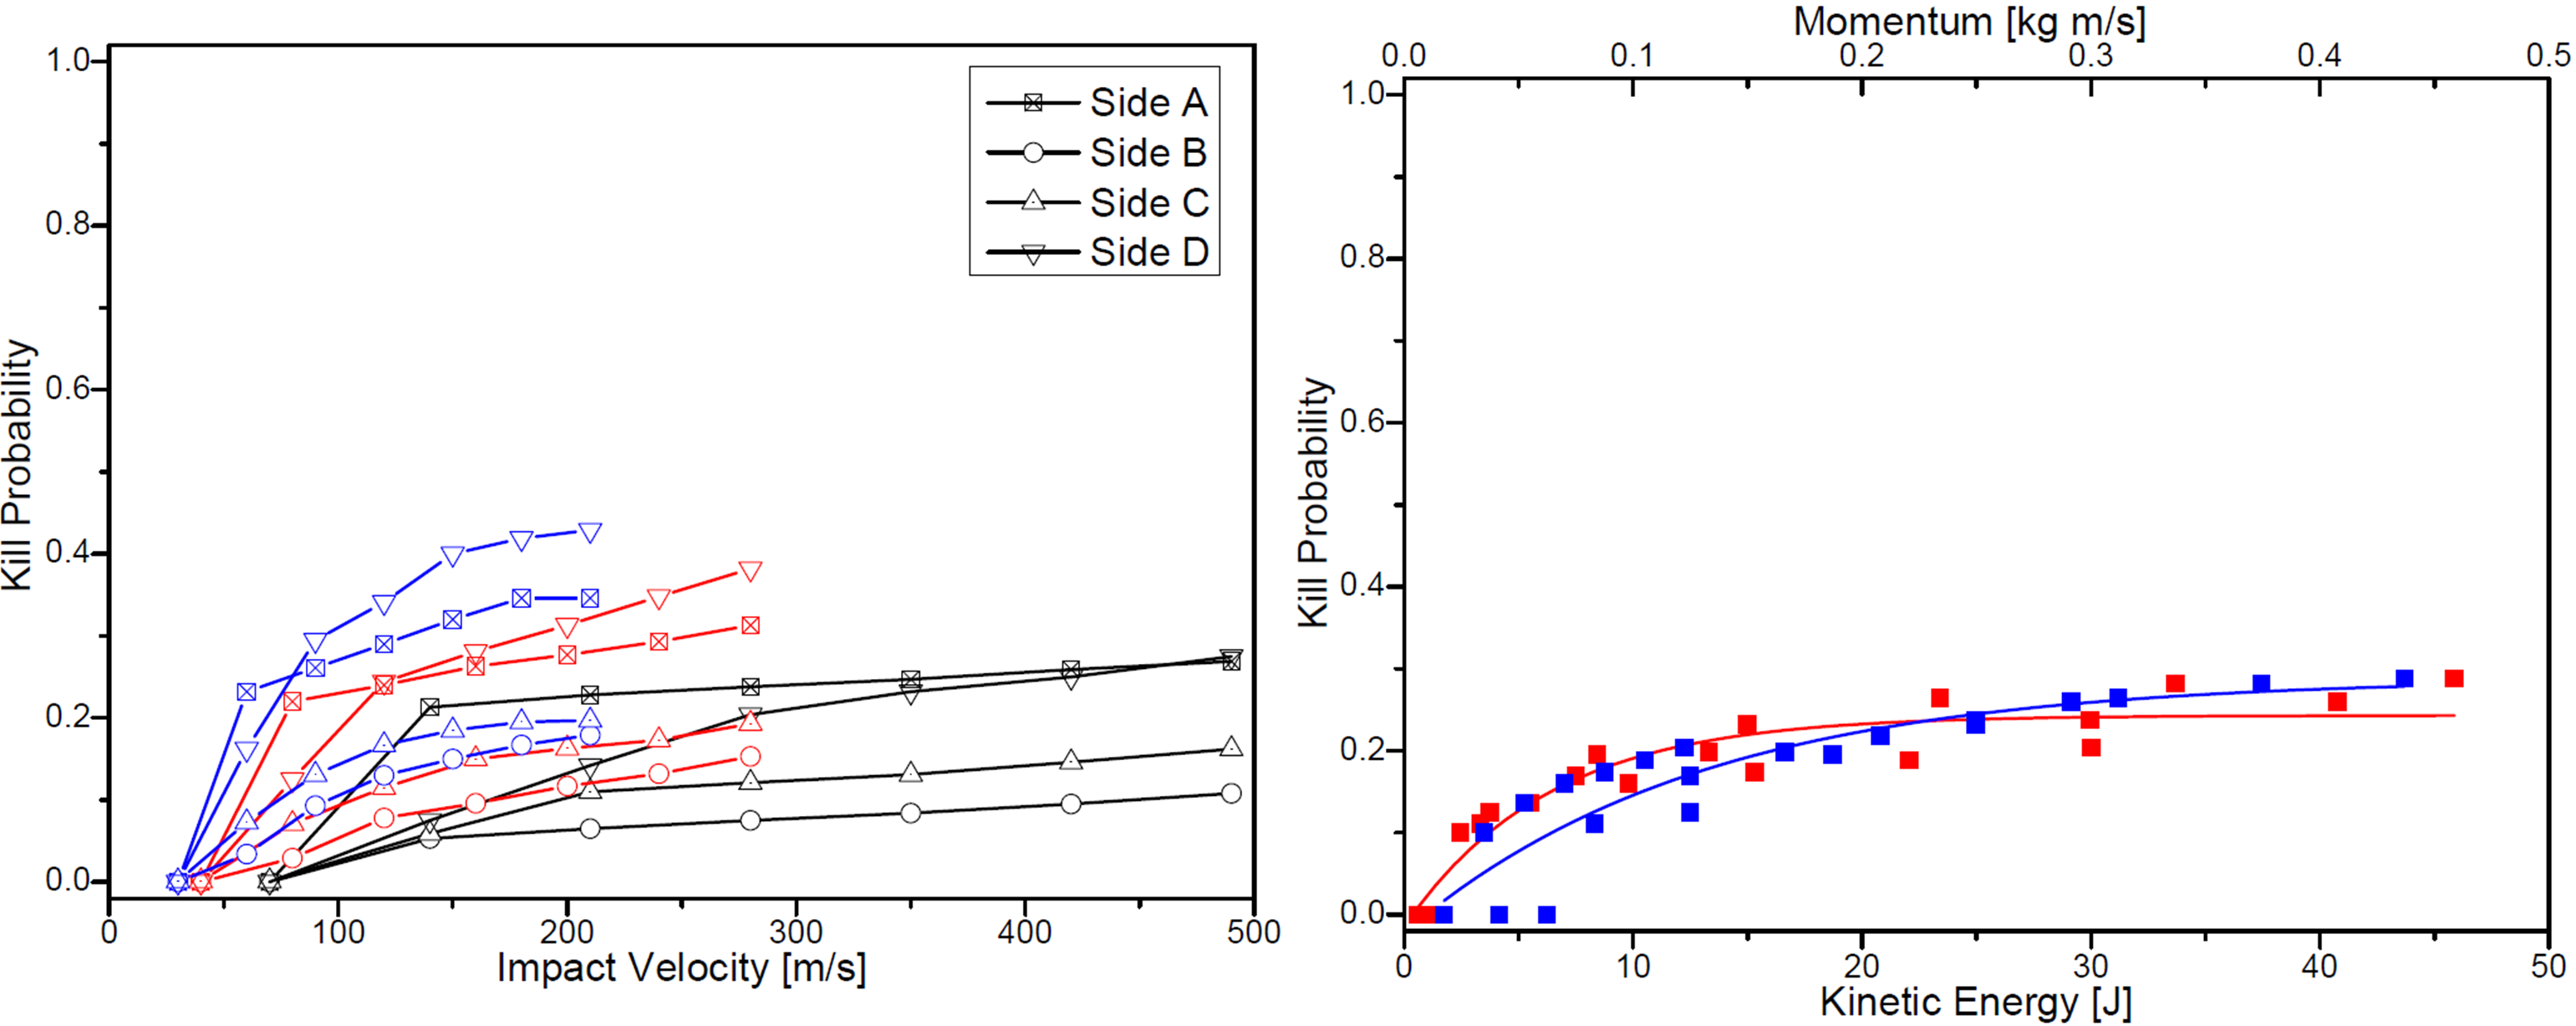
Moreover, the averaged kill probabilities are at most 30% even at highest momentum or kinetic energy, and also they are much less than the experiment results. The reason why kill probabilities for impacts on sides B and C stay relatively low unlike in the experiment is due to way treating the ISS in this simulation. Here the ISS is simply treated as a structural component. It is not damaged by the impacts, but simply perforated by projectiles. When projectiles hit sides B and C, it protects critical components inside until projectiles fully perforate it. It is thick enough so that it is not perforated by projectiles impacting with velocities considered in the experiment and simulations as discussed previously.
The second simulation
In this simulation, the ISS is introduced as a critical subcomponent with Pcd/h estimated in the previous section. Figure 4(b) and Figure 6 are results of this simulation. Explicitly the relay is now vulnerable to impacts on sides B and C as much as on sides A and D for impact velocities above 5V50. Here, over all kill probabilities are about 60%, and they are still considerably less than the experiment results.
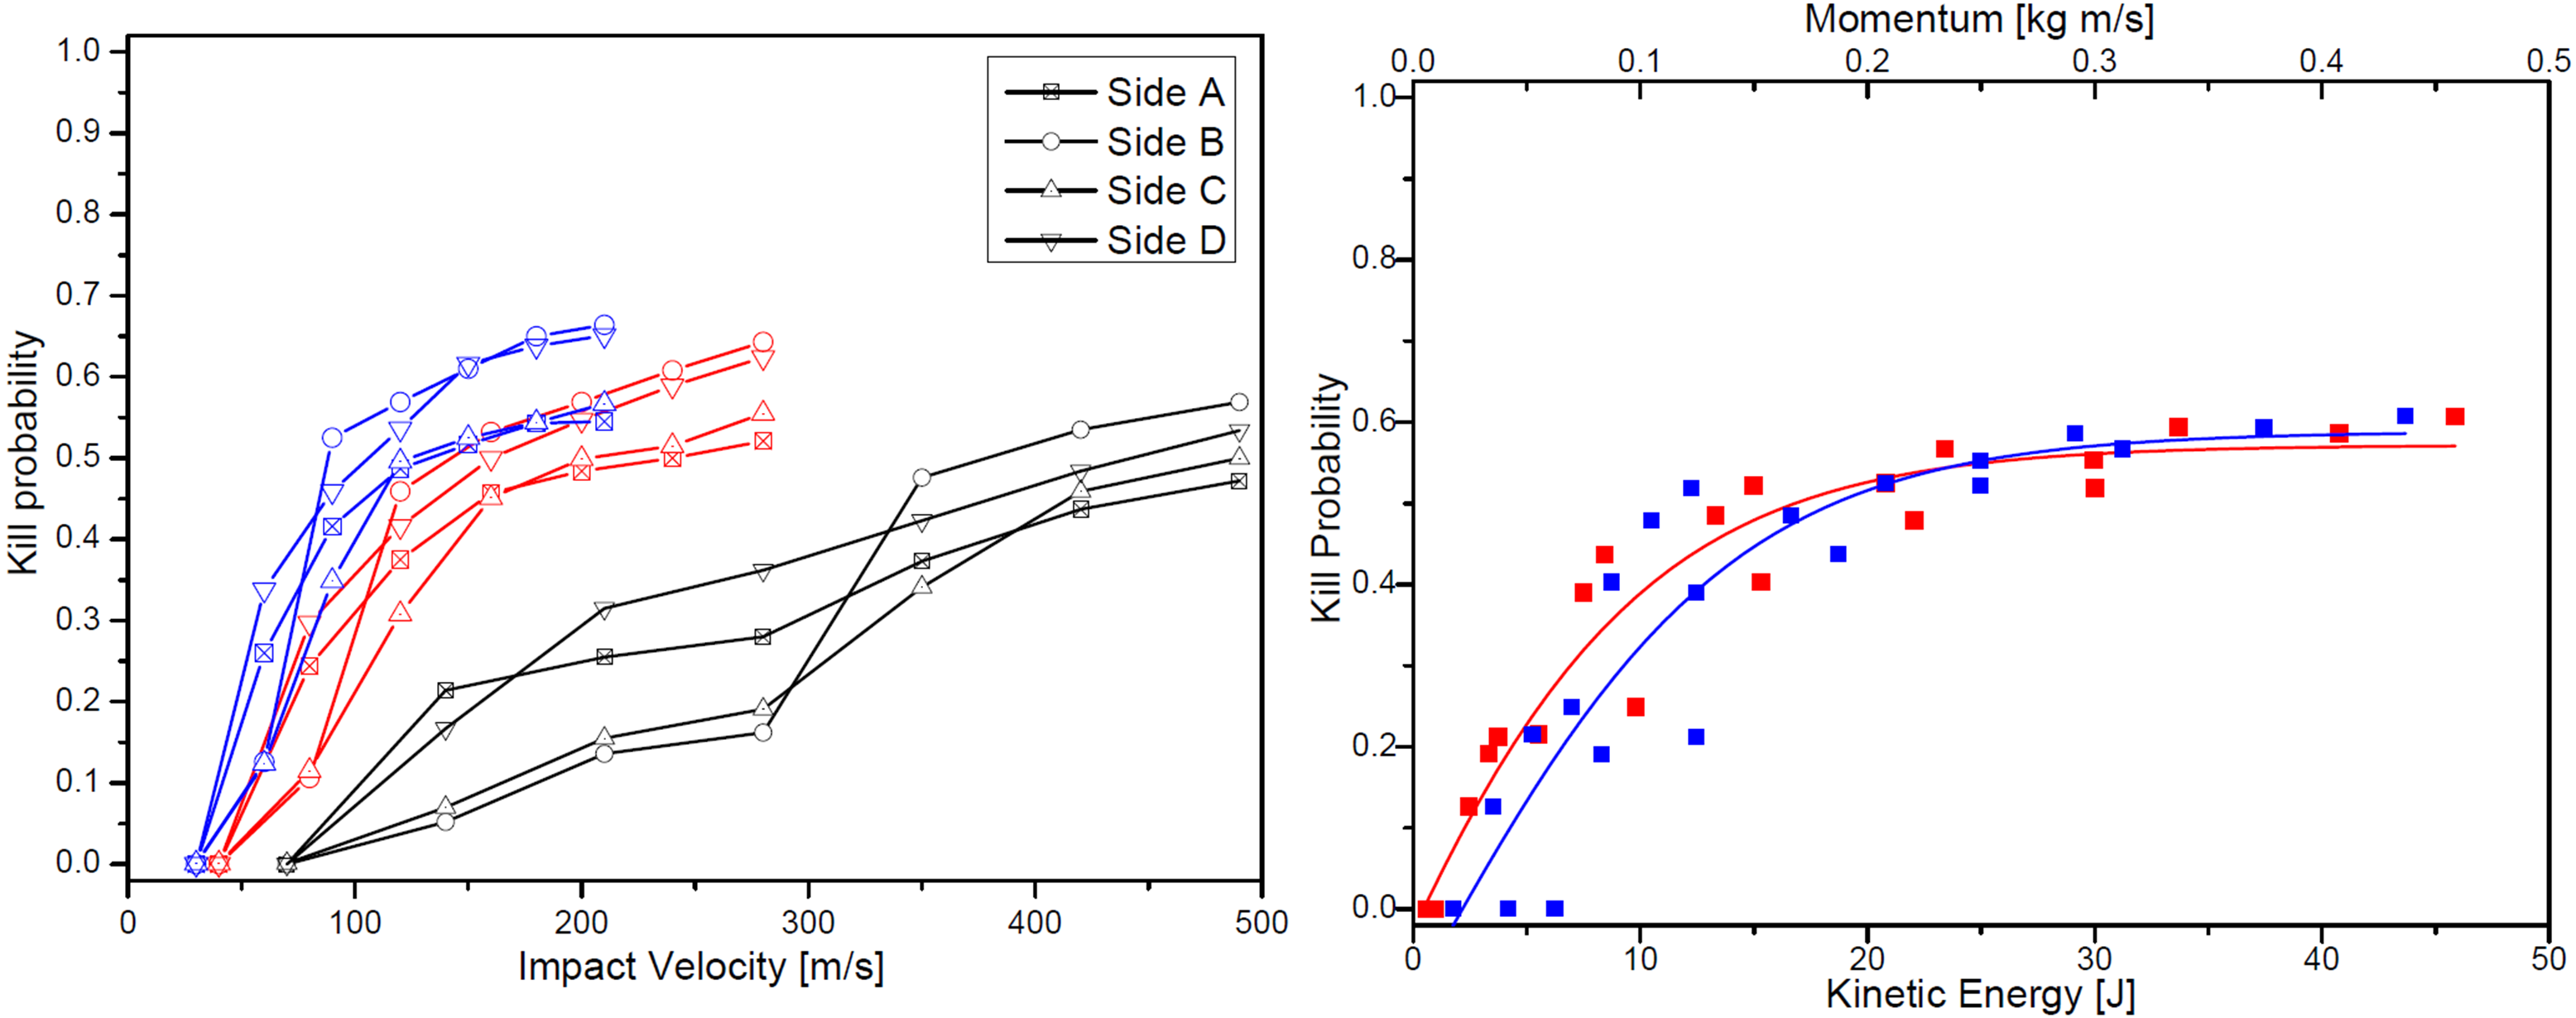
Two probable causes could be inferred for much lower kill probabilities in the second simulation than in the experimental study. The first possible reason is that damage process in V/L code simulation differs from the experiment as discussed in [5]. While shot lines in current V/L codes including AVAL have no thickness, the physical projectiles have somewhat large sizes compared to components and empty volumes between them. The physical projectiles could hit and damage components even when the corresponding shot lines miss the component. Because of this, the kill probabilities tend to be underestimated in V/L code simulations than in the experiments. The effect of projectile size can be simply inferred. Since the area of each face is 575 mm2 and the largest average kill probability was about 0.6 in the second simulation, the vulnerable area of each face is about 345 mm2 and it corresponds to the area of 18.6×18.6 mm2.
(a)
(b)
(c)
(a)
(b)
(a)
(b)
If the relay is killed even when the projectiles slightly graze critical subcomponents, the vulnerable area will be increased to 510.8 mm2 for 8 mm projectiles, which corresponds to a kill probability of 0.89. Since the vulnerable area has more complex shape than square, the kill probability must be larger than these in rigorous calculation. Therefore, it may be possible to explain the discrepancy between results from the second simulation and the experiment with the size effect of projectiles. However, any rigorous calculation of the size effect is not possible right now, because current V/L simulation codes don’t account for the size of a projectile in making judgment on hitting or missing components.
The third simulation
The second possible reason is the possibility that hit points were concentrated near the centre of faces in the experiment. In that case, kill probabilities resulted from the experiment should be much higher than the vulnerability simulation results. Since most critical components of the relay are located around the centre of the relay, projectiles hardly miss them. On the other hand, in vulnerability simulations, hit points are uniformly distributed over the impact face and many shot lines pass by outer empty region missing critical components. As mentioned earlier, it was assumed that hit points are evenly distributed over a face in the experiment [4]. They couldn’t make manually aim points evenly cover a face, and every shot hit the relay without missing it. This fact implies that if hit points follow the normal distribution, most of hits must have been concentrated close to the centre of a face. They shot a total of 160 shots without missing the target. This means three times the standard deviation of the hit distribution should be less than 12 mm which is half of one side of a face and at least 86% of shots should hit within an 8 mm radius from the centre.
In this lethality simulation, it is assumed that hit points follow a normal distribution centred at the centre of a face with standard deviation of 3 mm. Ten thousand shots for each face were simulated. Figure 4(c) shows a graphical result for impact velocity of 5V50 of the lethality simulation. Explicitly, there are a large proportion of red points. Figure 7 shows that kill probability curves look quite close to those resulted from the experiment. If the standard deviation was set to be 2 mm rather than 3 mm, then the curves must have been closer to the experiment result.
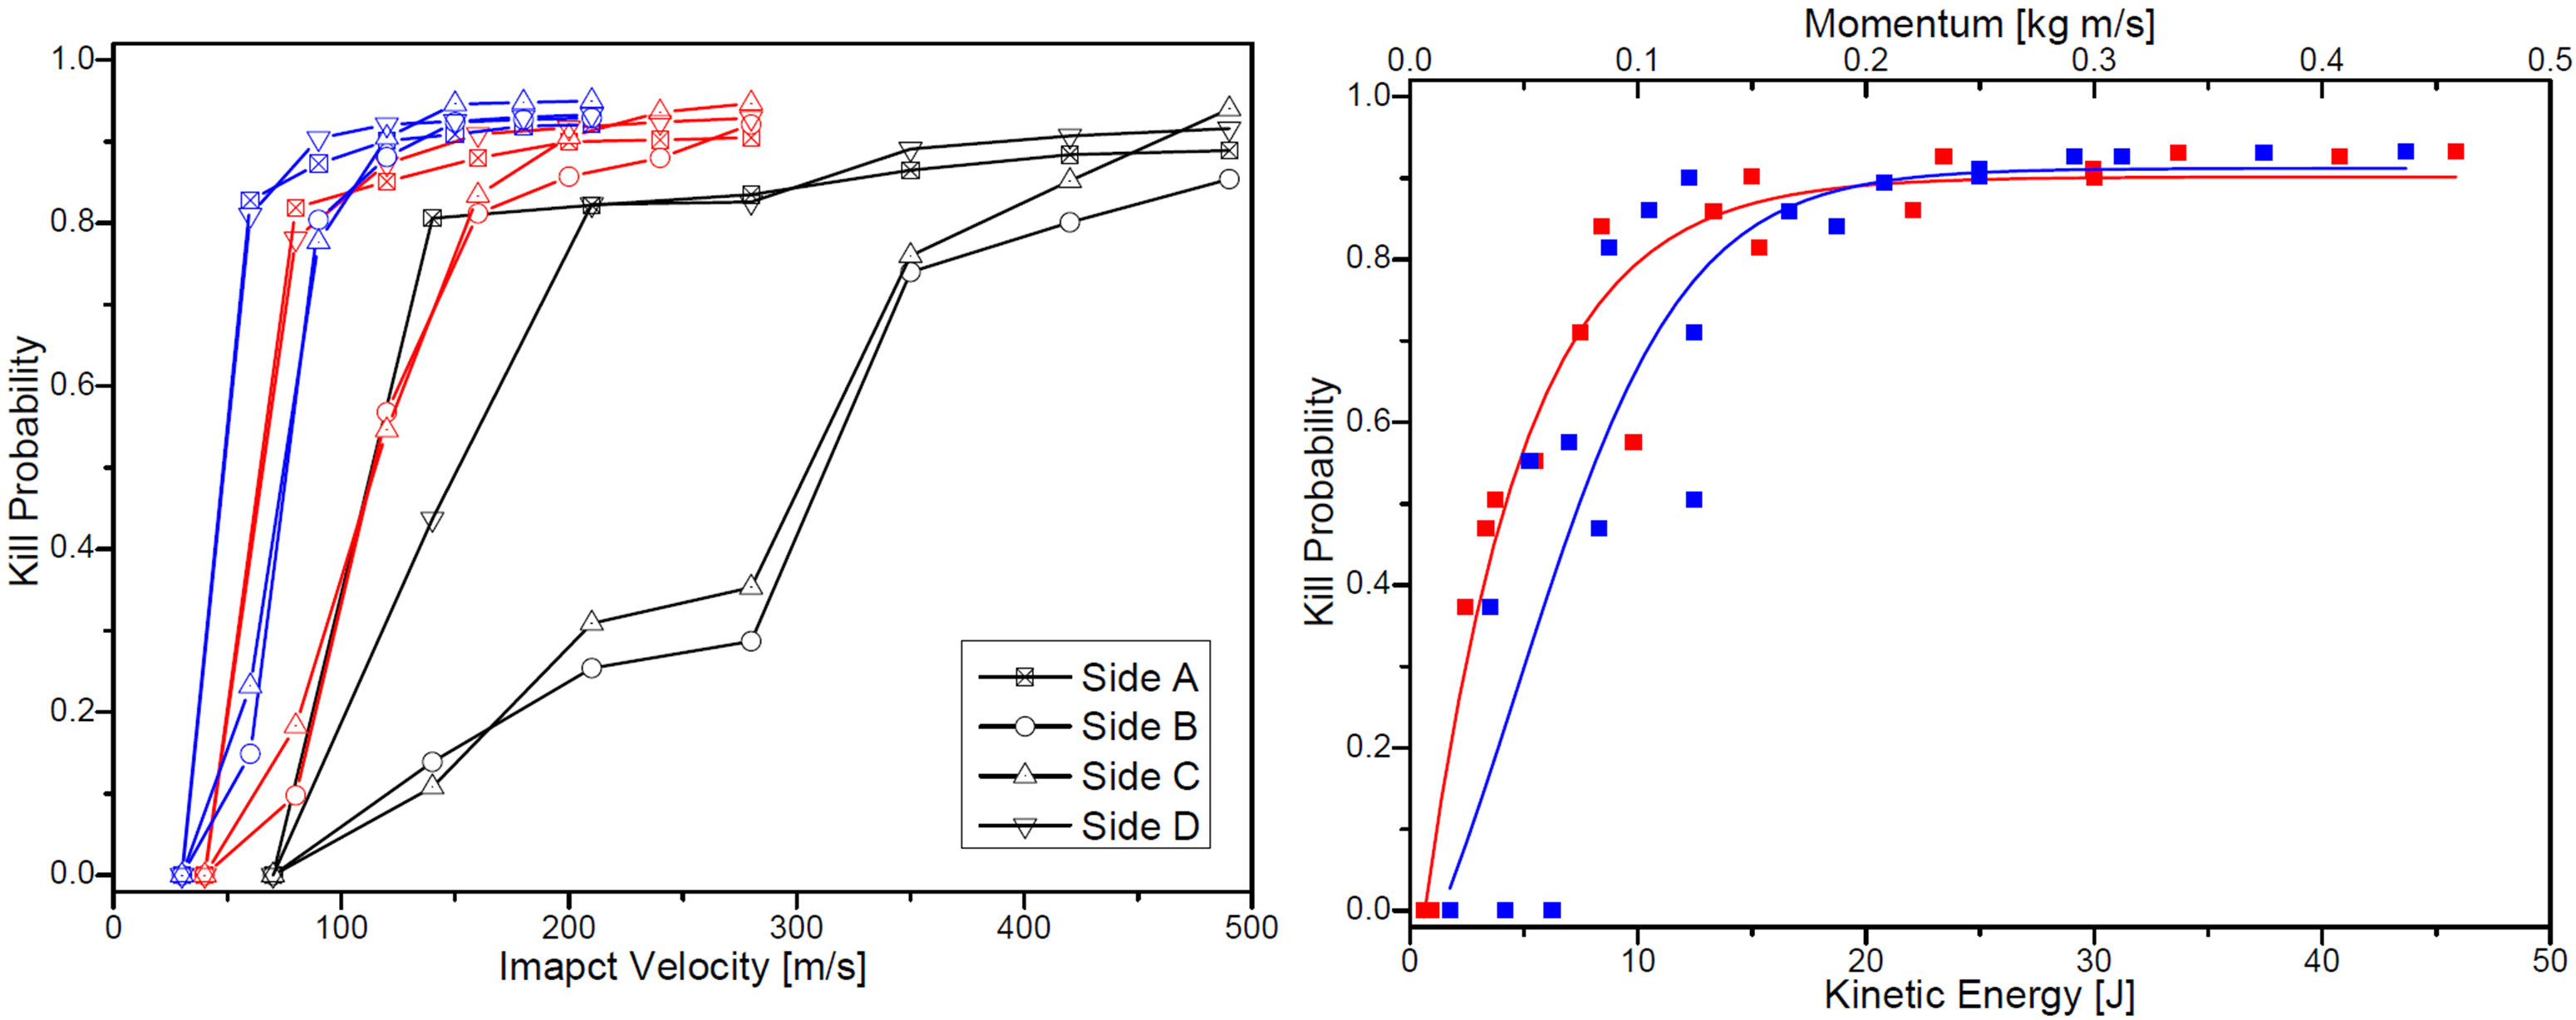
This result says that the big discrepancy between the experiment and the second simulation results can arise from the concentration of hit points in the experiment. If this is true, then the kill probability obtained from the experiment cannot be interpreted as component Pcd/h. By definition, a component Pcd/h is a conditional probability of kill given a hit. To assess the component Pcd/h, the hit points should be evenly distributed over a cross sectional area perpendicular to a firing direction and the resulting kill probabilities for all firing directions should be averaged. In this respect, the experiment results simply represent kill probabilities of the relay attacked by projectiles aimed to the centre of its face.
(a)
(b)
Discussion and conclusion
Three different V/L code simulations have been performed to develop component Pcd/h of the electric relay employed for the experimental study [4]. The kill probabilities resulted from the first simulation done with the setup developed by Hartmann et al [5] were much lower than the experiment results, and were different from the experiment results in that the relay was considerably less vulnerable for impacts on sides B and C than on sides A and D even at velocities over 5V50. In the second simulation, the latter difference could be cured by regarding ISS as a critical subcomponent, but the overall probabilities were still much less than the experiment results. This low kill probability may come from neglecting the size effect of projectiles as previously discussed. In fact the work in [8] was focused on ray-tracing problem and used a bundle of rays to represent the true size of the projectile and to increase the hit probability on the critical components. This idea worked well and improved much the simulation results of the same relay. On the other hand, the possibility that hit points were concentrated near the centre of faces in the experiment was considered in this paper and was reflected for the third simulation of which results were very close to the experiment results. It will be interesting to do further study to see which one works better in general.
Then, it is natural to ask which one among results of the three simulations and the experiment is correct component Pcd/h. One may think the experiment result is the best estimation of component Pcd/h for the relay. It cannot be so, because the hit points must have been concentrated around the centre of the faces in the experiment as discussed in previous sections. On the other hand, if the last lethality simulation correctly re-enacted the experiment, both the results of last simulation and experiment cannot be correct component Pcd/h because both are not the conditional probability of kill given a hit. Rather, the kill probabilities resulted from the second vulnerability simulation should be regarded as component Pcd/h, because it uses the same setup with the last one which correctly reproduced the experiment and gives correct conditional probability of kill given a hit.
In conclusion, discussions presented in this paper suggest that the simulation and experimental methods should be complementarily used for development of Pcd/h for a target component. This is because it is nearly impossible to conduct extensive experiments on a component unless the component is cheap enough and available. Even in case such conditions are met, it is really hard to cover all conditions to be encountered and to perform right experiments to obtain valid component Pcd/h due to limitations on experimental setups. Consequently, one can experimentally produce only sparse and discrete points for development of component Pcd/h. On the other hand, any simulation method should be validated against experiment results. In general, not too much data is needed to validate simulation methods, while they can be used in order to fill the gap between the discrete points in the experimental data. Moreover, it is not necessary anymore to prepare such a strict experimental setup and to conduct experiments so accurately, because simulation setups can be validated with somewhat deficient experimental data when we sufficiently understand the experimental setup. After that one can produce correct component Pcd/h by simulating impact tests repeatedly.
Note added
This work is based on the preliminary study of [7]. Since the seminar, many corrections have been made on simulation setups, numerous simulations repeated, and a few concepts clarified.
Acknowledgement
Special thanks go to M.G. Hartmann of FOI (Swedish Defense Research Agency) for sharing his geometric model of the relay and for many valuable discussions on his experiment results and his simulation setup.
References
[1] K.M. Yerdon, “The Analytical Treatment of Composite Materials in Aircraft Ballistic Vulnerability Assessments”, American Institute of Aeronautics and Astronautics, AIAA-95-1419-CP, pp. 2156–2164, 1995.
[2] F. Gavril, “A Synthesis of Methods for Simulating Vulnerability of Armored Vehicles”, Naval Research Logistics, Vol. 42, pp. 247–265, 1995.
[3] G.L. Durfee, R.E. Kinsler, and W.F. Braerman, Sensitivity Analysis of the PKHDOC Component Vulnerability Methodology, Ballistic Research Laboratory, Memorandum Report ARBRL-MR-02995, 1980.
[4] M.G. Hartmann and P.E. Magnusson, “Component Impact Kill Criteria – An Experimental Study,” Journal of Battlefield Technology, Vol. 13, No. 2, pp. 13–18, 2010.
[5] M.G. Hartmann and P.E. Magnusson, “Component Penetration Kill Criteria Simulations”, Journal of Battlefield Technology, Vol. 15, No. 3, pp. 1–6, 2012.
[6] Swedish Defence Research Agency, AVAL Reference Manual 6.7.04, 26 March 2010.
[7] S-H. Moon, “Comparison of Component Kill Criteria from an Experimental Study and a V/L code Simulation”, Proceedings of 12th US/ROK Munitions Effectiveness Seminar, 12–13 April 2010, Seoul, Korea, pp. 99–112.
[8] M.G. Hartmann and P.E. Magnusson, “Improved Component Impact Kill Criteria Simulations”, 27th International Symposium on Ballistics, 22–26 April 2013, Freiburg, Germany, pp. 536–546.