
Volume 17, Number 2, July 2014
Modelling The Impact Of Technologies And Systems On Military Capabilities
- 1 Finnish Defence Research Agency, PO Box 10, FI- 11311, RIIHIMÄKI, Finland, Tykkikentäntie 1.
Abstract
Capabilities are commonly used in planning and modelling of military power. In this work we introduce a method for modelling the impact of future technologies and new systems on capabilities. Based on probability theory, a mathematically tractable definition of capability is given. The model relates the capability of a system to the capability area (such as situational awareness, for example). We show how to “drill down” from high level capabilities into system capabilities. Relationships between different parts of the system of systems are defined in a quantified manner. The modelling method is demonstrated with data from a questionnaire where changes of capabilities were evaluated.
Introduction
Military capabilities have been characterized by qualitative and quantitative terms. Measuring military capability and the difficulty of quantifying military capability in a single, definite measure has been discussed over the years [1-6]. In this paper we present a probabilistic model and propose a quantitative definition of capability.
The concept of capability has been used to express the level of will, amount of troops and armament. Combat capability is a generalized characteristic of the quantity and quality of forces and assets [7,8]. In the US the Joint Capability Areas (JCA) is a standardized set of definitions that cover the complete range of military activities [9]. Comparable standardization work has been completed in many countries [10,11]. The concept of capability can be extended outside the military context.
Capability is an abstract concept, not directly applicable to mathematical calculations. Here, we define the capability as the probability of a successful mission. The system capability measure is defined as the probability of successful system operation in a mission. The definition gives us the possibility to set numeric values to the capabilities. The definition is confined to the mission, later we use the term scenario, which gives all the necessary information needed for the evaluation of the probability value. For example, the time frame available for the mission has an effect on the probability of mission success. The probability of mission success as a measure of capability has its limitations. A single number does not describe details of assets and forces.
A problem in capability modelling is how to determine the relationship between the individual system capabilities and the higher level capability areas. Many attempts have been made by heuristic models where relations are described by weighting factors. Unclear definitions of terms and concepts can make the interpretation of the results difficult or infeasible. The relations between different capabilities are taken into account with the help of probabilistic relations. These definitions quantify the concept of capability and make the modelling possible.
Standardization of systems architecture framework is going on in NATO and several other organizations. Architecture frameworks offer us the connection between capabilities, systems and technologies. The level of detail in the model is left to the modeller to decide on the grounds of the requirements and the available input data. System of systems engineering is an integral method in the modelling [5,6]. One proposed definition of system of systems is “Modern systems that comprise system of systems are not monolithic, rather they have five common characteristics: operational independence of the individual systems, managerial independence of the systems, geographical distribution, emergent behavior and evolutionary development.” [12,13]
We present a generic method that can be extended according to the specific needs of the modelling. The method allows modelling a limited set of systems and technologies. It is possible to use the method to high level capabilities when only one level of hierarchy below the main capability areas is considered. This kind of modelling can provide a tool for understanding the “big picture” of the capability structure. The high level model can further be extended to lower levels of system hierarchy and desired details of the model.
Not the entire defense system and its complexities need to be included. Trying to model a large complex system can lead to a black box where dependencies between the systems are not tractable. In our method the systems are modelled as separate building blocks. The problem is divided into manageable entities where the modelling is encapsulated in the system of systems philosophy. The dependencies between systems and components are modelled with well-known probabilistic concepts without ad hoc parameters.
Quantifying the concept of capability enables us to make a novel approach to the problem. It may be easier for experts to evaluate the overall capability change of capability areas induced by a new system or technology than to evaluate the capability change of the individual system itself [14]. There is a side effect that in addition to the technological change also tactical or other improvements in the environment may occur at the time. At first glance, this seems to be a drawback, but after all, the military is interested in the capability areas values, to pinpoint the original cause is of secondary interest to the officers. Because of the interrelationships, evaluation of the individual systems capabilities alone, without taking into account other changes, is difficult or even impossible.
Principles of the model
Our study is not restricted by a particular specification of capability hierarchy or even the concept of capability. We can map the effects of system development to any set of entities. For example, alternative entities for modelling military readiness and feasibility have been presented in [13].
In our study, we conducted a questionnaire where changes in the most important capability areas were evaluated as a result of deploying a new system or a set of systems. The following capability areas have been selected for the study: protection, awareness and engagement. Because we have a quantitative model, we can calculate the changes of individual system capabilities by reverse-engineering. The system capability values include also other changes in the environment, e.g. better tactics or procedures. These may or may not be directly connected with the deployment of new systems or technologies. As we said before, it is difficult to separate the causes. If desired, the method still has the option to model tactics as a separate virtual system.
Different combinations of systems and disposal of old systems can be calculated with the model. Alternative defense systems can be compared to maximize the capability and to minimize the costs. The common situation is that several systems contribute to the same capabilities. In this way, the systems are alternatives to perform the same mission functionalities. In military conflicts to maximize the impact, or the probability of success, the systems are applied as complementary resources of capability.
The systems are used in parallel to back up each other. When the systems are both functioning, one of the two systems gives no additional capability. From probability theory the formula for the probability of union of events, that are not necessarily mutually exclusive, is used in the model.
In addition, our goal is to forecast the effects of technology changes on capabilities in time scale when only the development of the technologies is known. This is possible because we have the relationship of technologies to system capabilities and the relationship of system capabilities to capability areas. The reliability of the calculation depends on the level of details in the model and the accuracy of the input parameters.
In this work we combine capabilities, architectures and system of systems ideas with mathematical probability models [15,16]. Mathematical ideas of reliability and graph theory [17] can be utilized in the modelling.
Mathematical modelling of military capabilities
We use basic probability theory and ideas of system of systems for constructing the model. According to the definition of system of systems cited earlier in this paper, the capability areas can be modelled separately. We apply the model for three capability areas: protection, awareness and engagement and two systems: satellites (SAT) and unmanned aerial vehicles (UAV). In the questionnaire the initial capability values were given for the three scenarios. The capabilities, i.e. the probabilities of mission success, were evaluated for 1 year and 10 years of technological development by the respondents.
Despite the fact that the capabilities can be modelled separately, this does not preclude that they can depend on the same variables while at the same time the capabilities may be statistically independent. In fact, the simplest assumption is that the total capability is the product of the capability areas values. In other words, they are considered as serial systems. On the lower hierarchical levels, the systems may be in series or in parallel. In the most natural arrangement the satellites, the UAVs and the parallel systems are in parallel. Each one of these systems performs the same functionalities on a capability area but with different capability values. In this paper we call the system of systems k in Figure 1 the parallel system. The parallel system can be a land, naval or airborne system or a combination.

We know that satellites and UAVs have functionalities that are not in parallel, for example satellites do not have the firing capability against ground objects. However, satellites can create considerable engagement capability by providing target acquisition. We have two points here. Target acquisition may be defined as a part of awareness or engagement capability area. The total capability value does not depend on the specification. The second point is that better awareness enables the engagement and the protection functionalities which induce additional capability improvement. The capability areas are related in a complex manner. In evaluations and calculations the capabilities of functionalities must be taken into account once, and only once. If the functionalities in the capability areas specification do not overlap and cover the whole range, no problems in assigning the capability values correctly will occur.
In our model we have the satellite system, the UAV system, the parallel system and the auxiliary system in the scenario. The parallel system has, by definition, the same functionalities as the satellite and the UAV systems. The auxiliary system has the functionalities of the capability area which are not included in the parallel system of systems of the satellites, the UAVs and the parallel system in the scenario. We denote the system capabilities of the satellites, the UAVs, the parallel system and the auxiliary system X1, X2, Xk, and Xm, correspondingly (Figure 1).
The probability values P1, P2, and P12 for the satellites, the UAVs and the combination correspondingly are from the questionnaire data. The initial probability values P0 are known. The probability values X1, X2, Xk, and Xm are calculated from the model in Figure 1. The model provides the connection between capability areas and systems, i.e. the mapping from P0, P1, P2, and P12 to X1, X2, Xk, and Xm.
From basic probability theory we get the following equations:
In the first equation no satellites and no UAVs are available. In the second and third equations the satellites or the UAVs are in use and in the last equation both the satellites and the UAVs are in use. The initial capability P0 consists of Xk and Xm. The graph in Figure 1 illustrates the arrangement.
Equations (1–4) represent one capability area in one scenario at time T. In Equations (1–4) the variables P0, P1, P2, and P12 are known and the variables X1, X2, Xk, and Xm are unknown. Expressing the capabilities with the help of the initial capability P0 = p0 and the capability changes p1, p2, and p12 we have, P1 = p0 + p1 , P2 = p0 + p2 and P12 = p0 + p12. From Equations (1–4) we get:
Equations (5) and (6) do not depend on p0 which is a feature of the model in Figure 1. It is intuitive that the system capabilities do not depend on the outside environment of the systems. The idea of Equations (5–8) is to factor out the dependency on systems and on scenarios more explicitly. This makes the model extendable with combining additional systems with the satellite and the UAV systems. New systems are inserted in parallel or in series depending on the system functionalities.
Another consequence is that it is not necessary to investigate every pair of large number of systems. It is enough to find out all the system capability values Xi of the model. The values can be evaluated from experts’ views or by simulation and modelling.
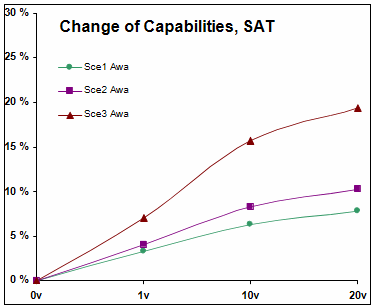
The value p0 depends a great deal of the scenario while the values p1, p2, and p12 depend less on the scenario. This can be seen from Table 1 or Figures 2a-c. The initial value p0 describes different positions of the opposing sides in the scenario. The capability changes p1, p2, and p12 describe the system capability changes in the scenario on the capability area level. The capabilities Xk and Xm. are dependent on p0 because they constitute the initial position of the scenario as stated in Equation (1).
Equations (5-8) are used separately for all the cases in our study: three scenarios and four time frames. The same form of the equations is used for the protection, the awareness and the engagement capability areas. The total capability value is calculated from the equation:
The results from Equation (9) for the scenarios, systems and time frames are shown in Table 2. The combination of the satellites and the UAVs is calculated from Equation (9) with the values of P12 .
Equation (9) follows from the assumption of statistical independence. This is a consequence of the fact that the capability areas are defined according to the normalization principles of the traditional data modelling practice where no overlapping of concepts is allowed. The same idea is inherited from the definitions of the capability areas to the system level functionalities. The assumption of statistical independency and the interdependency of capabilities are two different and coexistent properties of our modeling problem. In our approach the exact form of the dependence between the capability values or between the system capability values is not needed. Defining the necessary variables and the subsequent modelling would be difficult and dependency on tactics and other non-materiel conditions makes the task even harder.
The capability values X1, X2, and Xk of the three systems are solved assuming that they are operating in parallel. Corresponding procedures work for different combinations of serial and parallel systems. The method allows different serial - parallel models for every capability area. Different models follow from different functionalities of a system in the capability areas. In our study, the arrangement in Figure 1 is assumed to be the best first degree modelling structure for the three capability areas.
The questionnaire data
We demonstrate the method with an example. The questionnaire among ten people was performed in the International What If? workshop in January 2014 [18]. Half of the group were officers and the other half civilian. None of them were expert in the new systems under consideration. Scarce background information was given and there was very limited time to prepare for the questionnaire. The numerical results may not be valid for decision-making purposes. However, the data is sufficient for studying the modelling problem.
Technological development of two systems was evaluated in three scenarios for immediate deployment and within a time frame of ten years. For the immediate deployment, one year was allowed for procurement, training and planning. The system candidates were the satellites and the UAVs. The combined use of the satellites and the UAVs was evaluated in the same way. The number and the exact type of satellites and UAVs were not given beforehand and the respondents had to specify these facts eligible for the scenarios. The capability estimations for three capability areas were asked. In the scenarios these three capability areas are assumed to be the most important, but for the modelling of complete defense system capability, all the capability areas should be included in the model.
The respondents had no information about the model of Figure 1 or Equations (1–8). Nevertheless the respondents evaluated the capability values of the defense system that included other systems and tactics of the scenarios.
In the beginning (T = 0) in Scenario 1 the two sides have equal capabilities, in Scenario 2 the adversary has superior capacity and in Scenario 3 is the same as Scenario 2 but from civilian authorities’ point of view. In the questionnaire, effects of UAVs and satellites will be analyzed from the BLUE perspective. BLUE side does not have any satellite or UAV assets but, as in Scenarios 2 and 3 for example, the RED nation has both satellites and even UAVs with attack capability. In the first scenario the main mission of the BLUE side is to take control over the RED island in order to build radar and missile launch systems to the island. There is a number of sea-, air- and land-based capabilities available for both BLUE and RED nations. In Scenarios 2 and 3, RED as a military superpower has conducted limited air-operations against BLUE air defense and harbors. Missions of the BLUE side are to defend areal integrity, to protect critical infrastructure and population and to keep sea lines open to ensure trade traffic. RED has control over its area and partially the BLUE’s airspace. In Scenario 3, BLUE nation is responsible of the security of civilians in spite of RED nation’s hostile actions. The three scenarios have been described in more detail in [15,19].
In the questionnaires individual opinions affect the values given for the probability values. An objective approach would be calculating the corresponding probabilities by using simulation tools or by applying other mathematical models. On the other hand, the results can be taken as describing subjective probabilities. We omit the human behaviour considerations in the questionnaire and keep in mind the limitations of interpreting the results strictly as the probability of mission success.
In Table 1 the average capability changes in the questionnaire are shown. Note that the changes are asked at the level of capability areas, not for the separate satellite or the UAV systems. The initial values for the protection capabilities are 0.7, 0.5, and 0.5 for the Scenarios 1–3. The initial values for the awareness capabilities are 0.8, 0.6, and 0.4 and the initial values for the engagement capabilities are 0.9, 0.3, and 0.4. As an example in Scenario 1 after one year the awareness capability is 0.8 + 0.072 = 0.872 (87.2 %) when the satellites and the UAVs are in use.
All the results of this paper can be calculated from Equations (5-8) with the information given in Table 1 and the initial values.
In the model we have 57 parameters: pi , and pi,T,C,S where i={1, 2, 3}={SAT, UAV, SAT and UAV}, T={1 year, 10 years}, C={Protection, Awareness, Engagement} and S={Scenario 1, Scenario 2, Scenario 3}. With 57 parameters and 57 unknown variables we have merely changed variables so the model and the data match perfectly. The new variables X1, X2, Xk, and Xm describe the capabilities of individual systems i, not the capabilities Pi,T,C,S of the entire system of systems.
In the second part of the questionnaire the effects of the development within 10-year and 20-year timeframes in technology areas on a set of functionalities were asked. A list of five functionalities was used: surveillance, communication, engagement, logistics and deception. The functionalities considered are connected to specific capability areas. A selected list of seven technology areas was used: sensor technology, material technology, communications technology, stealth technology, energy source technology, manufacturing technology and autonomous operation technology. For our modelling purposes we assume that they represent the general trend of technology development in 10 and 20 years. These data are used to extrapolate the capability changes from 10 years to 20 years. All the results for 20 years in this paper are from the extrapolation calculation.
In Table 2 the average values of total capability values after 0, 1, 10, and 20 years are given. The values for 0 year have been given beforehand to the respondents. The values after 1, 10, and 20 years have been calculated from Equation (9). The values after 1 and 10 years have been calculated from the questionnaire data and the values after 20 years from the extrapolation.
| 1 year | 10 years | ||||||
|---|---|---|---|---|---|---|---|
| Sce1 | Sce2 | Sce3 | Sce1 | Sce2 | Sce3 | ||
| Prot | SAT | 0.030 | 0.048 | 0.034 | 0.055 | 0.082 | 0.077 |
| UAV | 0.042 | 0.035 | 0.043 | 0.076 | 0.100 | 0.085 | |
| both | 0.064 | 0.077 | 0.053 | 0.121 | 0.153 | 0.097 | |
| Awa | SAT | 0.033 | 0.040 | 0.071 | 0.063 | 0.083 | 0.157 |
| UAV | 0.061 | 0.068 | 0.089 | 0.085 | 0.123 | 0.173 | |
| both | 0.072 | 0.079 | 0.121 | 0.104 | 0.151 | 0.208 | |
| Eng | SAT | 0.002 | 0.033 | 0.018 | 0.016 | 0.096 | 0.036 |
| UAV | 0.006 | 0.060 | 0.044 | 0.024 | 0.168 | 0.110 | |
| both | 0.007 | 0.062 | 0.052 | 0.025 | 0.193 | 0.126 |
| SAT | UAV | SAT & UAV | |||||||
|---|---|---|---|---|---|---|---|---|---|
| Sce1 | Sce2 | Sce3 | Sce1 | Sce2 | Sce3 | Sce1 | Sce2 | Sce3 | |
| 0 y | 0.50 | 0.09 | 0.08 | 0.50 | 0.09 | 0.08 | 0.50 | 0.09 | 0.08 |
| 1 y | 0.55 | 0.12 | 0.11 | 0.58 | 0.13 | 0.12 | 0.60 | 0.14 | 0.13 |
| 10 y | 0.60 | 0.16 | 0.14 | 0.63 | 0.20 | 0.17 | 0.69 | 0.24 | 0.19 |
| 20 y | 0.62 | 0.19 | 0.16 | 0.67 | 0.26 | 0.21 | 0.74 | 0.32 | 0.24 |
Analysis of the data
The analysis in this study is confined to modeling issues, the military arguments of capability changes are only shortly described in this paper. Analysis of the qualitative aspects and textual comments given by the respondents of the questionnaire was conducted in [19].
Next, we try to find the most significant features of the data. We use an elementary method where we compare the values pi,T,C,S with the average values pi,T,S, pi,T,C, and pT,C,S where the average is taken over indexes C, S and i correspondingly. We say that if the capability value pi,T,C,S is 5% or more higher than the average value pi,T,S, the capability C with the indexes i, T, S has increased significantly. We make the following observations: In Scenario 3 awareness is 7–13% more than the average after one and ten years and in Scenario 2 engagement is 9% more than the average after 10 years with the UAVs. In Scenario 3 engagement is 11% less than the average after 10 years with the satellites and with both the satellites and the UAVs. We have proceeded in this manner and collected the results of the analysis in Table 3. Other differences are less than 5% which are inside the error margins of the data.
In the following, because of the high number of dimensions of our study we analyze only the awareness capability area to demonstrate the value of the model. In Figures 2a–c and 3a–d the awareness capability changes and the system awareness capabilities in Scenarios 1–3 are shown. The analysis of the protection and the engineering capability areas can be performed in the same manner.
The most outstanding observation in Table 3 is the improvement in the awareness capability in Scenario 3 because this occurs when the satellites, the UAVs and both systems are in use after one and ten years. The first conclusion may be that both the satellites and the UAVs are the origin of the increase of the awareness capability values. However, from Figures 3 a–d we detect that this conclusion is incomplete. After one year the system capability of the satellites and the UAVs is moderate and the actual reason for the improved awareness capability is the increased capability of the auxiliary system as can be seen from the high value Xm – p0 in Figure 3d. We have subtracted the constant p0 from Xm to highlight the awareness capability in Scenario 3.
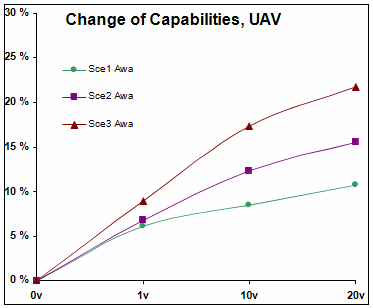
In Scenario 3 after ten years the awareness capabilities of the satellites and the UAVs increase and first conclusion is more correct but even then the auxiliary system capability has increased. As discussed earlier in the text, the satellites and the UAVs may act as enablers of functionalities in other systems. From Figure 3a we see that between 10 and 20 years the satellites give no more capability in Scenario 3 which is not obvious from Figure 2a.
The textual answers given by the respondents of the questionnaire validate the results based on the mathematical model of Equations (5–8). Some respondents stated that UAVs are mostly operated by the military and UAVs are not available in civilian operations. This is in good accordance with the model in Figure 3b because in 1 year the lowest capability given by the UAVs is in Scenario 3. Further from Figure 3b the utilization of the UAVs is increasing after 10 and 20 years in Scenario 3. Based on the questionnaire answers, some respondents recognized increased use of mini-UAVs at all levels of organizations’ within 10-year time frame in Scenario 3.
The value of capability given by the auxiliary system can be explained by traditional infrastructure and systems of situational awareness, such as telephones, e-mail and manned patrols. These are mostly ground or surface functionalities. Figure 3d shows that there is a good chance of developing and utilizing these systems in 10 and 20 years in Scenarios 2 and 3. Probably, in Figure 3c, the low capability values of the parallel system is due to the fact that manned air surveillance is not a good alternative for civilian operations. Satellites are not targets for enemy actions and they provide new capability especially for civilian use according to Figure 3a. After 10 years the satellites give no capability increase.
From line nine in Table 3 we see that in Scenario 1 the awareness capability is increasing less than average with the UAVs and with both the UAVs and the satellites between 1 and 10 years. We find the explanations from Figures 3a–d. The UAVs give no extra capability and the satellites and the auxiliary system give moderate capability increase. This changes are not obvious from Figures 2a–c. The textual answers confirm that the UAVs are not always available for civilian use as stated before.
These examples are enough to recognize the complex interrelations of the capabilities and the fact that it is difficult to find out the underlying reasons for the capability changes. Our model is a tool to decompose the system and delve into the structure of the defense system.
| 1 | C | pi={1,2,3},T={1y,10y},C=Awareness,S=3 | +7% … +13% |
|---|---|---|---|
| 2 | C | pi=2,T=10y,C=Engagement,S=2 | +9% |
| 3 | C | pi={1,3},T=10y,C=Engagement,S=3 | -11% |
| 4 | C | pi={2,3},T=10y,C=Protection,S=3 | -6% … -8% |
| 5 | C | pi=3,T=10y,C=Engagement,S=1 | -6% |
| 6 | C | pi=3,T=1y,C={Engagement},S={1,2,3} | -4% … -7% |
| 7 | S | pi={1,2,3},T=1y,C=Engagement,S=2 | +13% … +17% |
| 8 | S | pi={1,2,3},T=10y,C=Engagement,S=2 | +5% … +7% |
| 9 | S | pi={2,3},T=10y,C={Awareness,Engagement},S=1 | -5% … -9% |
| 10 | i | pi=3,T={1y,10y},C=Protection,S=2 | +5% |
| 11 | i | pi=1,T=10y,C=Engagement,S={2,3} | -11% … -12% |
| 12 | i | pi=3,T=10y,C=Engagement,S=2 | +7% |
On the other hand, we can start the analysis from Figures 3a–d. From Figure 3d we find that the auxiliary system capability value increases more in Scenario 2 than in Scenarios 1 and 3. In Scenario 2 the satellites, the UAVs and the parallel system give no extra capability. This can not be seen from Figures 2a –c.
Not all the explanations are found directly from the textual answers of the questionnaire. To demonstrate the use of the model we suggest the following explanations. Using manned helicopters or aeroplane are possible alternatives for air surveillance. This can explain the high values of Scenario 1 in Figure 3c. Developing traditional ground or surface infrastructure is not giving significant capability in Scenario 1 according to Figure 3d.
In all Scenarios 1–3 the capability of the parallel system is decreasing. The reason is that the UAVs and the satellites replace the functions of the parallel system. This cannot be seen from Figures 2a–c.
High values of Xm or Xk suggest modelling the auxiliary and the other existing systems in the scenario in more detail to raise the overall coverage of the model. In Figure 1 and Equations (7-8) the system content of m and k was unspecified. After modelling a new system or several systems in m or k, the corresponding capability changes are replace by the modelled set of systems.
High values of system capabilities may be brought about by numerical variability of the data. Low values of denominators of Equations (5–8) cause high sensitivity of the system capability values. Equation (1) determines the balance between Xm and Xk. This may be a reason for the unusual Scenario 1 engagement capability values of Xm and Xk. More analysis of the qualitative information gathered in the questionnaire or more accurate numerical data—that is, more respondents, is necessary to make the final conclusions in these cases.
Conclusions
A generic method of modelling military capabilities with probabilistic terms was presented. Capability was defined quantitatively as the probability of mission success.
Complex relations between systems’ capabilities and capability areas were described by the union of non-exclusive events of system pairs. The utilization of the rules of probability theory simplified the modelling process significantly. Systems were modelled only once in the system of systems, not with all the possible pairs of systems. For example, adding a new system to a model of the satellites and the UAVs could be calculated without the recalculation of the model parameters of the satellites and the UAVs.
An introduction of new systems to the model or removing systems from the model gives directly the effect on the capability areas and total capability. In this way the model is a tool for comparing and planning alternative development and acquisition projects.
Different specifications of the capability areas can be used with the method and the desired level of details can be included in the model. The idea of the parallel systems and the auxiliary system can be used to point out the need for next iteration of a more detailed model.
The method was successfully demonstrated with questionnaire data and two systems, the satellites and the UAVs in three scenarios and three time frames. In future work the model can be extended with more systems.
Acknowledgements
The authors wish to thank Dr. Juhani Hämäläinen, Dr. Juha-Pekka Nikkarila and Maj. Pasi Siivonen for their contribution to the work done in International What If? Workshop. The authors wish to thank Dr. Gary Horne, Dr. Juhani Hämäläinen and M.Sc. Niina Nissinen for the opportunity to work in International What If? Data Farming Workshop 27 promoting the area of technology forecasting in the military context and publishing the initial work in the Scythe Proceedings.
References
[1] The U.S. General Accounting Office, Measures of Military Capability: A Discussion of Their Merits, Limitations and Interrelationships, 1985.
[2] M.S.C. Craig, J.A. Stockfish, M.G. Goldberg, S.M. Holroyd, and G.G. Hildebrandt, Measuring Military Readiness and Sustainability, National Defence Institute RAND, 1991.
[3] C. Burris, D. Gonzales, J. McEver, D. Signori, M. Smeltzer, and H. Schoenborn, “Quantitative Capability Delivery Increments: A Novel Approach for Assessing DoD Network Capability”, Proceedings of the AIAA InfoTech@Aerospace Conference, American Institute of Aeronautics and Astronautics, April 2010.
[4] E.N. Urwin et al, “Scenario-based Design and Evaluation for Capability”, IEEE 5th International Conference on System of Systems Engineering (SoSE), 22–24 June 2010.
[5] P.T. Biltgen and D.N. Mavris, “Capability-Based Quantitative Technology Evaluation for Systems-of-Systems”, IEEE 7th International Conference on System of Systems Engineering, 16–18 April 2007.
[6] P.T. Biltgen and D.N. Mavris, “A Methodology for Technology Evaluation and Capability Trade-off for Complex System Architectures”, 25th International Congress of the Aeronautical Sciences, 2006.
[7] C. Wang and V.M. Bier, “Quantifying Adversary Capabilities to Inform Defensive Resource Allocation”, in preparation.
[8] R.J. Dunn, “Measuring Military Capabilities: An Essential Tool for Rebuilding American Military Strength” Backgrounder No 2911, 16 May 2014.
[9] , http://www.dtic.mil/ futurejointwarfare/strategic/jca_framewok.xls.
[10] J. Kosola, Vaatimustenhallinnan opas, Julkaisusarja 5. No 12, Sotatekniikan laitos, 2013.
[11] A. Hing, Australian Defence Preparedness: Principles, Problems and Prospects: Introducing Repertoire of Missions (ROMINS) a Practical Path to Australian Defence Preparedness, Australian Defence Studies Centre, Canberra, 2000.
[12] A.P. Sage and C.D. Cuppan, “On the Systems Engineering and Management of Systems of Systems and Federations of Systems”, Information, Knowledge, Systems Management, Vol. 2, No. 4, 2001.
[13] P. Malone and L. Wolfarth, “System-of-Systems: An Architectural Framework to Support Development Cost Strategies”, IEEE Aerospace Conference, 2012.
[14] X. Wang, C. Du, and Z. Cao, “Probabilistic Inversion Techniques in Quatitative Risk Assessment for Power System Load Forecasting”, Proceedings of the 2008 IEEE International Conference on Information and Automation June 20–23, 2008, Zhangjiajie, China.
[15] V.V. Polenin, “Probabilistic Models in Operation Planning”, Military Thought, April 2004.
[16] E.J. Offutt, J.P. Kharoufeh, and R.F. Deckro, “Distorted Risk Measures with Application to Military Capability Shortfalls”, Military Operations Research, Volume 11, Number 4, 2006.
[17] L. Zhang, B. Mitchell, L. Falzon, M. Davies ,L.M. Kristensen and J. Billington, “Model-based Operational Planning Using Coloured Petri Nets”, 6th International Command and Control Research and Technology Symposium, June 2001.
[18] M. Suojanen et al, “Team 4: Hierarchic Technology Forecasting Model—What Can Be Data Farmed?”, Scythe Proceedings and Bulletin of the International Data Farming Community, Issue 15 – Workshop 27, eds T. Meyer and G. Horne, pp. 30–33, May 2014.
[19] M. Suojanen, V. Kuikka, J-P. Nikkarila, and J. Nurmi, “An Example of Scenario-based Evaluation of Military Capability Areas—An Impact Assessment of Alternative Systems on Operations”, proposal submitted to Military Communications Conference, MILCOM 2014, 2014.