
Volume 15, Number 2, July 2012
Field Investigation And Modelling Of Layered Aluminium Mesh For Blast Mitigation Purposes
- * University of Kentucky, Department of Mining Engineering, 230 Mining and Mineral Resources Building, Lexington, KY 40506, USA.
Abstract
This paper introduces and describes field tests performed with aluminium mesh. The paper also describes a simple theoretical model created in ANSYS AUTODYN to predict the behaviour of the mesh. This is the third, and final, paper in a series which has characterized aluminium mesh and its blast mitigation properties. Despite its porous and lightweight characteristics, aluminium mesh has been found to have blast mitigation properties. The current use of the mesh includes fuel tanks for airplanes, boats, and fuel stations as well as light armoured vehicles for the military. The mesh acts as an explosion suppressant by preventing fuel tanks from exploding when exposed to an ignition source. More recently, work has been performed to assess the ability of the mesh to mitigate blast pressures produced by high explosives. Nearly 100 tests were conducted over a one-year period using high explosives. The first series of tests was done in a small arena test format using two different charge sizes at two different scaled distances yielding four sets of data. All arena tests used four sensors with zero, five, ten, or 20 layers of mesh directly in front of the sensors. The second series of tests used a high-explosive shock tunnel to replicate the waveform of a large explosive charge in open air at a prescribed scaled distance. Results from these test series can be found in the first two instalments of this series of papers. In May 2008, field tests were performed which applied the aluminium mesh to the undercarriage of a Humvee. These tests served as a proof of concept for application of the mesh in the field. One Humvee was outfitted with mesh while another Humvee acted as the control. Results are discussed. While the aluminium mesh is not ready for deployment in the experimental application method, field testing shows promise in the ability to mitigate IED explosion effects.
Introduction
Aluminium mesh has the ability to reduce the peak pressure from an explosion when multiple layers are utilized. Previous testing using an arena test setup and a shock tube has shown that the peak pressure can drop by as much as 20–30% when 20 layers are used [1,2]. A simple model was created using ANSYS AUTODYN to help predict the performance of the aluminium mesh for blast mitigation. This simple model was calibrated using scaled laboratory tests and was then used to aid in development of design tools presented in Lusk et al [2]. While laboratory testing is necessary to properly define materials and their blast mitigation properties, full-scale validation testing is required to characterize the effects the material would have in the field.
Two field tests were conducted at a US Military base in 2008 to further develop the blast mitigation properties of aluminium mesh. Two 1¼-ton Humvees from the 1980s were chosen as test subjects as they were previously decommissioned and no longer useful to the base. One Humvee was used as the control while the other included 20 layers of aluminium mesh applied to the undercarriage. The Humvees were similar in characteristics with the main difference being an engine still in the control vehicle.
Humvees currently being used by the military include large steel plates on the undercarriage to provide protection from road-side improvised explosive devices (IED). These plates add significant weight to the vehicle which reduces the overall performance and effectiveness of the vehicle, and therefore the personnel within. The experimental Humvees did not include these steel plates as there was a desire to quantify the effects of a lightweight material which still offers some level of protection.
These experiments were designed to simulate a Humvee being the target of an IED which is detonated under the rear axle. Although IED differ in explosive type and size, a typical charge size was chosen. An IED-type charge was chosen as it is a typical weapon used by the combatants in the modern war on terror [3].
Simple theoretical model
Modelling of the aluminium mesh was performed using AUTODYN, a non-linear program with many applications. The typical applications of the software are impact, ballistic protection, energetic systems, blast propagation, blast effects on structures, and material research. It also examines material behaviour, structural behaviour, contacts and interactions, and fluid-to-structure interactions. AUTODYN solves the generated model by the use of Lagrange and Euler solvers, or a combination of the two. The Lagrange solver is used to model solid materials while the Euler solver is used to model fluids, gases, and large deformations.
Modelling of the aluminium mesh layers with AUTODYN software was performed by modelling a solid block of aluminium with the same dimensions as the layered mesh with a porosity factor included. The porosity of the mesh was initially chosen as an arbitrary value of 0.45 for ten layers and 0.35 for 20 layers for the 0.35 ounces RDX scaled distance 5 (the first model set performed). The Hopkinson (cube root) scaling equations were used for scaled distance. The units for scaled distance are ft/lb1/3.
The result from the model was compared to experimental data and future models iterated the porosity of each layer configuration until model results were approximately the same as experimental results. The final porosity from the data set was then used for starting points for the remaining model sets. Again, each model set iterated the porosity value until results closely matched experimental values. Aluminium blocks with a porosity factor allowed the models to run much faster and yield more realistic results. The models were created in a planar-symmetric 2D environment with three gauge points that measured free-field pressure and the pressures behind ten layers and 20 layers. Screenshots from a sample 0.35 ounce RDX scaled distance 7.6 model execution can be seen in Figures 1–5. For 0.35 ounce RDX at scaled distance 7.6, the distance from the centre of the charge to the gauge (red diamonds) is 25.466 inches. The distance from the gauge point to the back of the aluminium block is six inches (the distance from the sensor element to the point of the gauge as in the physical experiments [1]). The models were created to simulate the arena tests performed with high explosives so that results from both applications could be compared. Due to the use of symmetry in the model, only two configurations of mesh could be simulated. Mesh configurations of 10 layers and 20 layers were deemed more important to model due to the fact that the data in the experiments was more consistent for these configurations. The pressure contours in the model frame captures in Figures 1–5 show the pressure reduction experienced through the mesh samples. Specifically in Figure 3, the shock front is interrupted and somewhat reflected by the porous model of aluminium. By the screen capture in Figure 5, the distortion created in the spherical shock front can be seen on the left and right side at the front of the pressure contours. This distortion suggests that the aluminium mesh either changes velocity or simply delays the shock front by passing through the mesh. This phenomenon was difficult to quantify with experimental data from the arena tests; however, it is described in detail through analysis of time of arrival data from the shock tube tests in Lusk et al [2]. Statistically, the shock tube tests were much more repeatable than the arena tests and provided data with very steep cumulative frequency curves [2].
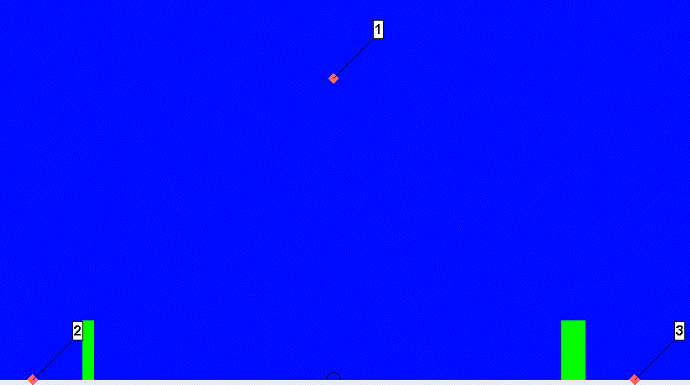
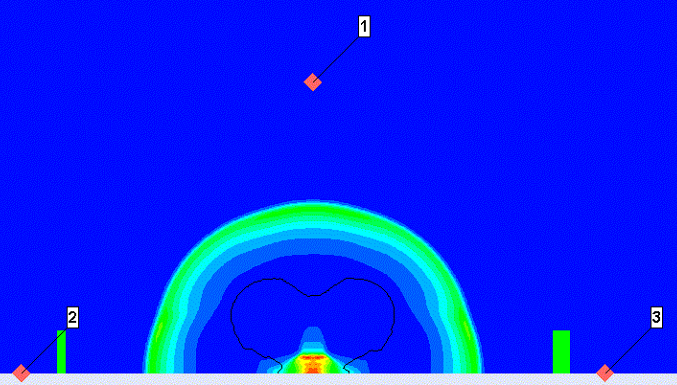
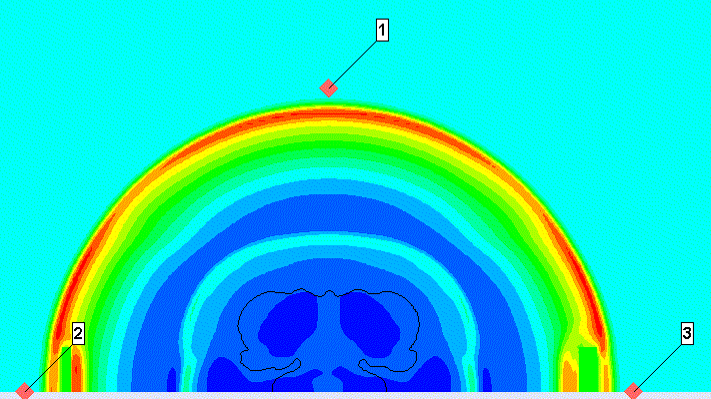
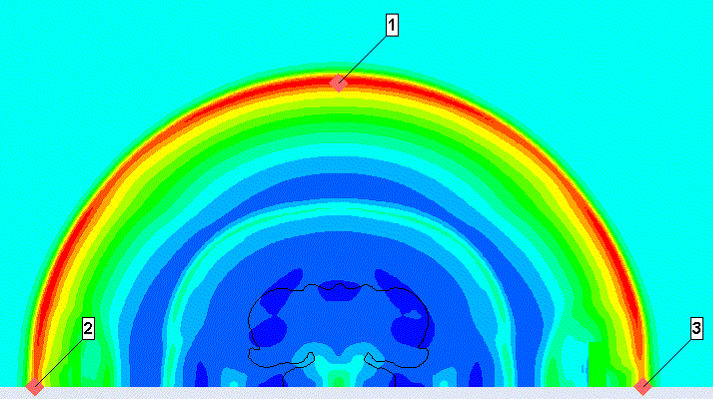
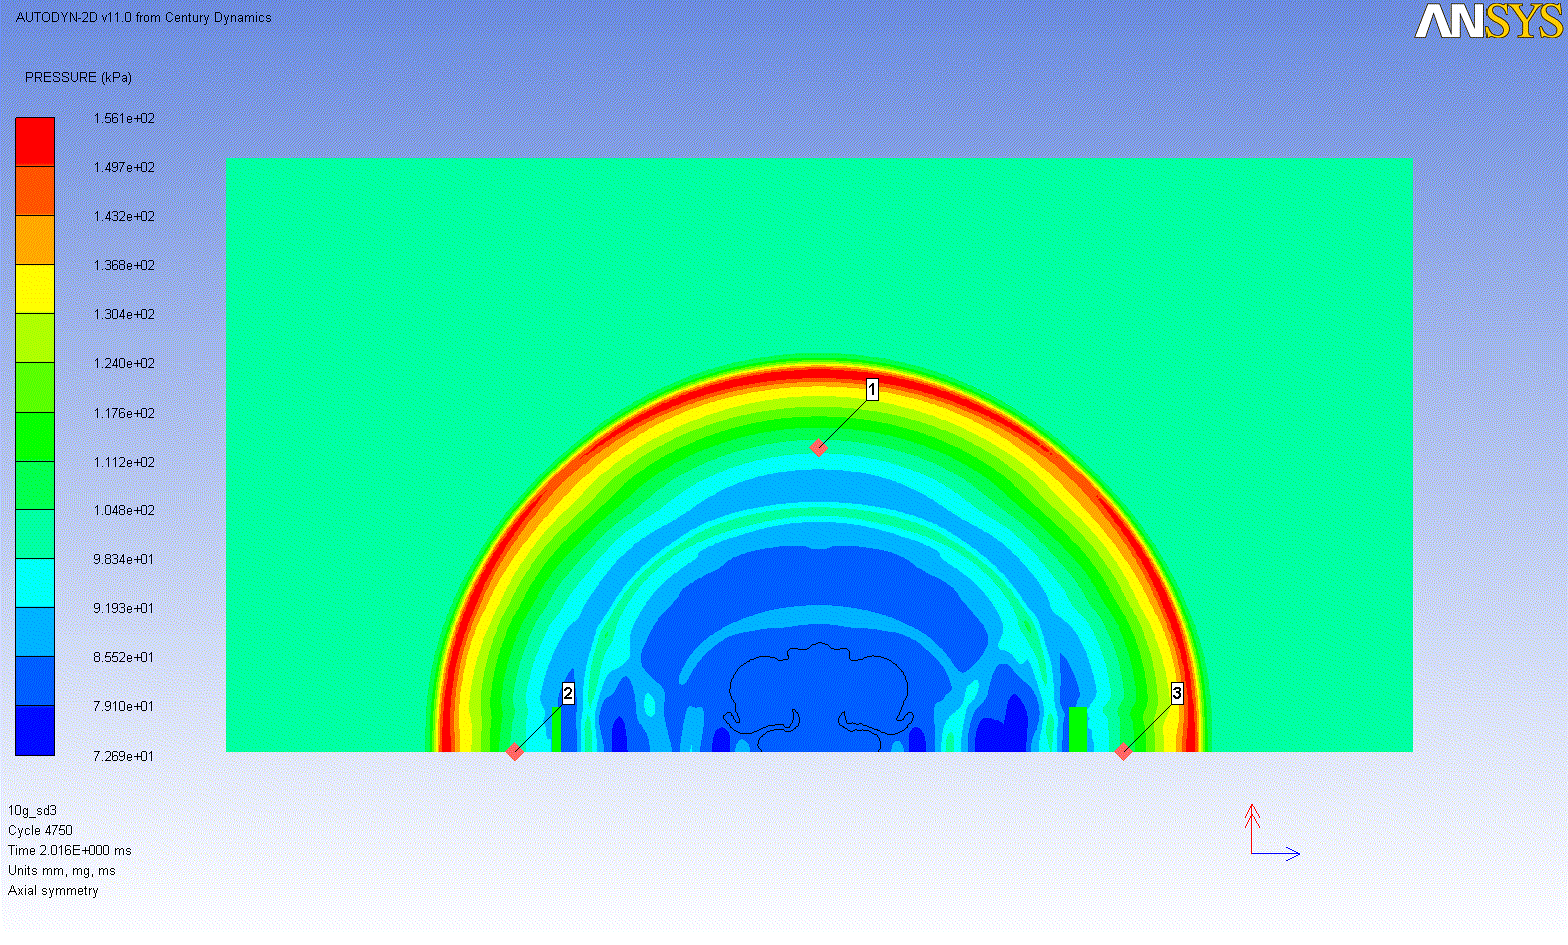
Simulations were run for each test series performed in the arena tests which is briefly discussed in the next section and found in Lusk et al [1]. Table 1 shows the peak pressures generated for each of the three “sensor” points established in the model space. Introducing percent reduction as a metric is appropriate from here forward when discussing the performance of the mesh. Since the different scaled distances and charge sizes produce a range of peak pressures, durations, and impulses, percent reduction is one method for determining overall performance. Table 1 also shows the percent reduction achieved for 10 layers and 20 layers of mesh respectively in the models.
| Pressure (psi) | |||||
|---|---|---|---|---|---|
| Mesh Layers | 0.35 oz SD 5 | 0.35 oz SD 7.6 | 1.4 oz SD 5 | 1.4 oz SD 7.6 | |
| 0 | 30.854 | 13.430 | 21.330 | 12.025 | |
| 10 | 25.100 | 10.877 | 15.080 | 9.742 | Ave Red. |
| % Red | 18.65% | 19.01% | 29.31% | 18.99% | 21.49% |
| 20 | 19.312 | 8.676 | 13.915 | 7.789 | |
| % Red | 37.41% | 35.40% | 34.77% | 35.23% | 35.70% |
| Porosity (%) | Pressure (psi) | ||||
|---|---|---|---|---|---|
| Test | 10 Layers | 20 Layers | No Mesh | 10 Layers | 20 Layers |
| 0.35 oz SD 5 | 51% | 35% | 30.854 | 25.100 | 19.312 |
| 0.35oz SD 7.6 | 55% | 42% | 13.430 | 10.877 | 8.676 |
| 1.4oz SD 5 | 45% | 39% | 21.333 | 15.080 | 13.915 |
| 1.4oz SD 7.6 | 55% | 42% | 12.025 | 9.742 | 7.789 |
| Average | 51% | 39% |
Aluminium mesh samples in the experiments may have been inconsistent in thickness. The model utilized consistent thicknesses, thus some error may have been generated between model and experiment.
Modelling of the mesh in 2D does not allow precise hole size, hole orientation, or layering. Therefore, a solid block of aluminium with width dimensions taken from the field was used. To model the effects of the holes in the aluminium, a porosity factor within AUTODYN was used. As ten layers of mesh are more porous than 20 layers, a higher porosity factor was used for the ten layer aluminium block. Table 2 shows the porosities used in the models to simulate field conditions. The porosities of each set slightly differs to allow greater agreement to field experiments but can be considered negligible since orientation of the mesh changed for each experiment in the field and did not vary by more than 10% from the average in any model. Each scaled distance 5.0 model yielded identical porosity differences of 16% between ten and 20 layers. Both scaled distance 7.6 models had identical porosity values for each layer configuration. This suggests that the human error phenomena as previously explained for the physical experiments is magnified for the scaled distance five data sets resulting in porosities slightly different from that of the scaled distance 7.6 data sets.
The models are calculated in an ideal environment with consistent mesh thicknesses for each model simulated while the physical experiments had slight differences in mesh thicknesses from the tightening of the frame over the perimeter of the mesh. Further modelling of the aluminium mesh could potential use the average of the porosities to give more general application but have reduced accuracy results. The pressures recorded by the model can also be seen in Table 2.
The models did not correspond with the arena tests initially since the porosity of the mesh layered together was unknown. The porosity values of the aluminium blocks in AUTODYN were altered in each model set until the percent reduction approximately equalled that of the experimental values. The porosity values were within approximately 10% of the average for both the ten and 20 layer aluminium blocks. This small difference seems appropriate since the explosion in the model is constant in each execution while the variability in the explosives tests can be estimated around 10% based on the standard deviation of the experimentally measured pressures.
Scaled arena tests
The self propagating pressure front emanating from an explosive event is not perfectly spherical. It is subject to directional effects due to the detonator and shape of the charge. That is to say the energy output is not uniform in all directions and as a result, experienced pressures will vary depending on orientation to the event. This variance becomes more evident as the distance between the charge and sensor decreases. This is attributed to the fact that pressure exponentially decays as distance increases [4]. This lack of symmetry is clearly evident upon review of high-speed video. Figure 6 is a screen shot illustrating a typical 0.35 ounce explosive event.
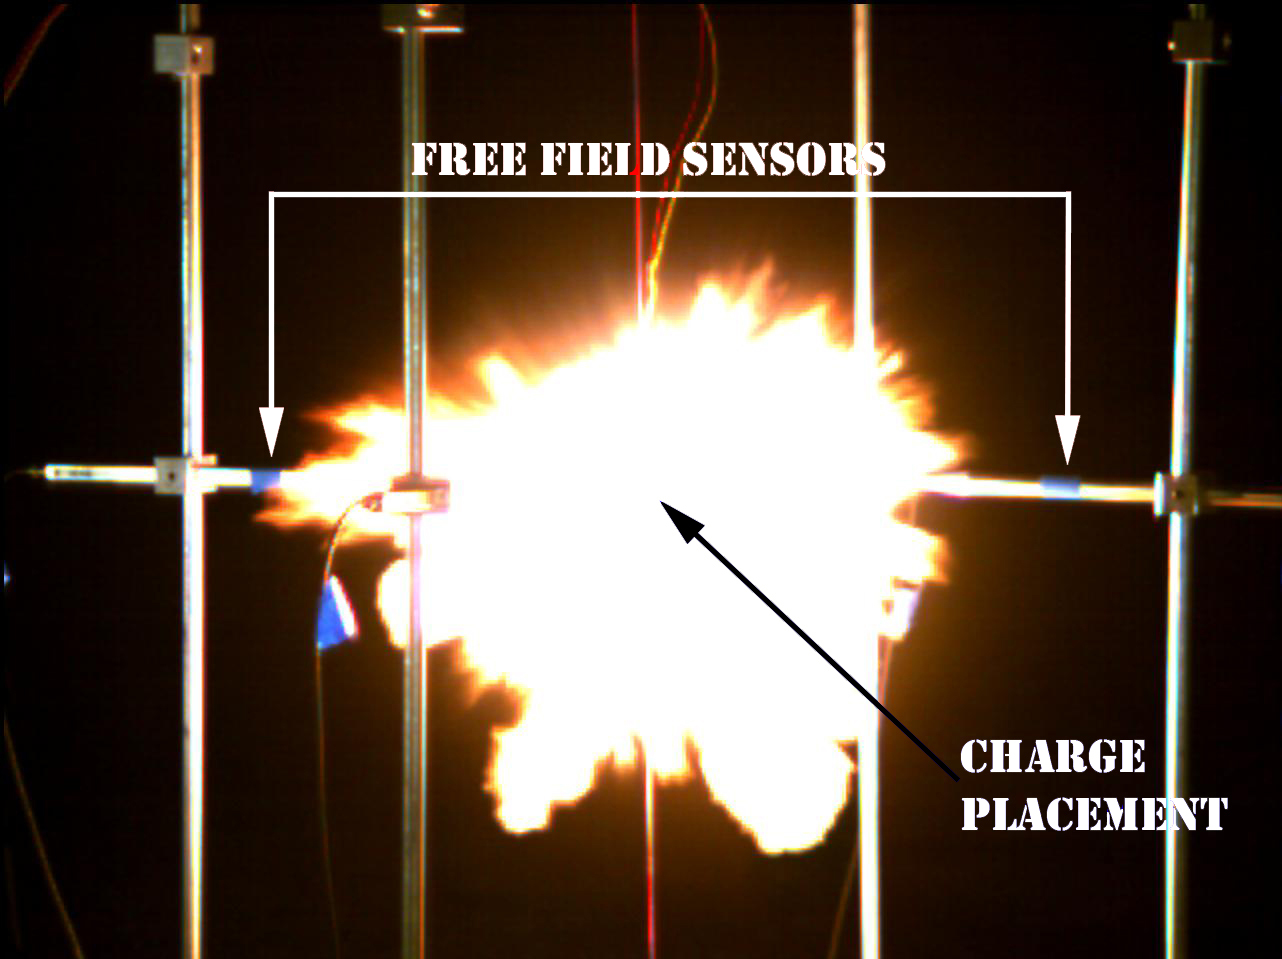
Direction of initiation plays a role as well. The detonator was positioned downward and as a result a greater amount of the fireball can be observed below the charges position. Sensors were placed as to not be in the path of this greater energy release as it was better to have the directional effects downward.
Although great care was taken to ensure precise and reproducible charge and sensor placement, some variance was inevitable. In the smaller scale tests where the distance between the charge and sensor is only 17 inches (0.35 oz SD 5) a variance of 0.25 inch is potentially more noticeable in the pressure data than in the larger scale tests where the distance between the charge and sensor is 40 inches (1.4 oz SD 7.6). This is apparent in the data collected from the smaller scaled arena tests.
| Test | Channel | Pressure (psi) | Impulse (psi-ms) | Order of Arrival | Time of Arrival (msec) |
|---|---|---|---|---|---|
| A | 1 | 30.520 | 2.891 | 3 | 0.053 |
| 2 | 36.131 | 3.039 | 2 | 0.032 | |
| 3 | 27.435 | 2.975 | 4 | 0.127 | |
| 4 | 22.332 | 2.668 | 1 | –0.002 | |
| Average | 29.105 | 2.893 | |||
| B | 1 | 31.126 | 2.684 | 2 | 0.154 |
| 2 | 28.247 | 2.897 | 1 | 0.134 | |
| 3 | 27.938 | 2.894 | 3 | 0.179 | |
| 4 | 23.553 | 2.651 | 4 | 0.183 | |
| Average | 27.716 | 2.782 | |||
| C | 1 | 19.680 | 2.055 | 3 | 0.005 |
| 2 | 22.183 | 2.118 | 2 | –0.005 | |
| 3 | 23.136 | 2.814 | 1 | –0.007 | |
| 4 | 20.942 | 2.212 | 4 | 0.017 | |
| Average | 21.485 | 2.300 | |||
| D | 1 | 25.320 | 2.788 | 4 | 0.045 |
| 2 | 33.473 | 2.619 | 2 | 0.004 | |
| 3 | 35.929 | 3.789 | 1 | –0.005 | |
| 4 | 27.184 | 3.158 | 3 | 0.024 | |
| Average | 30.477 | 3.089 | |||
| E | 1 | 26.490 | 2.710 | 4 | 0.017 |
| 2 | 28.636 | 2.559 | 3 | 0.015 | |
| 3 | 31.708 | 3.782 | 1 | –0.003 | |
| 4 | 26.199 | 2.856 | 2 | 0.004 | |
| Average | 28.258 | 2.977 | |||
| F | 1 | 32.190 | 3.664 | 4 | 0.028 |
| 2 | 34.890 | 2.795 | 3 | 0.016 | |
| 3 | 34.146 | 3.492 | 1 | –0.004 | |
| 4 | 29.690 | 3.057 | 2 | 0.012 | |
| Average | 32.729 | 3.252 | |||
| All Ave | 28.296 ± 2.037 | 0.043 ± 0.026 |
Six blank (no mesh) 0.35 ounce scaled distance 5 tests were performed for a reference base case. The data from these tests was analyzed with particular interest in the pressure front times of arrival at the sensor locations. Time zero is the time the event triggered the sensory equipment. The times of arrival can be seen in Table 3.
Two points are highlighted by Table 3. First, the time of arrival does not correspond to the pressure experienced. Just because the pressure front arrived at a sensor before the others does not mean that this sensor recorded the highest pressure, which was not expected. This is counterintuitive to what is expected from an ideal explosive event. Ideally times of arrival and pressures should be identical at all sensors. If times of arrival vary then the sensors’ proximity to the event vary and, in turn, the sensor that experiences the first time of arrival will also record the highest pressure. It is evident from the data collected that directional effects have not allowed for a perfectly spherical shock wave to emit from the charge. This phenomenon agrees with experimental data collected by Hargather who concluded that errors in pressure measurements were highest at distances closest to the center of the charge [5]. Tang also expressed difficulty in accurately quantifying error in pressure measurements close to an explosive charge. His conclusions mentioned that sensors closer than 6.56 feet (2 metres) could not be reliably assessed [6].
Second, the times of arrival are all very close to one another. This supports an accurate experimental set up as far as sensor to charge distances are concerned. This also suggests the spread of pressures in the small scale arena tests to be attributed to the previously stated phenomena. Cooper presents an interesting viewpoint on the estimation of pressures at distance. “The amount of energy available from the explosive may be partitioned between the air shock and other work that the explosive is doing at the same time.” [4] In other words, there is potential shock loss from the expansion of any casing surrounding the explosive. In the case of the arena test, a latex bladder and tape was used to suspend the charge may have required differential work around the surface of the charge creating further directional effects that were amplified at such close ranges.
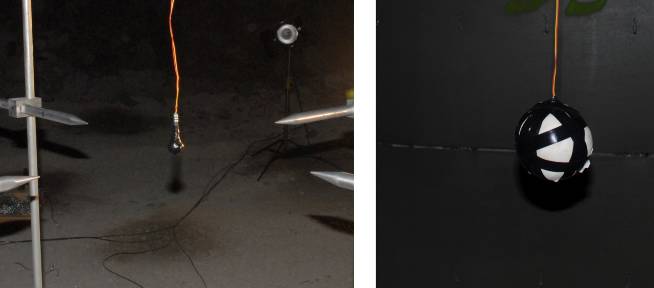
Some level of charge confinement was incurred in the construction of the charge when electrical tape was used to secure the blasting cap to the RDX. When this is carried out with 0.35 ounces of RDX the confining effect of the tape plays a greater role than with 1.433 pounds of RDX. Figure 7 shows sample charges.
Results of the arena tests using mesh has been previously published in Lusk et al [1] and will not be discussed here. However, a summary of the relevant results can be found in Table 4.
Comparison of model to experimental data
Modelling of the arena test experiments was difficult in the beginning. AUTODYN has several symmetry options and the first option was run as 2D axial. This gave results much higher than the experimental results. It was determined that axial symmetry creates a much larger charge size than is inputted into the program by the way it rotates the placed charge. After more thought, it was determined that the model must be in 2D planar symmetry to create a proper sphere of explosives. The new model runs yielded much better results that were much closer to that of the physical experiments. Four separate models were created that matched the physical dimensions of each arena experimental configuration. The models are created in ideal conditions that cannot be replicated in the field due to many factors. AUTODYN utilizes explosives in a perfectly compacted sphere at the highest possible density that cannot be replicated due to human error. AUTODYN also calculates the explosion the same way every time. A conscious effort was made to pack the explosives a tight as possible in as round a shape as possible, but each test slightly differed since they were being packed by hand. AUTODYN also detonates the explosive in a single point defined by the user. Again, the detonator was placed as close to the centre of the explosive sphere as possible, but detonator inconsistencies do not allow an exact detonation pinpoint. Aside from these obstacles, the results of the models give good comparisons to that of the experiments.
The first topic examined was the difference of the free-field pressures recorded in the field to the pressures generated in AUTODYN. Table 4 shows the comparison with the difference between the two. For two sets of experiments, the AUTODYN pressure was higher than that recorded in the field. For the other two, the field tests gave higher pressures. The largest difference came from the 1.4 ounce tests at scaled distance five. The table only shows the average of the pressures from the field tests, but a closer look at the raw data shows that the pressures recorded for the 1.4 ounce scaled distance five range from 26.745 psi to 37.639 psi. The range most likely comes from human error; whether the charge was sufficiently packed and/or the charge was hung in the exact centre of the arena. If the lowest pressure recorded (26.745 psi) was used for the comparison, the percent difference would fall to 20%. Being within an approximately 20% difference from ideal conditions gives confidence that the models closely replicate field experiments.
The final step in analyzing the models is to compare the pressure reductions caused by the aluminium mesh to field experiments. Table 5 shows the pressures recorded for both modelling and arena field tests. The pressures are in good agreement between model and experiment.
Table 6 shows the reduction of the peak pressure for modelling and field experiments. The table shows that the reductions seen in the field arena tests are also evident in the modelling. This gives assurance that further modelling using the appropriate porosity can give good comparisons to field testing. Table 6 reports the reduction of the averages.
To simulate the expected pressures to be seen by the Humvee in the field tests, models were run to simulate a five-pound C-4 charge located 16 inches away from the aluminium mesh. This is the approximate clearance of the experimental Humvees. One model was run with mesh present and then another without the mesh so a reduction could be estimated.
| Test | Average Experimental Pressure (psi) | AUTODYN Pressure (psi) | Difference (%) |
|---|---|---|---|
| 0.35oz SD 5 | 26.960 ± 5.727 | 30.85 | 12.61% |
| 0.35oz SD 7.6 | 10.568 ± 2.129 | 13.43 | 21.31% |
| 1.4oz SD 5 | 33.011 ± 3.134 | 21.33 | –54.76% |
| 1.4oz SD 7.6 | 13.860 ± 0.962 | 12.03 | –15.21% |
| Test Series | ||||
|---|---|---|---|---|
| 0.35oz SD 5 | 0.35oz SD 7.6 | 1.4oz SD 5 | 1.4oz SD 7.6 | |
| Experimental Pressure (psi) | ||||
| No Mesh | 26.960 ± 5.727 | 10.568 ± 2.129 | 33.011 ± 3.134 | 13.860 ± 0.962 |
| 10 Layers | 21.668 ± 4.177 | 8.608 ± 1.585 | 24.712 ± 2.667 | 11.710 ± 1.198 |
| 20 Layers | 16.554 ± 2.951 | 6.893 ± 1.322 | 23.455 ± 2.252 | 10.573 ± 0.414 |
| Modelling Pressure (psi) | ||||
| No Mesh | 30.854 | 13.430 | 21.333 | 12.025 |
| 10 Layers | 25.100 | 10.877 | 15.080 | 9.742 |
| 20 Layers | 19.312 | 8.676 | 13.915 | 7.789 |
| Experimental Reduction | Modelling Reduction | |||
|---|---|---|---|---|
| Test | 10 Layers | 20 Layers | 10 Layers | 20 Layers |
| 0.35oz SD 5 | 19.63% | 38.60% | 18.65% | 37.41% |
| 0.35oz SD 7.6 | 18.55% | 34.77% | 19.01% | 35.40% |
| 1.4oz SD 5 | 25.14% | 28.95% | 29.31% | 34.77% |
| 1.4oz SD 7.6 | 15.51% | 23.72% | 18.99% | 35.23% |
| Average % Reduction | 19.71% | 31.51% | 21.49% | 35.70% |
| Std. Dev. | 4.02% | 6.54% | 5.22% | 1.17% |
The models were run in a similar fashion to the ones described above using a 39% porosity of the mesh part which simulated 20 layers of mesh. Since all lab experiments characterize the mesh in a free-field pressure reduction application, gauge points in the model collected pressure in a free-field manner. Although this is not the method to be used in application for the field tests, reflected pressures behind the mesh have not yet been studied.
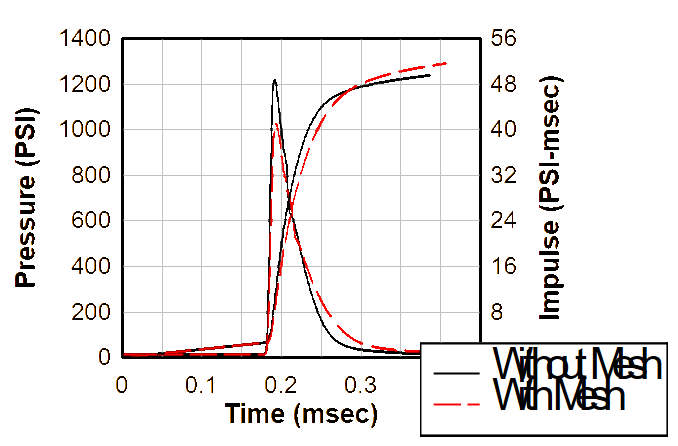
A scaled distance of 0.78 is the result of the five pound charge at 16 inches. This scaled distance is very different from the laboratory studied values of 5.0 and 7.6. The results of the modelling simulation can be found in Figure 8. When no mesh was present in the models, an expected pressure of 1,222 PSI was calculated at 26 inches from the charge. Using the same gauge location but putting mesh at 16 inches from the charge, a value of 1,029 PSI was determined. This is a 15.7% reduction in peak pressure. Impulse reduction was not experienced when comparing the two models. The lack of impulse conclusion agrees well with the design tool chart published in the second instalment of this series of papers [2] while the peak pressure reduction does not. For very small scaled distances, the impulse reduction drastically drops off to a near zero value. However, for the pressure reduction, the design chart shows an increase in reduction as scaled distance decreases. This suggests that the curve on the design chart must peak at some scaled distance value and begin to decrease as scaled distance is reduced.
Experimental setup
Preparation time for this experiment was limited to three weeks due to range availability and the project termination date thereby not allowing enough time to procure higher pressure gauges expected to be required for this test. Despite this obstacle, four 500 psi gauges already in possession were installed throughout each Humvee.
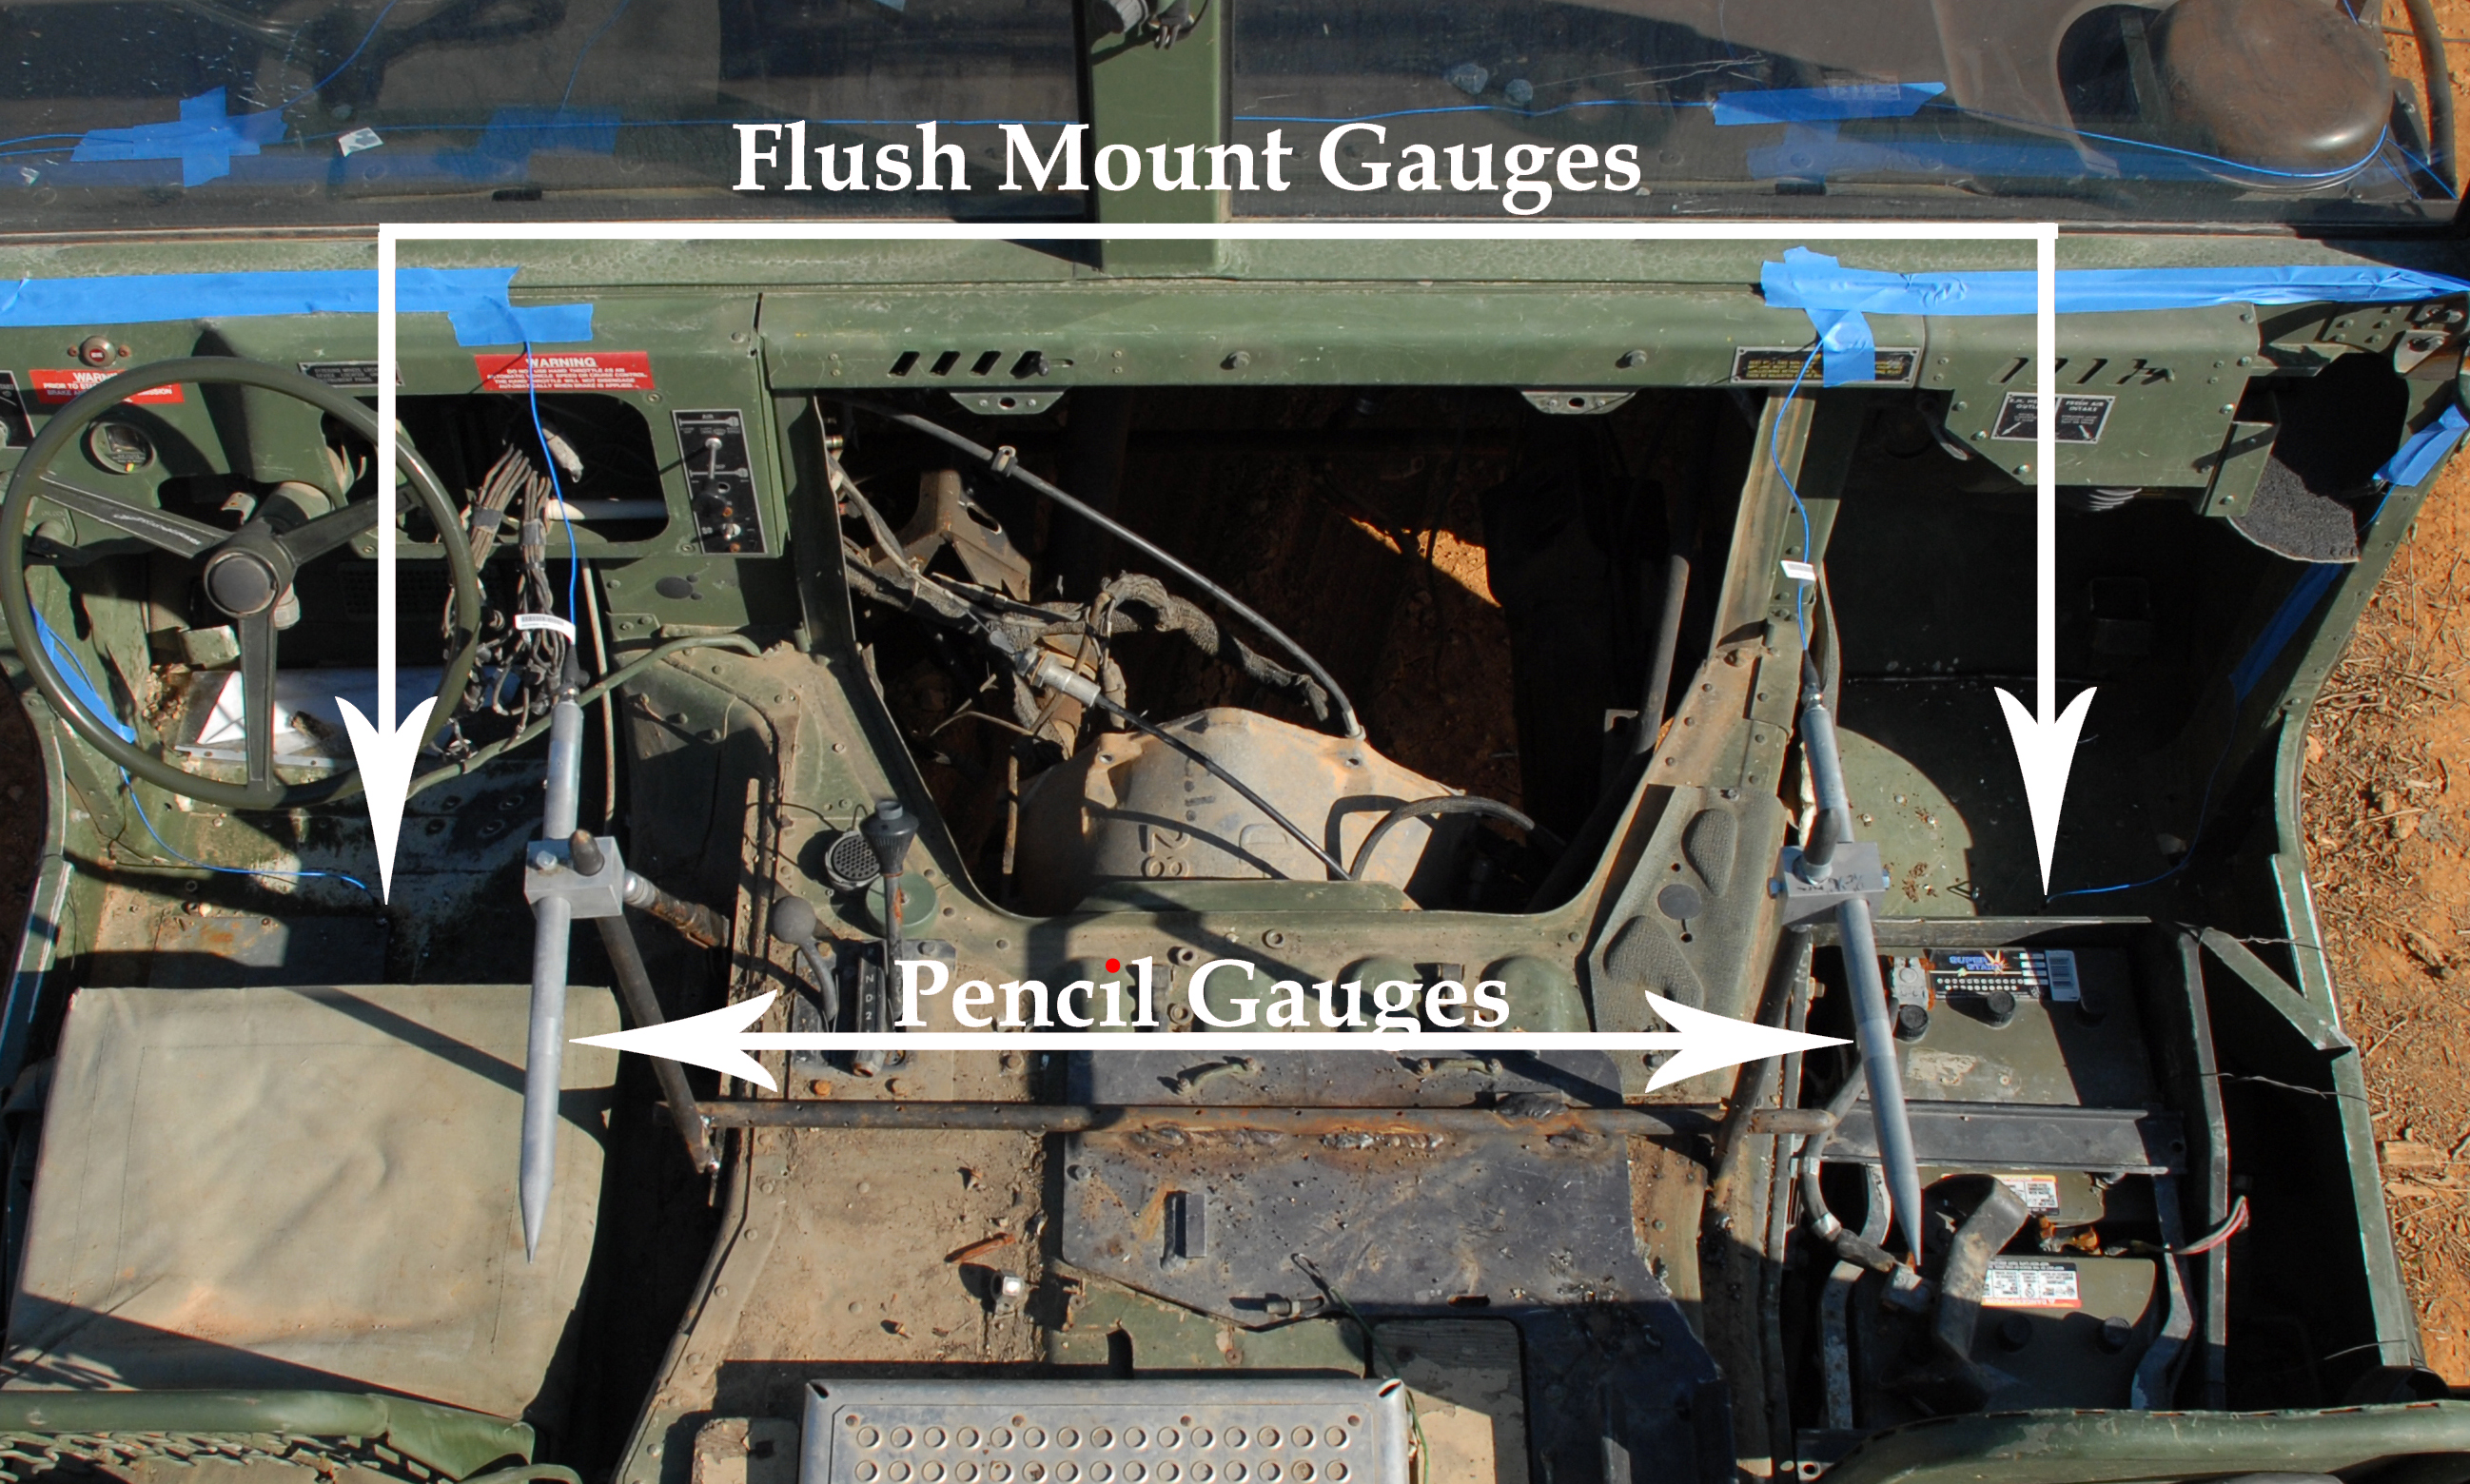
Two flush mount sensors were installed at the feet position of the driver and passenger. Holes were drilled and tapped so each sensor element was flush with the underside of the Humvee. Two pencil gauges were also installed to measure free field pressure at the driver and passenger’s chest level. A vertical pole was bolted to the tub of the Humvee with the sensor mounted perpendicular to the pole at chest level using aluminium blocks.
Using the Blast Effects Computer program [7], installation locations of the sensors were set at a distance where 500 psi was not expected to be reached from a five-pound military grade C-4 charge located under the rear axle of the Humvee. This setup was performed identical for both Humvees. Figure 9 shows a schematic of the sensor setup. Cables from the sensors were run approximately 100 feet to a signal conditioning unit and then to a data acquisition system.
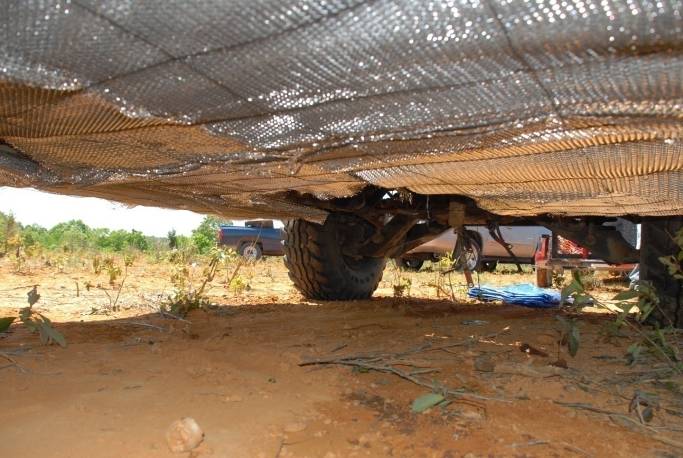
Twenty layers of aluminium mesh were installed using 16 gauge solid steel wire on the undercarriage of the experimental Humvee (including fuel tank) while no mesh was used on the control Humvee. A majority of the layers used were 24 inches by 24 inches. Additional spots were filled in with 12 inch by 12 inch layers. Attempts were made to bring the mesh as tightly to the body as possible, but due to the method of installation, there was minimal sagging in between the supporting steel wire. The aluminium mesh installation can be seen in Figure 10.
The Explosive Ordinance Disposal (EOD) division of the Fort constructed, deployed, and detonated the charge as a training exercise. A five pound C-4 charge was placed on the bare ground directly beneath the rear transfer case of the rear axle. High speed video captured at 1,000 frames per second was captured for each test. In addition, a standard definition camcorder was placed approximately 200 feet from the Humvee to record the explosion.
Results
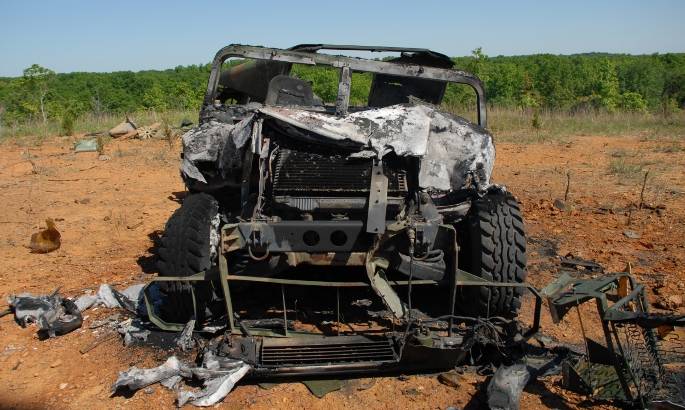
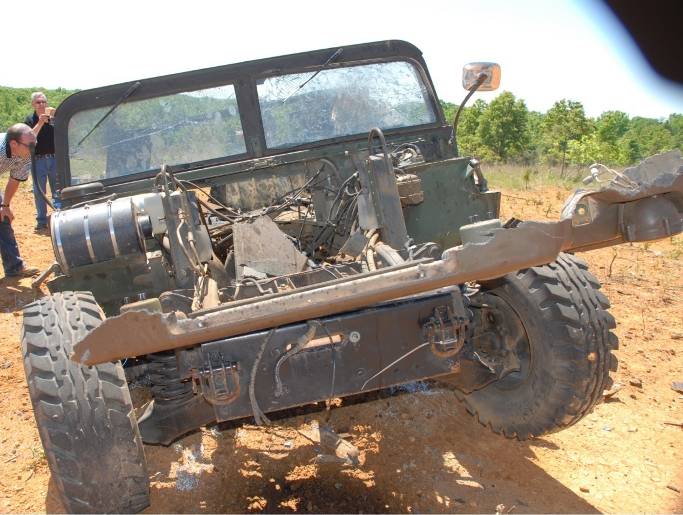
After each test, pressure data was downloaded, high speed footage was reviewed, the vehicle was visually inspected and photographed. The pressure sensors used in these tests worked properly, however the pressures produced by the explosion unexpectedly exceeded their limit of 500 psi. The only conclusion from the pressure data is that pressures exceeded 500 psi in both tests. Should future tests be conducted higher pressure sensors will be utilized. Therefore, visual comparative inspection of the Humvees is the only means of analysis. Figures 11 and 12 depict the Humvee without mesh and the Humvee with mesh, respectively, after testing.
Field testing performance of the mesh was not able to be quantified due to the lack of lead time necessary to obtain the proper pressure sensors. However, based on visual inspection of the video evidence and photographs of the before and after effects of the explosion, the aluminium mesh did have some positive influence on the damage experienced by the vehicle and provided some level of protection. Although it is difficult to draw any solid conclusions from only two tests, several observations can be made that would support future investigation. A secondary fire in the test where no mesh was used raises some interesting questions.
Upon visual comparison it appears as though damage to the Humvee was more extensive to the Humvee when no aluminium mesh was installed on the undercarriage. The Humvee outfitted with mesh was covered in unburned diesel fuel following the test. The control Humvee was engulfed in flames immediately and burned for nearly 15 minutes. A preliminary conclusion is that the mesh may have reduced the pressure and impulse from the high explosive charge enough to prevent ignition of the diesel fuel. It is also possible that the mesh acted as an explosive flare suppressant and did not allow the explosion flame to reach the exposed diesel fuel.
From the data collected in the other tests for this project, conclusions can be drawn that the aluminium mesh is a viable option for vehicle protection. Further quantifiable characterization is needed to determine the effects of the mesh in practical application. The aluminium mesh is not very robust, and thus operationally, methods will need to be developed prior to implementation on active vehicles.
Discussion
While exact pressure values were not recorded and not able to be compared, there are several qualitative positive outcomes from these two tests. Although the situations to be described are purely theoretical, instances similar to these may occur to active duty military personnel.
First, and most obvious, the Humvee which utilized aluminium mesh on the undercarriage did not burst into flames. While there were several variables not known about each Humvee (amount of fuel in the tank, age of fuel, etc.), it can be assumed that since these Humvees were constructed only one year apart, their decommission date would have been comparable resulting in similarly aged fuel. The researchers were told that the fuel tank had been previously drained suggesting that only residual fuel remained. For the sake of this theoretical situation, it will be assumed that each Humvee had identically aged and volume of diesel fuel. As shown in Figures 13 and 14, the driver and passenger seats from the Humvee which used mesh were still intact while the corresponding seats from the Humvee without mesh were completely burned and destroyed.
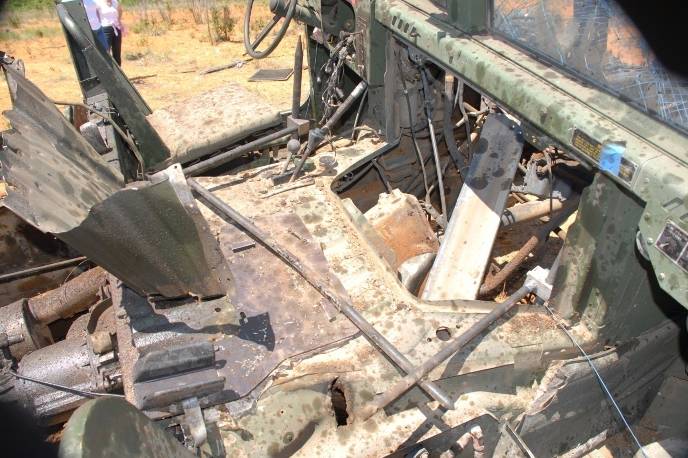
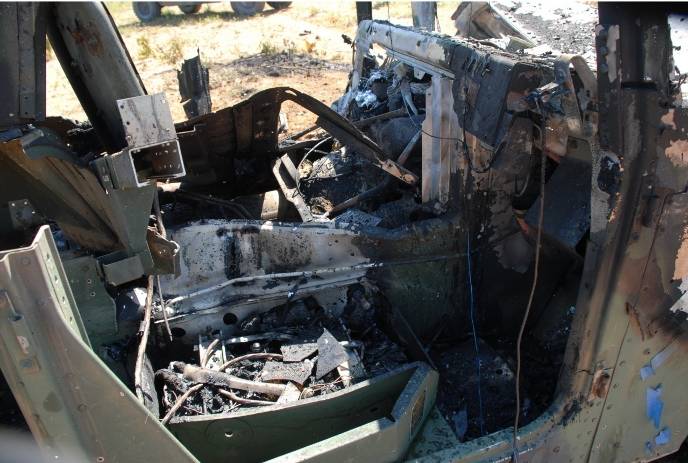
In the event of being affected by an IED, properly restrained personnel may be able to survive the explosion force and the impact from the Humvee coming back to earth and striking the ground. Although still alive, personnel may be incapacitated or knocked unconscious. If unable to move or not conscious, personnel would surely perish if the entire vehicle is engulfed in flames. It is believed that the addition of the aluminium mesh did not allow for the Humvee to catch on fire even though diesel fuel was found on the vehicle body after the test.
Second, the Humvee which had aluminium mesh on the undercarriage seemed to suffer less overall damage. While this is a subjective opinion, the tub of the body seemed to be more intact which may lead to an increased number of survivors. The windshield was also blown outwards from the inside of the Humvee which did not have mesh on the undercarriage. Figures 15 and 16 show photographs from similar perspectives of each vehicle after the test.
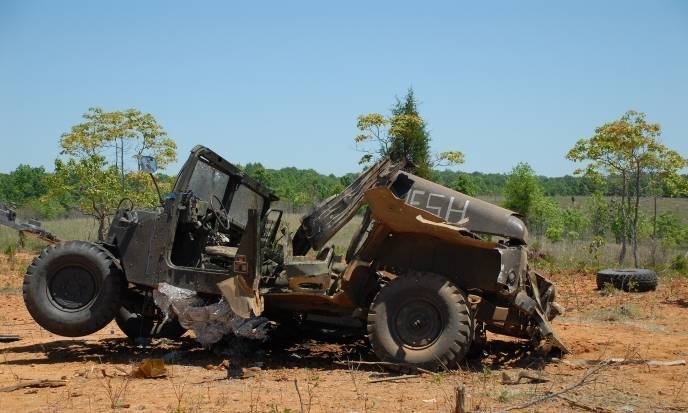
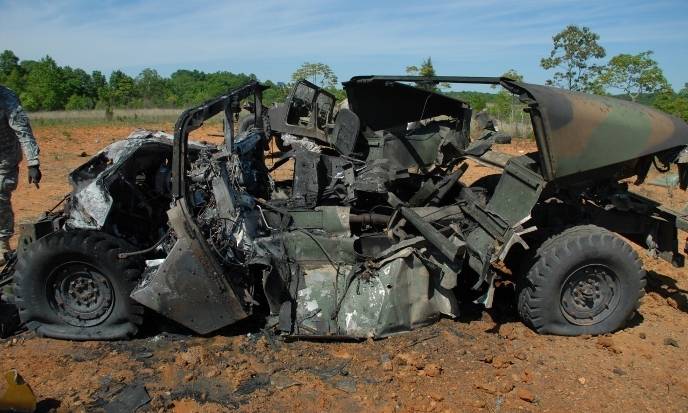
Finally, the mesh used in the experiments is not a robust material. The mesh easily stretches, compresses, tears, and deforms. To be practical in application for blast protection from IEDs, a means must be developed to properly deploy this material. The primary benefit of this material is its lightweight characteristic. Therefore, any additional material which is necessary to properly apply the material to armoured vehicles must not compromise the primary feature of the aluminium mesh.
The first method for implementation would be the use thin aluminium plates on the outer surface of the mesh to sandwich the mesh between the plate and body of the vehicle. The plate would then be bolted to the frame. This method would not only add additional mass to the system, but would also act as a skid-plate which would not allow rocks, bushes, branches, etc. to compromise the mesh alone.
The second method would use a spray elastomer polyurethane or polyurea similar to truck bed-lining materials. Although this method is not fully developed, mesh could be suspended from the undercarriage (similar to Figure 2) and then sprayed to form a coating on the mesh and attach it to the vehicle. Another option would be to create mesh block modules which could be attached in desired locations with bolts or cables. As with method one, method two would help prevent the material from being compromised when the vehicle goes off-road.
Regardless of the method of deployment, something in addition to the aluminium mesh alone must be used to keep the material intact so the blast mitigation properties can be properly utilized.
Conclusion
Finite element modelling of the field arena tests resulted in similar results after properly calibrated using a porosity factor. In addition to scaled arena tests, finite element modelling was used to determine the effects of the aluminium mesh on a large bomb very close to the target (that is, small scaled distance value). After calibration of the model from the experimental scaled tests, modelling shows that the mesh may have reduced the peak pressure seen by the Humvee by approximately 15.7%. While this trend does not agree with the design chart presented in Lusk et al [2], the results suggest that the largest peak pressure reduction value occurs at a scaled distance between 5.0 and 0.78 and reduces as the scaled distance decreases. However, the nearly non-existent impulse reduction was expected when following the design chart.
Due to the short time from the possibility of the tests occurring to the tests actually being performed did not allow for the procurement of proper pressure sensors, the only conclusion that can be made is that the pressures exceeded 500 psi. However, initial reactions and post-test analysis lead to the conclusion that the aluminium mesh acted as a blast mitigation instrument to some, indefinable degree. There was no post-explosion fire in the Humvee which utilized the mesh despite diesel fuel being spread about the vehicle. The driver and passenger seats were also intact compared to the control Humvee which had little remains of the seats.
While the authors believe that the mesh reduced the detrimental effects from the explosion, these field tests were not able to quantify the effects. However, previously published papers on this mesh research prove that the peak pressure decreases approximately 20–30% with 20 layers of mesh while the impulse reduction value was inconclusive, although still a reduction to some degree. Analysis of the data revealed that the mesh is more efficient at pressure reduction at lower scaled distances while it more effectively reduces impulse at higher scaled distances. The effect of charge size has not been completely characterized. It is uncertain whether large ranges of charge sizes would generate the same results. In general, larger scaled distances would produce longer durations while using similar charge sizes; however, larger charge sizes would also produce longer duration wave forms.
The aluminium mesh is not ready for deployment in its current state to counteract IED explosion effects. The material is easily deformed, ripped, and would not withstand off-road operations. However, a couple methods have been introduced to develop a more deployment-ready material which could be used in conjunction with current anti-IED protection or as a replacement.
- Future Work
While the blast mitigation properties were not quantifiably supported by the two field tests, the mesh seemed to help mitigate the blast in some way. This conclusion is supported by the models and scaled testing. However, multiple additional tests are needed so quantitative data can be collected and analyzed. Once aluminium mesh itself can be defined for field use, methods of proper application deployment must be investigated. Upon a successful application method, the mitigation properties of the aluminium mesh can be directly compared to currently used steel plates; initially in the laboratory and then in the field.
References
[1] B. Lusk, K. Perry and J. Hoffman, “Laboratory Investigation of Layered Aluminium Mesh for Blast Mitigation Purposes Using an Arena Setup”, Journal of Battlefield Technology, Vol. 13, No. 2, pp. 1–12, July 2010.
[2] B. Lusk, J. Hoffman and K. Perry, “Laboratory Investigation of Layered Aluminium Mesh for Blast Mitigation Purposes Using a Shock Tube”, Journal of Battlefield Technology, Vol. 14, No. 1, pp. 1–6, March 2011.
[3] P. Mulligan, “The Effects Select Physical Parameters have on an Explosively Formed Projectile’s Performance”, Missouri University of Science and Technology, 2011.
[4] P.W. Cooper, Explosives Engineering, Wiley-VHC Inc., New York, 1996.
[5] M.J. Hargather and G.S. Settles, “Optical Measurement and Scaling of Blasts from Gram-Range Explosive Charges”, Shock Waves, Vol. 17, No. 4, pp. 215–223, 2007.
[6] J. Tang, “Free-field Blast Parameter Errors from Cartesian Cell Representation of Bursting Sphere-Type Charges”, Shock Waves, Vol. 18, No. 1, pp. 11–20, 2008.
[7] M.M. Swisdak, DDESB Blast Effects Computer, US Department of Defense, Washington DC, 2001.
[8] Y. Andreopoulos, S. Xanthos and K. Subramaniam, “Moving Shocks Through Metallic Grids: Their Interaction and Potential for Blast Wave Mitigation”, Shock Waves, Vol. 16, No, 6, 2007, pp. 455–466.
[9] R.S. Wakeland and R.M. Keolian, “Measurment of Resistance of Individaul Square-Mesh Screens to Oscillating Flow at Low and Intermediate Reynolds Numbers”, Journal of Fluids Engineering, Vol. 125, September 2003.
[10] G.W. Ma and Z.Q. Ye, Energy Absorption Capacity of Layered Foam Cladding, Department of Civil and Environmental Engineering, Nanyng Technological University, Singapore, Springer-Verlag, 2006.
[11] W.E. Baker, “Explosions in Air”, University of Texas Press, 1973.
[12] J.M. Dewey, “Air Velocity in Blast Waves from TNT Explosions”, Roy. Soc.-Proc. Ser. A 279(1378), pp. 366–385, 1964.
[13] H. Kleine, J.M. Dewey, K. Ohashi, T. Mizukaki and K. Takayama, “Studies of the TNT Equivalence of Silver Azide Charges”, Shock Waves, Vol. 13, No. 2, pp. 123–138, 2003.
[14] G.F. Kinney and K.J. Graham, Explosive Shocks in Air, Springer, New York, 1985.
[15] ISEE, Blasters Handbook 17th Edition, International Society of Explosives Engineers, Cleveland, Ohio, 1998.
[16] J. Hoffman, B. Lusk, and K. Perry, “Investigations of Shock Tunnel Dynamics and Energy Realization”, Blasting and Fragmentation, Vol. 3, No. 3, pp. 207–226, 2009.
[17] B. Lusk, “Large Arena Test Simulator Using Small High Explosive Charges”, Proceedings of the Thirty-second Conference on Explosives and Blasting Technique, Orlando, FL, International Society of Explosives Engineers, Cleveland, Ohio, 2006.
[18] B. Lusk, K. Perry and S. Lusk, “Predictability of a High Explosives Shock Tube for Testing Blast Resistant Windows” Blasting and Fragmentation, Vol. 4, No.2, pp. 75–90, 2010.