
Volume 13, Number 3, November 2010
Measuring Complexity And Critical Behaviour In Spatial Patterns In Afghanistan
- 1 Defence R&D Canada—Centre for Operational Research and Analysis, 101 Colonel By Dr., Ottawa, ON, K1A 0K2, Canada.
Abstract
This paper outlines the use of two quantities, the fractal dimension and symmetropy, the latter a marriage of symmetry and entropy, that have been shown to be effective in describing key aspects of the spatial distribution of systems that display nontrivial spatial patterns and that are regulated by fractal statistics. Motivation for applying these two measures to the geographical distribution of violent incidents in Afghanistan from 2006 to 2009 was provided by previous studies suggesting that this conflict exhibits properties of a near critical system when violent incidents are viewed as a point process. In this paper, the (spatial) fractal dimension and symmetropy are computed for violent incidents in Afghanistan from 2006 to 2009 and noticeable changes are qualitatively linked to known events over the same time period. Overall, it was found that variations in the (spatial) fractal dimension were highly correlated with the data density and that variations in the symmetropy were largely anti-correlated with both. Both measures detected the presence of localized patterns, and symmetropy distinguished a strong pattern formation not related to density, suggesting a possible shift in the conflict dynamics.
Introduction
It has been demonstrated that the current conflict in Afghanistan exhibits characteristics of a critical system [1] such as fractal behaviour in the temporal domain [2]. This underscores the requirement to address the possibility of the existence of fractal patterns [3] and, more specifically, symmetries in the spatial domain.
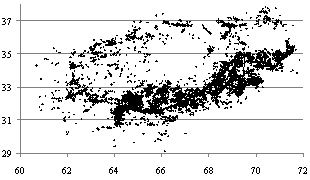
This paper outlines the use of two quantities that have been shown to be effective in describing the spatial patterns (fractal dimension [4]) and symmetries (symmetropy [5,6]) of systems that display nontrivial spatial patterns and that are regulated by fractal statistics. These two quantities are applied to the geographical distribution of the violent incidents in Afghanistan (Figure 1) between 2006 and 2009. The dominant feature is the concentration of incidents along the Ring Road. North corresponds to the vertical axis. Note that this investigation is intended only to explore general relationships between the two quantities and important features of the conflict—any linkages to the critical behaviour of the system are not made explicit here, and are left for future work.
An important point that needs to be addressed here is the potential dependence of the spatial characteristics on the density of the events. This is especially true since the incident counts in Afghanistan are a non-stationary series. Figure 2a shows daily counts of violent incidents for Afghanistan. These daily counts have two components. One is the seasonal trend (increase in the incident counts for the summer months), and the other component is an increase in the average counts from year to year.
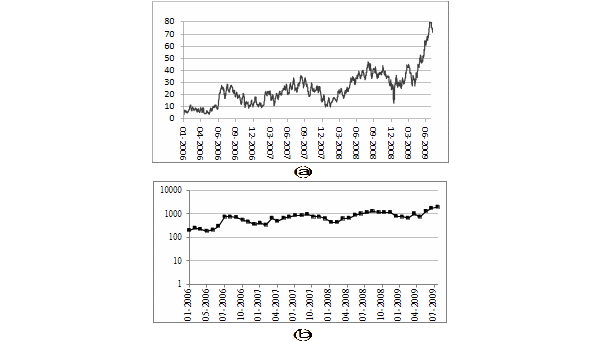
The monthly incident counts, displayed on a log scale, are shown in Figure 2b for reference in subsequent sections.
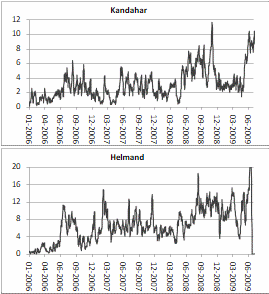
Figure 3 shows the daily counts for Kandahar and Helmand provinces. The seasonal trends are less pronounced than in the case of the Afghanistan as a whole. This is likely due to the fact that the impact of winter in the southern region is not as severe as in other areas of the country.
The paper is organized as follows. At first, the two quantities in question, symmetropy and fractal dimension, are briefly described and their computations summarized. Then symmetropy is used to analyze spatial symmetries in the incident data from Afghanistan and non-trivial changes are correlated with major events in the history of the conflict. Since there is a dominant circular symmetry that is clearly identifiable in the data (caused by the main communication route—the ‘Ring Road’), two transformations are proposed to enable the analysis of symmetries in a coordinate system that ‘unravels’ the roadway in such a way that it is (roughly) a vertical line dividing a rectangular space, with left to right in the rectangle mapping points inward to outward in the ring, respectively.
The two results, transformed and untransformed, are compared and the implications of commonalities and differences are discussed. Then the process is repeated for the fractal dimension. In this case, since the fractal dimension is primarily a measure of the clustering and spatial coverage (dimensionally) of the data, it is reasonable to expect that the dominating circular symmetry should have little effect on the results. Consequently, the fractal dimension for both the original and transformed data should yield almost identical results. On the other hand, there is no a priori reason to expect that symmetropy would remain invariant under such a transformation due to the fact that spatial symmetries in the data could easily change shape in a new coordinate system. The idea behind unravelling the roadway is that patterns observed in the transformed data depending on the roadway may be easier to interpret.
Symmetropy of the incidents
Symmetropy is a form of Shannon entropy that measures the combined symmetry and entropy of a given two-dimensional intensity map [5]. It captures not only the spatial distribution, but the symmetry of the distribution as well. The definition of symmetropy utilizes a two-dimensional Walsh transformation for battlefield divided into M×M cells, where M=2q (the value q=2 is employed in this paper). This transformation projects out the analyzed pattern with respect to four principal symmetries: vertical, horizontal, centro (also known as diagonal), and double symmetry (vertical and horizontal). The strengths of the pattern symmetries relative to this four-component basis are combined using the Shannon’s formula for entropy S = −(1/2)∑Pklog2Pk applied to the probabilities Pk of the pattern being projected into a principal symmetry k to provide an overall measure of symmetry in the pattern. The 1/2 factor normalizes the symmetropy so that the maximum value is one, corresponding to complete randomness1.
A drop in symmetropy corresponds to the detection of a dominant symmetry in the pattern. Zero is the minimum value, corresponding to an exact match to an element of the pattern basis. Symmetropy has been used to analyze spatial patterns relating to self-organized criticality (SOC) arising in sand-pile cellular-automata [5] and geologic fault propagation [6].
The incident data from Afghanistan were aggregated by month to enable calculation of the spatial patterns. The calculations were conducted for the violent events for Afghanistan as a whole and then for Helmand and Kandahar provinces separately (the majority of the events happened in these two provinces). The symmetropy results for the violent incidents in the entire country are shown in Figure 4, and for Kandahar and Helmand provinces in Figure 5.
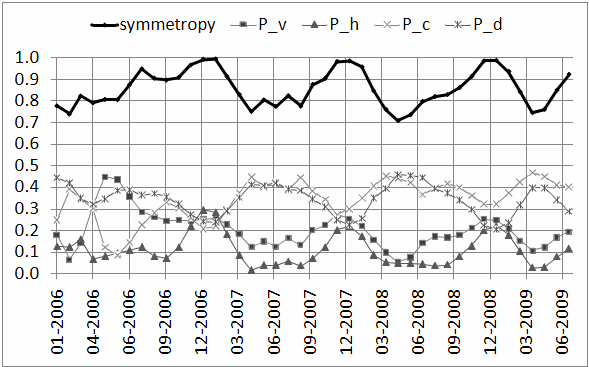
In the case of Afghanistan as a whole, the symmetropy seems to reflect the seasonal fighting cycle, with the winter (off-season) incidents distributed more or less randomly and symmetry breaking, regarded as pattern formation, evident each fighting season (May-June). Some interesting insights can be gleaned by examining the individual symmetropy components (Figure 4). Initially, the dominant symmetries appear to be varying wildly, suggesting shifting emphasis in diverse parts of the country, likely mostly between east and south. Over the last two and half years, corresponding to the ‘periodic’ portion of the overall symmetropy, the symmetry components stabilize, with horizontal and vertical symmetries dropping and the centro and double symmetries increasing synchronously. This is consistent with increasing focal points of activity in the south and east during the fighting seasons. Note that symmetropy does not provide information about the absolute numbers of the incidents, only about the relative densities of incidents spread across a geographical area. Consequently, the results suggest that the internal nature of the insurgency did not change in that sense over the period of 2007−2009. That is, the spatial pattern of behaviour seems to be persistent.
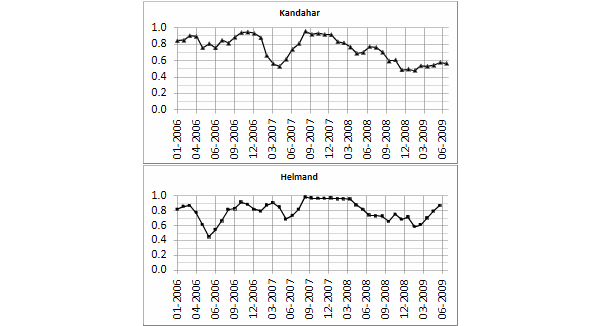
The symmetropies of the individual provinces of Kandahar and Helmand are shown in Figure 5. The two begin differently, with Kandahar displaying mostly random behaviour until late spring 2007 whereas in the case of Helmand there appears to be a sharp drop in the late spring of 2006. As of winter late in 2007, the events in Kandahar became decisively non-random (it is known that the activity at that time was mostly focused in the area west of the city), with Helmand following several months later, but rebounding in winter 2008/09. The rebound is much smaller in Kandahar.
In summary, the variations in the symmetropy are consistent (at least qualitatively) with the known major changes in the overall dynamics of the conflict.
Fractal dimension of the incidents
The fractal dimension more-or-less measures the minimum number of variables needed to specify a given fractal pattern [4]. The dimension of fractal data sets is commonly approximated using the box-counting (or capacity) dimension. It expresses the relationship between the size of a box ε and the minimum number N(ε) of boxes needed to cover all of the subject units. Generally, the dependence is a power law expression of the form N(ε) = (L / ε)DF, where DF is the fractal dimension and L is the size of the battlefield. The fractal dimension has been used in the context of combat modelling in a number of previous studies [3,4 and references therein]. It was used as one of the key coefficients linking temporal and spatial dynamics [3]. In general terms, the fractal dimension enables characterization of the clustering of the military forces and the resultant concentration of the firepower. In addition, it also captures the degree of distribution of forces across the battle space.
Figure 6 shows the fractal dimension results for Afghanistan as a whole. There are clear seasonal cycles present, with only minor inter-annual increases. While the annual cycles might be related to the seasonal increases in the incident counts (density), the fact that the fractal dimension is close to 1 with a very limited annual increase despite the strong increase in the incident counts might suggest that the geographical distribution of the incidents is located predominantly along linear structures such as roads.
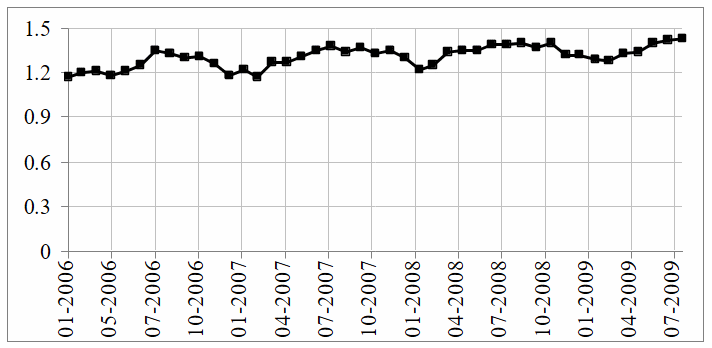
The pattern of rise and fall in the fractal dimension mimics that of the density shown in Figure 2b. Indeed, the two data series are highly correlated. Random patterns are distinguished from the observed variations through a decrease in fractal dimension, indicating that the observed pattern is less space-filling than a random one at the same (monthly) density and covering the same area (Figure 7). This merely asserts that certain localized geographic features lend themselves to violent activities more than others (that is, heavily populated areas vs. sparse areas, easily accessible areas vs. difficult to access areas, and so on).
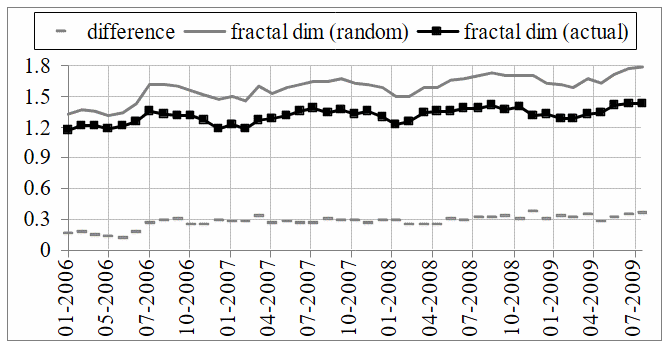
Initially, the difference between the fractal dimension of the random sets and that of the data was ~0.15. This difference rose to ~0.3 around July 2006 and persisted at that level for the remainder of the data set. The change was also evident using a relative measure of the deviation from randomness, namely (Drndf – Df) / Drndf, where Drndf is the mean fractal dimension of the random data set (10 iterations) and Df is the observed fractal dimension (not shown). The timing of the departure from randomness is consistent with the ‘locking in’ of symmetropy components to a persistent seasonal pattern (recall Figure 4).
The fractal dimensions of both Kandahar and Helmand display a pattern of behaviour similar to that measured for violence across the entire country (Figure 8).
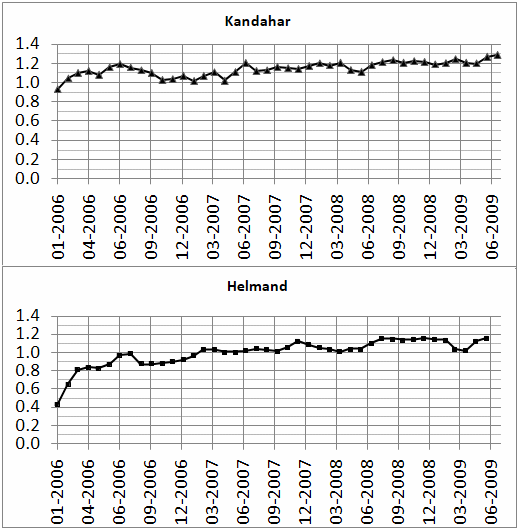
For Kandahar, as of mid 2006, the initial variations more or less stabilized between 1.0 and 1.2 with a slight positive slope, implying possibly that most of the violence happens along linear features, likely main communication lines (which is corroborated by direct analysis of the incident distribution). In the case of Helmand, the fractal dimension of the violent events started fairly low and increased very quickly to the values around one, with slight seasonal variations and a slight average increase over long timescales.
Transforming the incident space
One of the challenges of the subject ‘real-world’ data set is that there are several characteristic qualities that are driven by geography, communication networks (roads) and other map features rather than by the complexity of the mutual interactions. Thus spatial patterns that arise are constrained by or even embedded within these features. In the case of Afghanistan, one of the key map features is the ring road, and consequently the incidents reflect predominantly circular symmetry. To enable a clearer view of the spatial distribution apart from this dominant feature, the incident data were transformed into a more rectangular pattern. At first, the distance scale was normalized so that the Ring Road corresponded approximately to a unit circle. Then two transformations were applied and analyzed. The first was a conformal mapping of the form z = ln(w), where w = u + iv for normalized event coordinates (u,v) (Figure 9 (top)). The second was a signed distance map that computed the minimum distance of each event from the ring road. Negative distances were assigned to locations within the road boundary and positive distances for exterior locations (Figure 9 (bottom)).
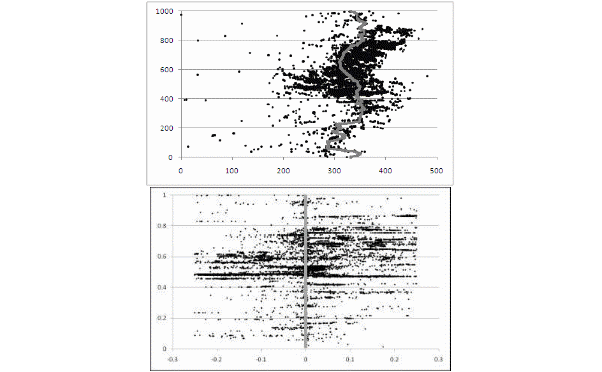
Both transformations cut the circular shape and stretch it into a rectangle. The top and bottom correspond to the North, and the centre corresponds to the South. The horizontal distribution of the events extends from the centre of the country to a border (on the right). Note that for the signed distance map, the events shown lie within a buffer zone centred on the road (that is, a band of width ~100 km).
Symmetropy and fractal dimension in the transformed incident space
As expected, the fractal dimension in both of the transformed spaces matched the results obtained in the original space. Therefore it will not be discussed here any further. Also, the symmetropy results for both transformations were nearly identical to one another (although not to the untransformed results), so they are collectively referred to as ‘the transformation’ in what follows.
The results for the symmetropy (Figure 10) are slightly different for the transformed and original data series, in particular with respect to 1) the strength of the symmetry breaking (structure formation) and 2) the component relationships. The overall pattern of rise and fall, however, is largely conserved, thus the bulk of the conclusions drawn from the untransformed case are mirrored in the transformed case. The strength of the symmetry breaking and amplitude of variation is significantly greater in the transformed case, however, suggesting that it helped to bring out the underlying pattern. It is interesting to note that an apparent randomness of the pattern in December of each year (symmetropy ~1.0) translated to an identifiable structure in the transformed case (symmetropy ~ 0.6−0.8).
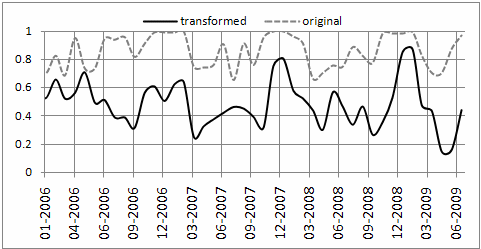
However, there were two notable differences in behaviour between the transformed and untransformed case. The first was a drop in the symmetropy of the transformed data in summer 2006. This drop contrasted with the original case wherein symmetropy increased at this time. Later, in both cases the pattern seems to have settled into seasonal variations. Another notable, albeit short-lived, difference occurs in July 2007, where a dip in symmetropy in the untransformed case, following the pattern of anti-correlation with data density, is not evident in the transformed data.
In terms of symmetropy components (Figure 11), an obvious shift is evident—the meaning of the centro symmetry is changed, since the incidents that were originally across the mid-point were moved to the same area of the transformed space. The centro-symmetry component now seems to mimic the pattern of symmetropy, apart from exhibiting smaller-scale oscillations. The dominant component after the transformation is still double symmetry, displaying the same opposing trend to that of the overall symmetropy as observed in the untransformed case. The other important component seems to be vertical symmetry, and spikes in the overall symmetropy seem to be driven partly by increases in the vertical symmetry that balance against decreases in double symmetry.
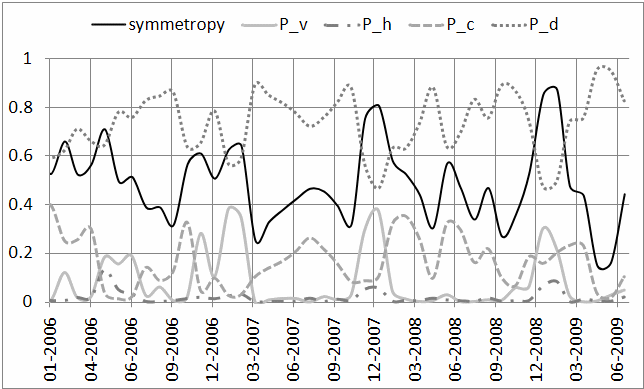
In summary, a key transition that might have been related to the internal conflict dynamics rather than geographically dominant features seem to have happened in early 2006. This approximately coincides with the expansion of ISAF over most of Afghanistan, including the southern provinces, and the subsequent increase in the insurgent activity in the south. For example, a major Canadian operation against Taliban took place in summer 2006. It is also possible that secondary map features, no longer as well hidden by the dominant Ring Road symmetry, became more prevalent in the transformed case. To a lesser extent, there appears to be some movement towards randomness above and beyond what would be expected in July 2007. The other variations appear to be either a) seasonal or b) driven by the geographical structure of Afghanistan.
Consistency and complimentarity of fractal dimension and symmetropy
The findings for symmetropy and fractal dimension presented in the previous three sections demonstrate that these two quantities can be used together effectively to illuminate some important features or transition points in the spatial nature of a conflict.
A common feature to both the fractal dimension and symmetropy is the seasonality of the changes over the 2006-2009 period. This periodicity suggests a repeated variation in the dynamics with the fighting seasons, and that there is no systematic change in the internal system dynamics over this period.
The opposing values computed for symmetropy and a dominant symmetry component, in this case double symmetry, are expected based on the mathematical relationship between the two quantities. The opposing values computed for symmetropy and the fractal dimension, however, are not expected. Interpreted together, they suggest that spatial patterns captured by symmetropy are spread throughout an underlying map pattern resolved at varying degrees of data density, whereas when approaching randomness (that is, no ‘pattern’) the patterns become more isolated and point-like (less space-filling, lower density). This is consistent with operations conducted along key geographical features such as roadways, valleys, and so on.
As a final note on the combined interpretation, it is interesting that the double symmetry component and the fractal dimension both oppose symmetropy, which puts the former two quantities in a curious position of synchronicity. To date, the nature of this relationship has not been fully explained.
Conclusions
Symmetropy and fractal dimension were calculated for violent incidents from Afghanistan. For the entire Afghanistan data set, a transformation was introduced in order to remove the dominant influence of the main communication route (Ring Road). In addition, symmetropy and fractal dimension were calculated for the incidents in Kandahar and Helmand provinces.
Overall, both symmetropy and fractal dimension worked efficiently to capture key changes in the conflict dynamics, and they provided some interesting insights into the seasonality of the incidents.
Future work
In some previous studies [5,6] it was suggested that there might be a strong connection between symmetropy variations and critical behaviour of dynamical systems. Since there were previous studies [1] suggesting that the conflict in Afghanistan exhibits properties of a near critical system, it is desirable to further explore the relationship between criticality and symmetropy. This will be pursued in follow-on work. In addition, it is hoped that more recent data will become available, enabling deeper insights into possible changes in the system dynamics driven by the surge in 2009/2010.
References
[1] P. Dobias, “Self-organized Criticality in Asymmetric Warfare”, Fractals, Vol. 17, No. 1, 2009, pp. 91−97, DOI: 10.1142/S0218348X0900417X.
[2] P. Dobias and K. Sprague, “Intermittency of Casualties in Asymmetric Warfare”, Journal of Battlefield Technology, Vol. 12, No. 1, 2009, pp. 19−25.
[3] M.K. Lauren, “A Fractal-Based Approach to Equations of Attrition”, Military Operational Research, Vol. 7, No. 3, 2002, pp. 17−30.
[4] A. Ilachinski, Artificial War: Multiagent-based simulation of combat, World Scientific, 2004.
[5] K. Nanjo, H. Nagahama, and E. Yodogawa, “Symmetropy and self-organized criticality”, Forma, Vol. 16, 2001, pp. 213−224.
[6] K. Nanjo, H. Nagahama, and E. Yodogawa, “Symmetropy of fault patterns: Quantitative measurement of anisotropy and entropic heterogeneity”, Mathematical geology, Vol. 37, No. 3, 2005, pp. 277−293.