
Volume 13, Number 2, July 2010
Laboratory Investigation Of Layered Aluminium Mesh For Blast Mitigation Purposes Using An Arena Setup
- 1 University of Kentucky, Department of Mining Engineering, 230 Mining and Mineral Resources Building, Lexington, KY 40506.
Abstract
The blast mitigation properties of an Explosafe aluminium mesh product have been evaluated using scaled arena tests. The blast mitigation abilities of the aluminium mesh were characterized and several specific conclusions were drawn from the data. First, the aluminium mesh reduced free-field pressure and impulse increasingly as the number of layers of mesh was increased. Also, pressure reduction and impulse reduction displayed contradicting behaviours, thus a design trade-off exists between pressure reduction and impulse reduction. As scaled distance increases, impulse reduction increases while pressure reduction decreases. For 20 layers of mesh at scaled distance 7.6, the pressure and impulse reductions converge at approximately 28%. This is quite an impressive reduction for such a lightweight and easy to handle material. This design tool was created utilizing the first two test methods. These tests began to investigate a lightweight blast mitigation option for the field.
Introduction
Research conducted by the manufacturers of an aluminium mesh product called Explosafe (Figure 1) has demonstrated that the product is capable of reducing acceleration peaks, pressure peaks, and deformations resulting from blast shock waves. The aluminium mesh acts via three mechanisms: 1) dividing the shock wave into smaller cells introducing high shear rates therefore inhibiting the propagation of the shock wave [1,2]; 2) absorption of heat as the wave front passes through the mesh (Explosafe); and 3) reflecting part of the shock wave, reducing the energy of the propagating wave [1]. Typical aluminium mesh applications include insertion into fuel tanks to reduce blast and shock damage from projectiles and fires. Research conducted by the United States Air Force led to specification of this mesh by the Air Force and all Agencies of the Department of Defence for application in fuel tanks (Military Spec). Aside from military applications, current users of Explosafe’s product include petrochemical, automotive, and maritime industries (Explosafe). One objective of this project is to evaluate the mesh as blast suppression on the undercarriage of military vehicles, but first explosive mitigation properties had to be observed and quantified in a controlled environment.
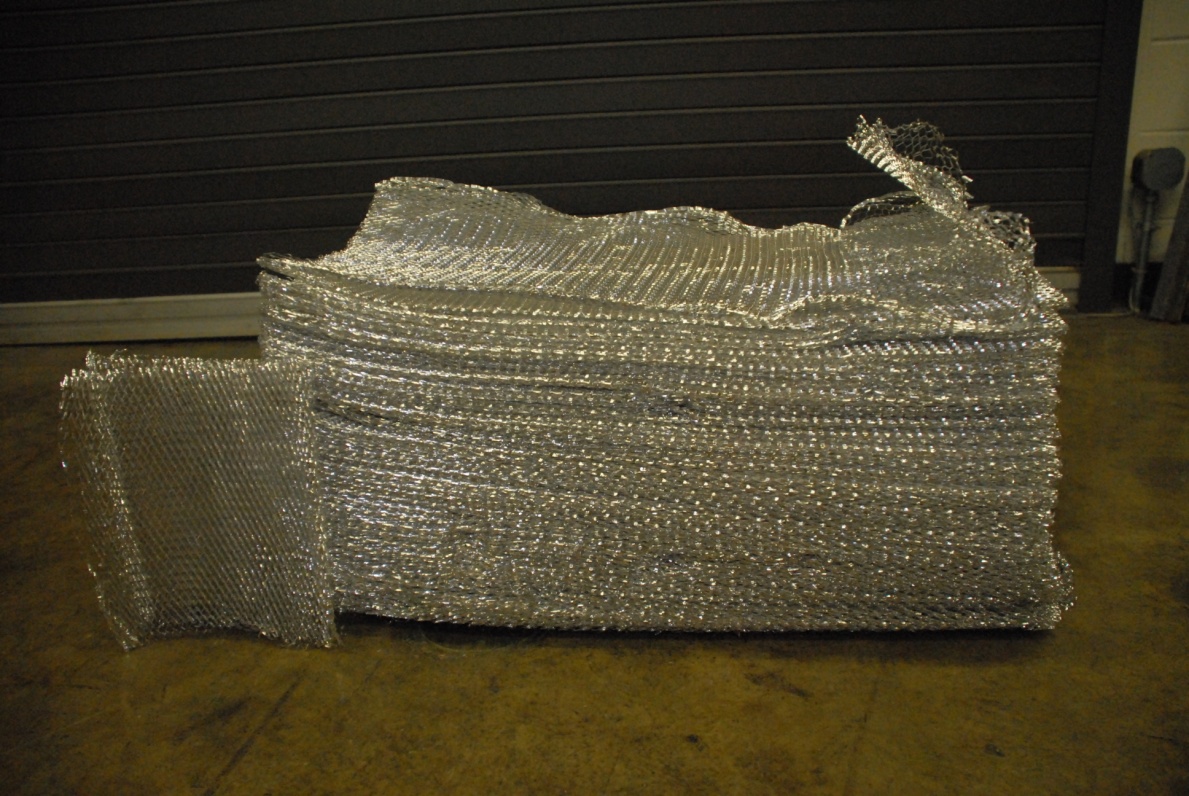
The mesh consisted of 0.004 inches thick aluminium with hexagonal pores 0.06 inches wide. Figure 1 shows a stack of 12 inch × 12 inch mesh samples. These are ideal dimensions and after the mesh was handled the mesh’s pore dimensions were unavoidably deformed.
Scaling studies of shock waves
Ma and Ye [3] reported a limited study on the shock energy absorption of layered (aluminium) foam cladding in 2006. Unfortunately, limited information could be gleaned from this paper and the data was inaccessible [3]. It is assumed that useful literature pertaining to this project exists in the classified work; however, this information was not available to the research team.
There have been multiple studies performed on scaling explosive charges and shock waves [4−8]. The most general and commonly used scaling technique is the Hopkinson scaled distance as described in the ISEE Blasters’ Handbook [9]. Other scaling studies have been performed to account for temperature and pressure differences in the atmosphere surrounding the charge [5,6]. The tests performed for the study described in this paper were performed underground where pressure and temperature were relatively constant [10]. The Hopkinson (cube root) scaling equations were suitable for this application. The units for scaled distance (SD) are ft/lb^0.33 [11].
Work at the University of Kentucky (UK) in 2006 by Grulke and Kitigawa showed that expanded aluminium mesh could reduce blast overpressure. Results from scaled tests with black powder charges have shown that modest thicknesses of layered aluminium mesh reduced shock wave pressures from explosions. At scaled distances near 1.5, overpressure could be reduced by approximately 70% for a 3-cm thick assembly of 20 layers of mesh. Commercial suppliers of aluminium mesh systems have reported good energy absorption in larger scale tests (4 ft × 4 ft unit (“Blastwall”) sections with dynamite), but there is insufficient information to determine what design methods might be used to develop reliable blast mitigation systems.
Layered aluminium mesh systems could be a lightweight, low cost method for mitigating blast damage to architectural structures or vehicle panels. A series of tests at different blast and scaled distances could provide a basis for design methods. Modelling of the blast mitigation process by computational fluid mechanics could be coupled with the experiments design described to provide improved theoretical understanding for how blast overpressure is reduced, and form a fundamental basis for design rubrics.
The study reported in this paper is a more complete analysis of the blast mitigation properties of the aluminium mesh. The testing methods and results described in later sections of this paper show the ranges of performance and possible applications for the mesh. The list provided above served as a basis for designing a project that would further characterize the mesh. The previous experiments were performed on a small scale with relatively low-energy charges over a very small range of scaling dimensions. The tests included in this paper consist of series of arena tests conducted at scaled distances of 5 ft/lb^0.333 (SD 5) and 7.6 ft/lb^0.333 (SD 7.6) for 0.35 ounce and 1.4 ounce charge sizes.
Recent global events have prompted blast mitigation research using novel materials and techniques. Fundamental research is necessary to quantify the effectiveness of these proposed methods. The test series performed for this project utilized high explosives in an attempt to replicate live situations as closely as possible. Shrapnel and fragment resistance was not evaluated in this project; however, it is believed that the ballistic resistance of this product would be relatively low. Although a potential use could be for premature detonation of incoming shaped charge penetrators.
Methods for assessing blast mitigation
This paper discusses the use of scaled arena tests to characterize the performance of the aluminium mesh when subjected to blast loadings.
In an arena test, the charge is placed in the centre of an open area, and free-field pressure sensors and test samples are located at specified distances from the centre of the explosives. The shock wave detected at a specific sensor has all the variations inherent due to shape, burn rate, and so on.
Small charges, 0.35 oz in size, were used in an arena test environment to produce high frequency shock waves so mitigation properties of the mesh could be determined. Due to the small scale of the charges, there was significant variability in shock wave shape and overpressure. A larger charge size, 1.4 oz, was used to reduce shock wave and overpressure variability, as discussed later in this paper. The high frequency shock waves produced in arena experiments produced substantial peak free-field pressures (10−33 psi) with instantaneous rise times (dP/dT was large). However, with small charges, the positive phase durations (0.5−1.0 ms) were very short and did not impart much impulse (psi-ms) onto the aluminium mesh.
Experimental setup
Arena tests
The photographs in Figures 2 and 3 show four piezoelectric free-field sensors located at equal distances from a suspended RDX charge. The distances were measured from the centre point and marked on the wooden support structure. A plumb-bob was then used to precisely locate the sensor element at the correct distance. A single sensor was set at an arbitrary height (although far enough from the ground that spherical expansion of the blast wave could occur all the way to the mesh and sensors) from the ground and then a laser level was used to adjust the remaining three sensors to the same elevation.
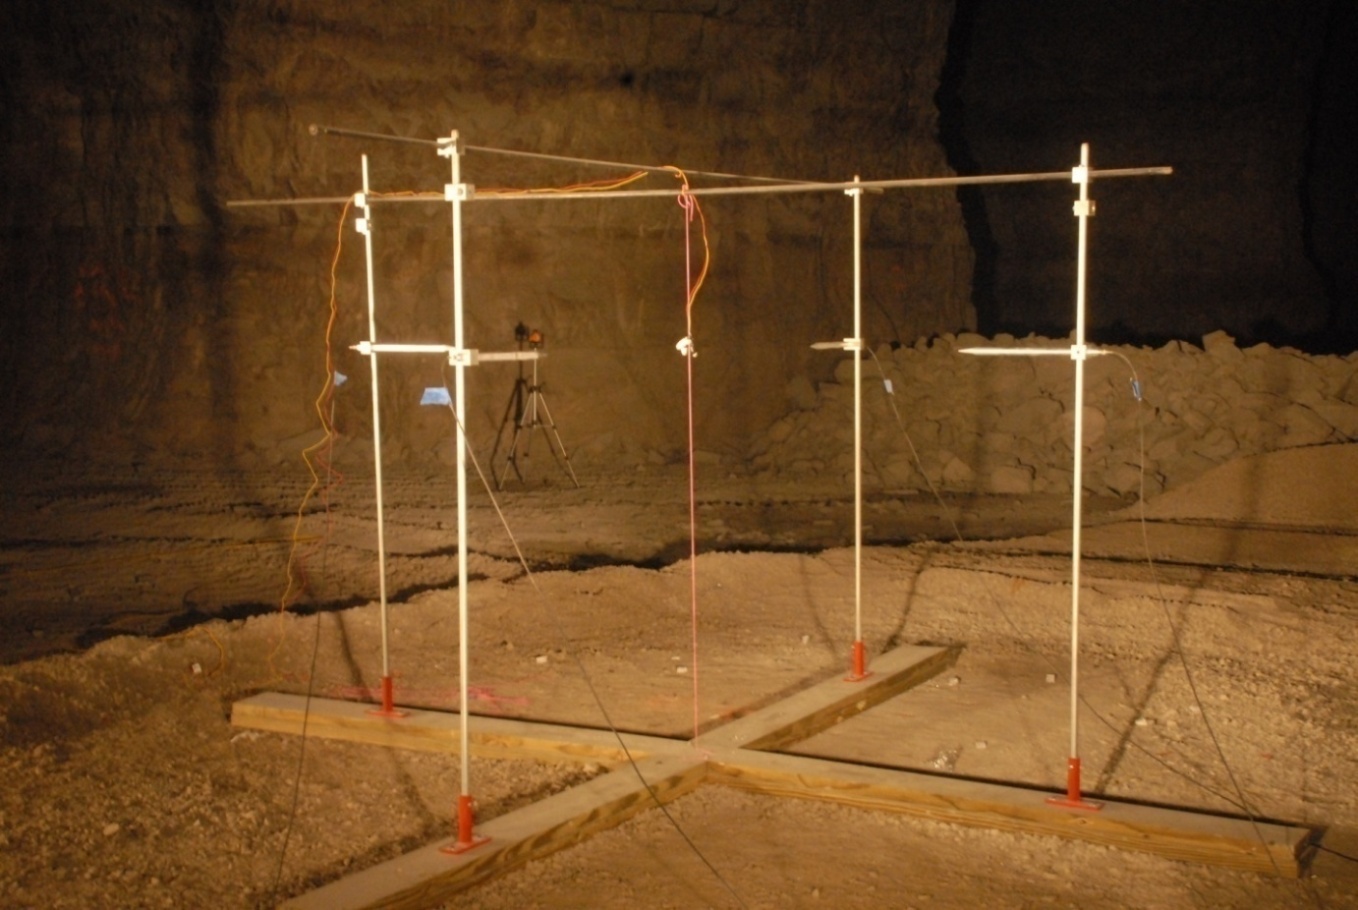
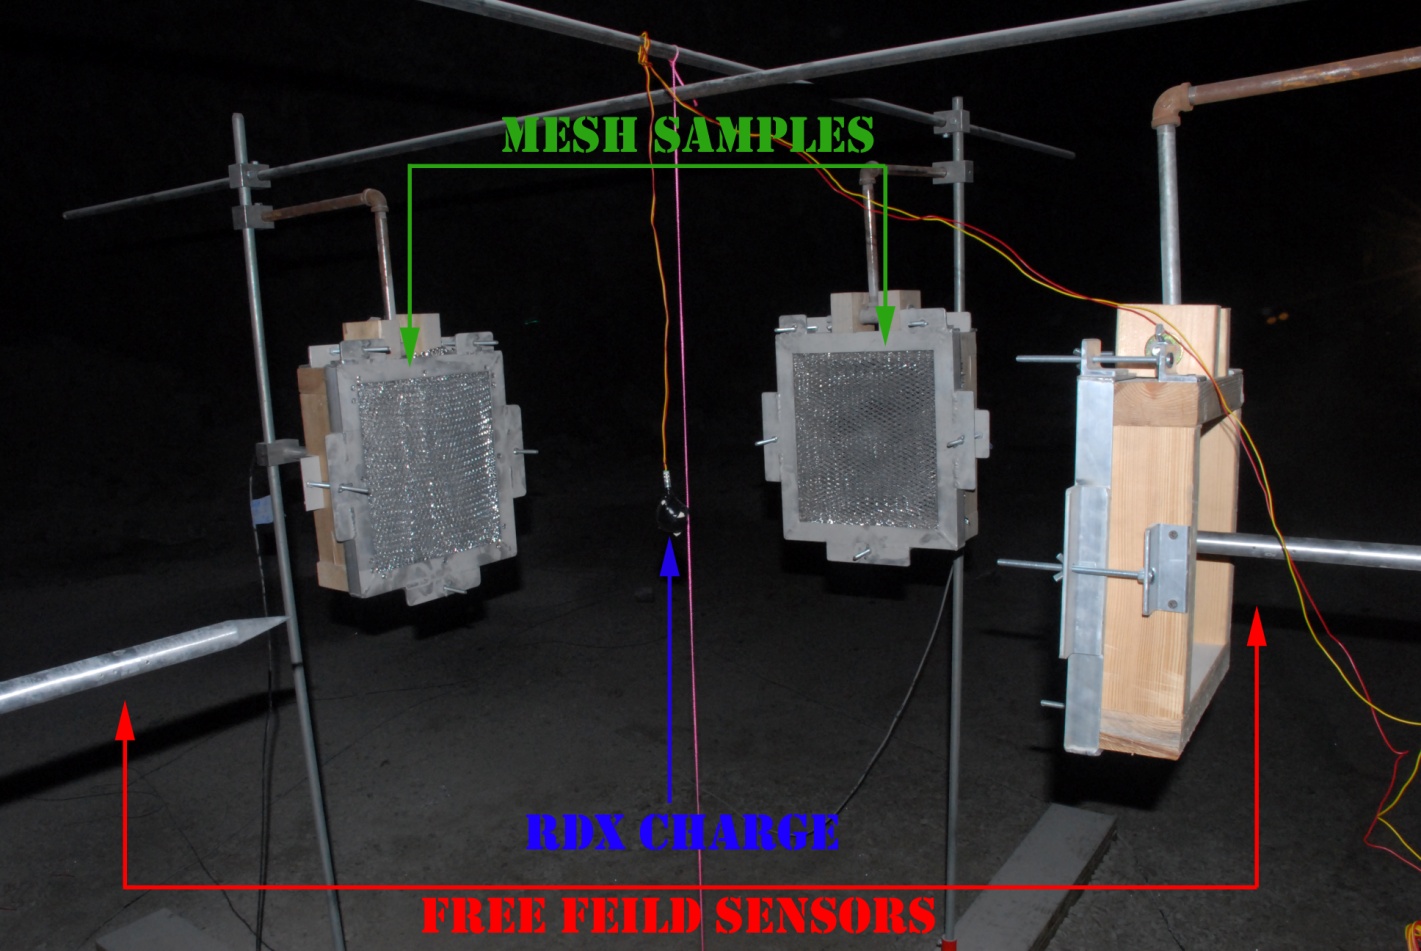
Three different configurations of the aluminium mesh were used in the arena test, 5 layers, 10 layers, and 20 layers. The experimental setup was designed so that each individual test would provide a comparison of performance between the different layer thicknesses to a sensor with no mesh interference. Once the series was complete, sets of tests were compared across similar layer configurations. This method is preferred because some of the error associated with charge size and performance can be accounted for statistically while still providing direct comparison of different layer configuration.
Prior to testing the aluminium mesh, several ‘blank’ tests were performed for each scaled distance value and charge size to assure similar free-field pressure measurements for all sensors, therefore confirming the charge was located in the exact centre of the sensors. The blanks were performed to provide some information on the repeatability of the experiment.
The arena test series followed the matrix in Tables 1 and 2. Initially, ten tests were planned to be performed for each arena test series. The small explosive charge size gave free-field pressure curves with high variability. Six blank tests were performed at 0.35 ounce SD 5 to evaluate the difference in time of arrival data and pressure effects of the fireball engulfing the sensors.
| Mesh Layers | |||||||
|---|---|---|---|---|---|---|---|
| Charge Size (oz) | Scaled Distance | Sensor 1 | Sensor 2 | Sensor 3 | Sensor 4 | Number of Tests | Blank Tests |
| 0.35 | 5 | 0 | 5 | 10 | 20 | 7 | 6 |
| 0.35 | 7.6 | 0 | 5 | 10 | 20 | 12 | 2 |
| 1.4 | 5 | 0 | 5 | 10 | 20 | 10 | 2 |
| 1.4 | 7.6 | 0 | 5 | 10 | 20 | 15 | 2 |
| Table 2. Arena test matrix scaled distances. | |||
|---|---|---|---|
| Charge Size (oz) | Charge Size (lb) | Scaled Distance (ft/lb^0.333) | Distance (ft) |
| 0.35 | 0.0219 | 5.0 | 1.41 |
| 0.35 | 0.0219 | 7.6 | 2.12 |
| 1.40 | 0.0875 | 5.0 | 2.22 |
| 1.40 | 0.0875 | 7.6 | 3.37 |
| Table 3. Summary of 0.35 oz SD 5. | |||||
|---|---|---|---|---|---|
| Mesh | Ave Pressure (psi) (± standard deviation) | Ave Impulse (psi-ms) (± standard deviation) | Reduction of Average Pressure | Reduction of Average Impulse | |
| 0 | 26.960 ± 5.726 | 2.788 ± 0.453 | X | X | |
| 5 | 22.594 ± 4.986 | 3.391 ± 0.474 | 16.19% | −21.62% | |
| 10 | 21.668 ± 4.177 | 3.309 ± 0.655 | 19.63% | −18.68% | |
| 20 | 16.554 ± 2.951 | 2.452 ± 0.297 | 38.60% | 12.04% |
| Table 4. 0.35 oz SD 5 additional pressure statistics (per test pressure reductions). | ||
|---|---|---|
| Mesh | Average Pressure Reduction (psi) (± standard deviation) | Average Percentage Reduction in Pressure (± standard deviation) |
| 5 | −0.216 ± 6.582 | −5.78% ± 29.49% |
| 10 | 0.709 ± 5.537 | −1.44% ± 24.83% |
| 20 | 5.824 ± 5.669 | 22.33% ± 20.22% |
Wood frames were constructed with aluminium overlays to securely fasten the mesh samples that were 12 inches × 12 inches in size. The frames were adequate to secure the mesh in front of the free-field pressure sensors; however, ensuring uniform thickness of mesh on all tests was not possible. The plates securing the mesh in place were tightened by hand and care was taken to ensure consistency, but the mesh thicknesses would vary depending on the level of tension in the carriage bolts holding the face plates in place. These frames were then positioned so that the aluminium mesh was slightly in front of the tip of the pencil shaped free-field gauges. Once the mesh was installed and the wooden frames were secured, the charge was hung and the test setup was complete. The height and location of the sensors was similar to the blank tests as previously described.
After detonation, signals produced by the sensors were recorded on an MREL DataTrapII data acquisition system. The signals from the free-field sensors were converted to free-field pressures using calibration sheets provided by the sensor manufacturer. The free-field pressure measurements and impulse calculations were tabulated to find trends from the testing.
Impulse is an additional way to characterize blast energy. Impulse was calculated for each data set and then averaged for each data series. Larger charges created longer waveforms and thus higher impulses. Scaled distance is a common method for generating approximately similar peak free-field pressures, but larger charges provide larger impulses at similar scaled distances.
The small charges used in the arena tests generated waveforms with a short duration. Longer duration pressure waves were also evaluated to determine a performance range for the aluminium mesh. Collection of data with longer duration waveforms was required in order to assess the aluminium mesh performance in reducing impulse. The duration of the wave is thought to have a significant effect for both pressure and impulse reduction. Larger charges at greater distance would prove to be more repeatable and statistically sound.
Results
Arena Data Analysis
The first test series was the 0.35 ounces of RDX with the sensors set at SD5. This test set consisted of seven experiments with mesh located directly in front of three of the sensors and no mesh in front of one sensor. Six additional tests were performed with no mesh to ensure consistent pressures for each of the four sensors. For SD 5, the 0.35 oz charge created a fireball that engulfed the entire sensor as evident by the high speed video of the tests. To assure data was not affected by this, four of the blank tests used blue painters tape over the sensor element. After analyzing all blank tests, it was found that the fireball did not affect the data so the tape was not used again. Table 3 gives a quantitative summary of the test series. The table reports average free-field pressures and standard deviations for all of the mesh configurations tested. Pressure reduction percentages are also tabulated as a tool for comparison across scaled distances and charge sizes since pressure ranges and durations differ depending on these parameters. Percent reduction however is a dimensionless comparison. For each test, the average free-field pressure reduction was calculated in two ways. First, as presented in Table 3, the average free-field pressures were calculated first and then the reductions were based on the average free-field pressure values. The second method, as presented in Table 4 calculated the free-field pressure reduction percentage for each test, and then averaged those values. The average free-field pressure data shows a nice reduction as more layers of mesh are added; however impulse data is not as easy to interpret.
The data from the seven tests where mesh was used was investigated further. Table 4 shows the results when pressure reductions were taken by a test by test basis with the standard deviation. Close distances and explosive charge phenomena are clearly present in the data. The difficulty in charge construction and placement yielded results not consistent with the three other arena test series. This yielded a wide range of pressures experienced and expected for future tests. Table 3 averaged the free-field pressures first and then calculated the reductions while Table 4 calculated the reductions for each test first and then averaged.
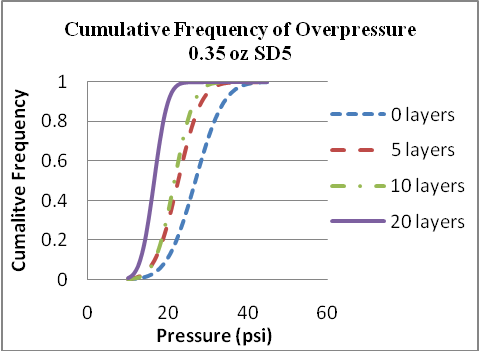
Due to the large discrepancy in percentage reduction for pressure based on the two different calculation methods, cumulative frequency charts were assembled to determine which method would generate the most quality assumptions. After all the data from the 13 tests were analyzed, charts showing the effectiveness of the mesh were created. As seen in Figures 4 and 5, the mesh consistently reduced the peak pressure as layers of mesh were added, but this was not the case for impulse. Figure 4 shows a distinct difference in pressure reduction as mesh layers increase. The impulse reduction shown in Figure 5 does not correspond to an impulse reduction as mesh layers increase. This is evident in the scaled distance two data sets where human error is magnified. The lack of impulse reduction for the five and ten layer configuration could be due to inconsistencies with mesh hole alignment where it is possible that there is not a constant porosity through the entire mesh block. This would be more evident in the five layer configuration and become less evident as mesh layers are added. The steep slopes of the lines show that the data is well distributed. The steeper lines equate to smaller standard deviations and provide a visual comparison of the repeatability of the data sets. It is noteworthy that the 20 layer curves are steeper than the other curves. This suggests that the pressure wave is normalized somewhat as it travels through the mesh.
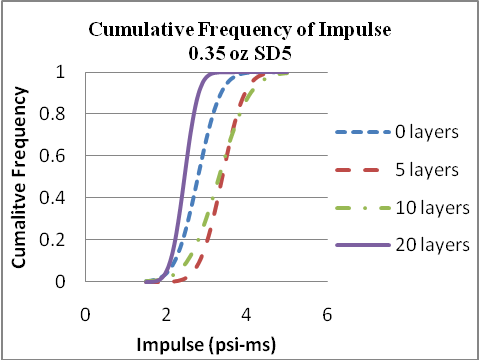
Statistically, this data is not very sound. More repeatable data was necessary to draw conclusions.
| Table 5. Summary of 0.35 oz SD7.6. | ||||
|---|---|---|---|---|
| Mesh | Ave Pressure (psi) (± standard deviation) | Ave Impulse (psi-ms) (± standard deviation) | Reduction of Average Pressure | Reduction of Average Impulse |
| 0 | 10.568 ± 2.129 | 1.897 ± 0.267 | X | X |
| 5 | 9.307 ± 1.775 | 1.822 ± 0.345 | 11.93% | 3.95% |
| 10 | 8.608 ± 1.585 | 1.698 ± 0.284 | 18.55% | 10.49% |
| 20 | 6.893 ± 1.322 | 1.492 ± 0.202 | 34.77% | 21.35% |
| Table 6. 0.35 oz SD7.6 Additional Pressure Statistics (Per Test Pressure Reductions). | ||
|---|---|---|
| Mesh | Average Pressure Reduction (psi) (± standard deviation) | Average Percentage Reduction (± standard deviation) |
| 5 | 1.342 ± 1.094 | 12.02% ± 9.26% |
| 10 | 2.041 ± 1.556 | 18.23% ± 11.88% |
| 20 | 3.756 ± 1.520 | 34.50% ± 9.33% |
The results from the analysis from the first data set show pressure reductions; but impulse reductions are not as evident. The analysis of the cumulative frequency curves also suggest that utilizing the reduction in average pressures may be more beneficial for determining the performance of the mesh.
The next set of data analyzed was the 0.35 ounces SD 7.6 experiments. The reduction in pressures is also evident in the scaled distance 7.6 experiments. Unlike the ten grams SD 5 experiments, the impulse reduction was more evident. The large impulse reduction percentage in Table 5 is slightly misleading since the impulse values are so small. Table 5 and Figures 6 and 7 show the relations ship of peak pressure and impulse to the number of mesh layers.
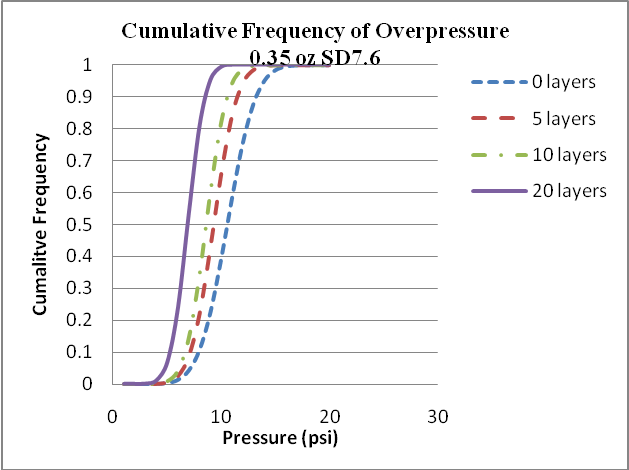
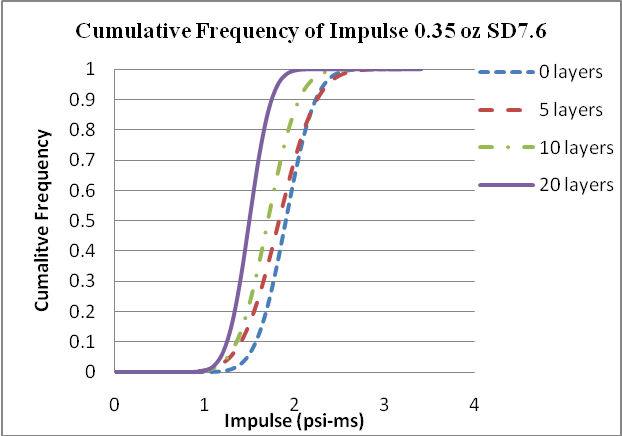
Further analysis of the 0.35 ounce SD 7.6 tests where mesh was present yielded better results than the SD 5 with the same charge size. The pressure and percentage reduction for each test performed was averaged (Table 6) rather than averaging the pressures and then calculating the reductions (Table 5). The percentage reductions agree well regardless of the method of calculation.
Figure 6 shows a tight grouping of values for each configuration of mesh with a decrease in pressure as mesh layers are added. Figure 7 shows a more evident impulse reduction as mesh layers increase when compared to the 0.35 oz SD 5 data set. The impulse reduction is believed to be more evident at larger scaled distances when using small weights of explosives. This is visible when comparing Figure 5 and Figure 7. Of particular interest is the location of the 0 mesh curves in relation to the other curves. In Figure 5, only 20 layers reduced impulse while Figure 7 shows that all mesh configurations reduce impulse. A possible explanation for this could be that impulse reduction is significantly affected by the duration of the pressure wave. Also, with small impulse and the involvement of the close distance effects, impulse reductions could be difficult to measure with the smallest charges.
| Table 7. Summary of 1.4 oz SD5. | ||||
|---|---|---|---|---|
| Mesh | Ave. Pressure (psi) (± standard deviation) | Ave. Impulse (psi-ms) (± standard deviation) | Reduction of Average Pressure | Reduction of Average Impulse |
| 0 | 33.011 ± 3.134 | 4.468 ± 0.412 | X | X |
| 5 | 27.515 ± 3.244 | 5.583 ± 0.274 | 16.65% | −24.96% |
| 10 | 24.712± 2.667 | 4.809 ± 0.571 | 25.14% | −7.63% |
| 20 | 23.455 ± 2.252 | 4.673 ± 0.445 | 28.95% | −4.59% |
The third set of data analyzed was the 1.4 ounces of RDX with the sensors set at a SD 5. This set of experiments followed the trend of the previous SD 5 tests. The peak pressures were reduced as layers of mesh were introduced in front of the gauges, but the impulse degradation was not evident. Table 7 shows the summary of the experiments as presented in previous data sets. Again, a trend can easily be seen in the pressure data, but not in the impulse data.
As with the 0.35 oz experiments; the data was further analyzed on a test by test basis. The pressure and percentage reductions for pressure in Table 8 correlate very well to Table 7 where the pressures were first averaged and then calculated for reductions. The ranges reported in the tables are the standard deviation of the data set.
| Table 8. 1.4 oz SD 5 additional pressure statistics. | ||
|---|---|---|
| Mesh | Average Pressure Reduction (psi ± standard deviation) | Average Percentage Reduction (± standard deviation) |
| 5 | 5.608 ± 4.541 | 15.82% ± 12.27% |
| 10 | 10.128 ± 3.735 | 29.15% ± 8.96% |
| 20 | 11.466 ± 3.450 | 33.15% ± 7.70% |
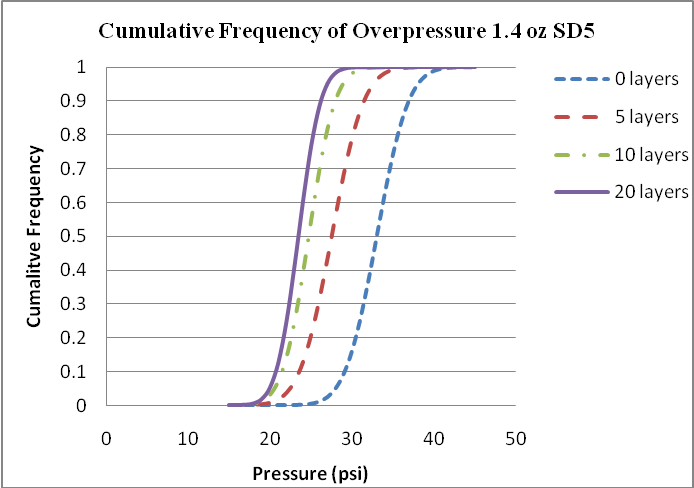
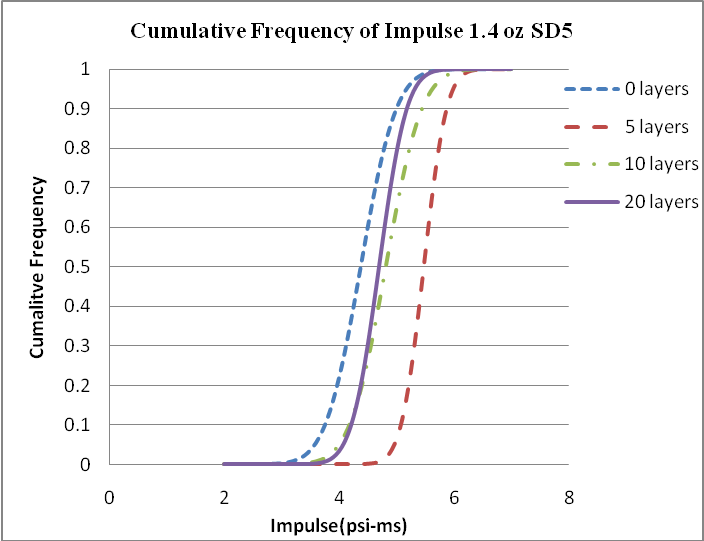
Figure 8 shows that pressure decreases as mesh layers are added in front of the gauge which is consistent with previous arena tests. The inconsistent impulse reduction from the addition of aluminium mesh layers, as shown in Figure 9, seen in the 1.4 ounces RDX SD 5 is also evident in the 0.35 oz RDX SD 5 arena tests. It is believed that the data from the SD 5 experiment sets magnifies the human error element in the experiments. It is not known why the lowest impulse generated was that of the zero mesh configuration. This is particularly interesting when the curves in Figure 9 are examined. The zero layer curve is substantially higher in pressure. This would suggest that the mesh layer may have pushed the peak pressure into a higher duration wave meaning that the lower pressure values would still have longer duration creating a larger impulse. This claim is unsubstantiated, and warrants more investigation. Since the 1.4 ounces SD 5 data set was the only set where 20 layers of mesh did not provide both pressure and impulse reduction. It is suggested that future tests be run with larger charges at close range to investigate the frequency reduction characteristic.
| Table 9. Summary of 1.4 oz SD 7.6. | |||||
|---|---|---|---|---|---|
| Mesh | Ave. Pressure(psi) (± standard deviation) | Ave. Impulse (psi-ms) (± standard deviation) | Reduction of Average Pressure | Reduction of Average Impulse | |
| 0 | 12.771 ± 1.233 | 3.272 ± 0.309 | X | X | |
| 5 | 12.542 ± 0.725 | 2.619 ± 0.151 | 1.79% | 19.96% | |
| 10 | 13.071 ± 0.501 | 3.161 ± 0.222 | −2.34% | 3.39% | |
| 20 | 11.090 ± 0.614 | 3.252 ± 0.570 | 13.17% | 0.61% | |
| Table 10. Summary of 1.4 oz SD 7.6 retest. | |||||
| Mesh | Ave. Pressure(psi) (± standard deviation) | Ave. Impulse (psi-ms) (± standard deviation) | Reduction of Average Pressure | Reduction of Average Impulse | |
| 0 | 13.860 ± 0.962 | 4.051 ± 0.187 | X | X | |
| 5 | 12.921 ± 0.468 | 3.542 ± 0.100 | 6.78% | 12.57% | |
| 10 | 11.710 ± 1.198 | 3.245 ± 0.106 | 15.51% | 19.90% | |
| 20 | 10.573 ± 0.414 | 2.740 ± 0.041 | 23.72% | 32.37% |
| Table 11. 1.4 oz SD 7.6 additional pressure statistics | ||
|---|---|---|
| Mesh | Average Pressure Reduction (psi ± standard deviation) | Average Percentage Reduction (± standard deviation) |
| 5 | 0.939 ± 1.221 | 6.38% ± 7.96% |
| 10 | 2.150 ± 1.909 | 14.96% ± 12.39% |
| 20 | 3.287 ± 1.323 | 23.32% ± 7.45% |
The initial ten test set performed for 1.4 ounces at SD 7.6 resulted in trends not consistent with the previous three sets of data. Since the data used in Table 9 showed an increase in pressure when using ten layers of mesh, a systematic error in data collection was suspected, so five additional tests were performed with 1.4 ounces with the sensors set at SD 7.6. The additional five tests gave results consistent with that of the previous three sets of tests, so they were used for the complete summary later in this section. The first set of ten tests that gave inconsistent results can be seen in Table 9.
This data was inconclusive and is deemed compromised due to an unknown error. Cumulative frequency charts and scatter plots were assembled for this data, but did not provide additional information. These average values may appear different than those in Table 3 due to the splitting of the data set. From this point forward, the additional five tests will represent the 1.4 ounces scaled distance three test series. The data that was more in agreement with the previous three series of tests can be seen Table 10.
Further analysis of the second set of data used in Table 10 can be seen in Table 11. The tests were evaluated on a test by test case with averages being calculated after pressure and percentage reductions were found for each test. The average percentage reduction is approximately the same value in both tables with relatively small ranges suggesting that the data set is of high quality. The SD 7.6 data sets were expected to have the smaller ranges and standard deviations compared to SD 5 since the distance relative to the charge was larger. The longer distances in SD 7.6 did not magnify the human error and charge phenomena as much as the SD 5 data. The additional pressure statistics were analyzed from the second set of tests performed.
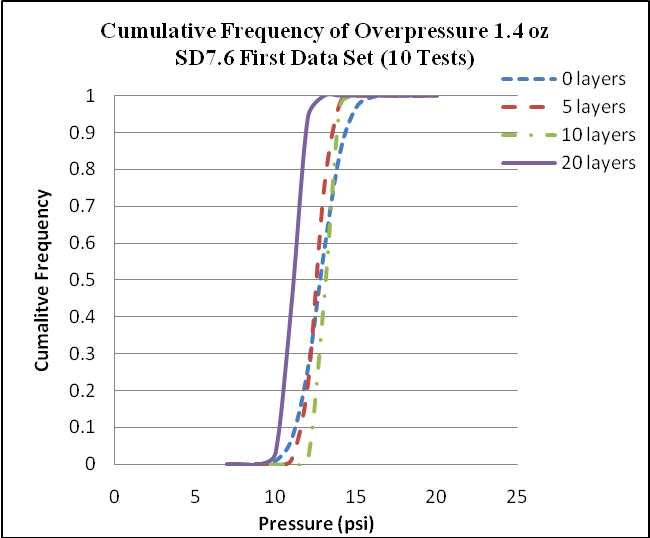
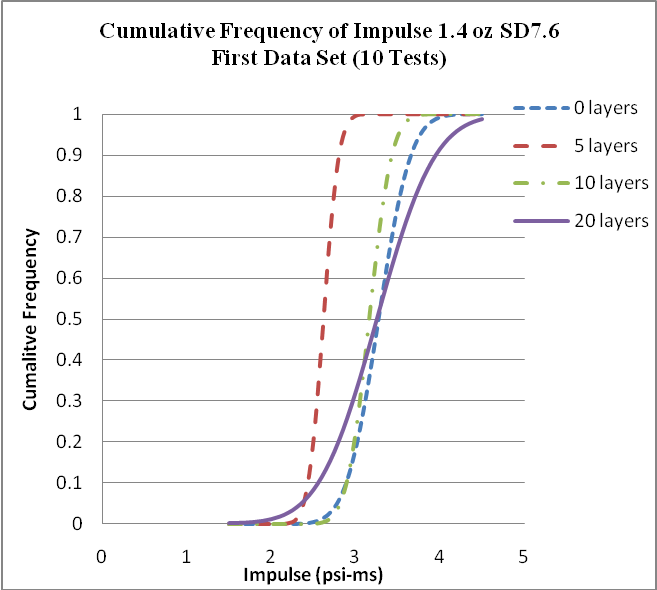
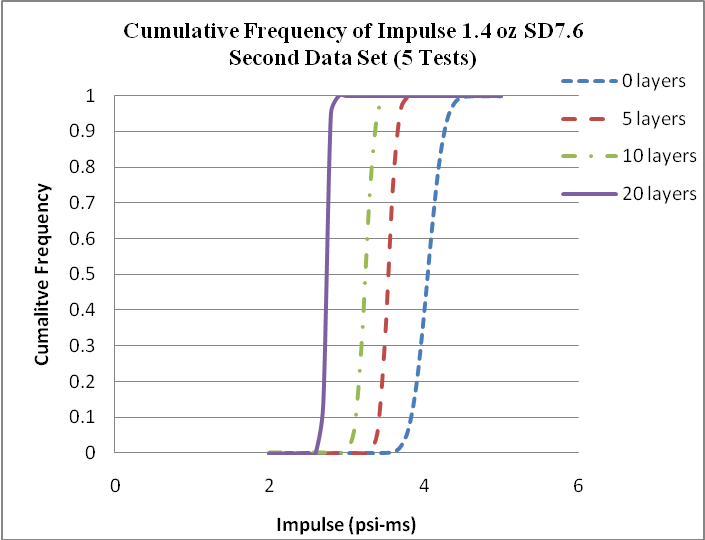
The cumulative frequency curves for the mesh layers were also broken down into the initial ten tests that did not give consistent results with the other arena tests and the five additional tests that yielded results similar to previous arena test data sets. The pressure chart from the initial ten tests in Figure 10 does not show clear definition between zero, five, and ten layers of mesh. It does show that 20 layers of mesh reduced the pressure the most and that all data sets were tightly grouped. The impulse cumulative frequency curve of the initial ten tests (Figure 11) was scattered evenly suggesting that five layers of mesh reduces the impulse more than 20 layers. As described above, this data seems anomalous, prompting further tests to confirm consistency in testing. The five tests performed upon initial suspicion of faulty data generated much more consistent and expected results.
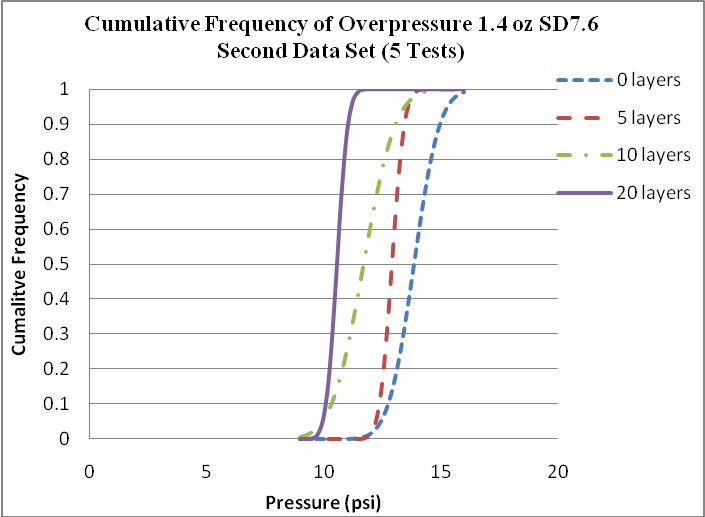
The pressure chart from the additional five tests in Figure 12 shows more clear definition in pressure reduction between different configurations of mesh layers. As expected, the increase in layers of aluminium mesh correlates to a reduction in peak pressure. The steep slope on the 20 layer curve suggests that again the pressure making its way through the mesh was quite similar on all tests in the series. The additional five tests also generated much better cumulative frequency curves (Figure 13) for impulse that were consistent with the previous 0.35 oz RDX SD 7.6 experiments. The nearly vertical cumulative frequency lines for both the pressure and impulse for the additional five tests show a tight grouping of values and small standard deviation.
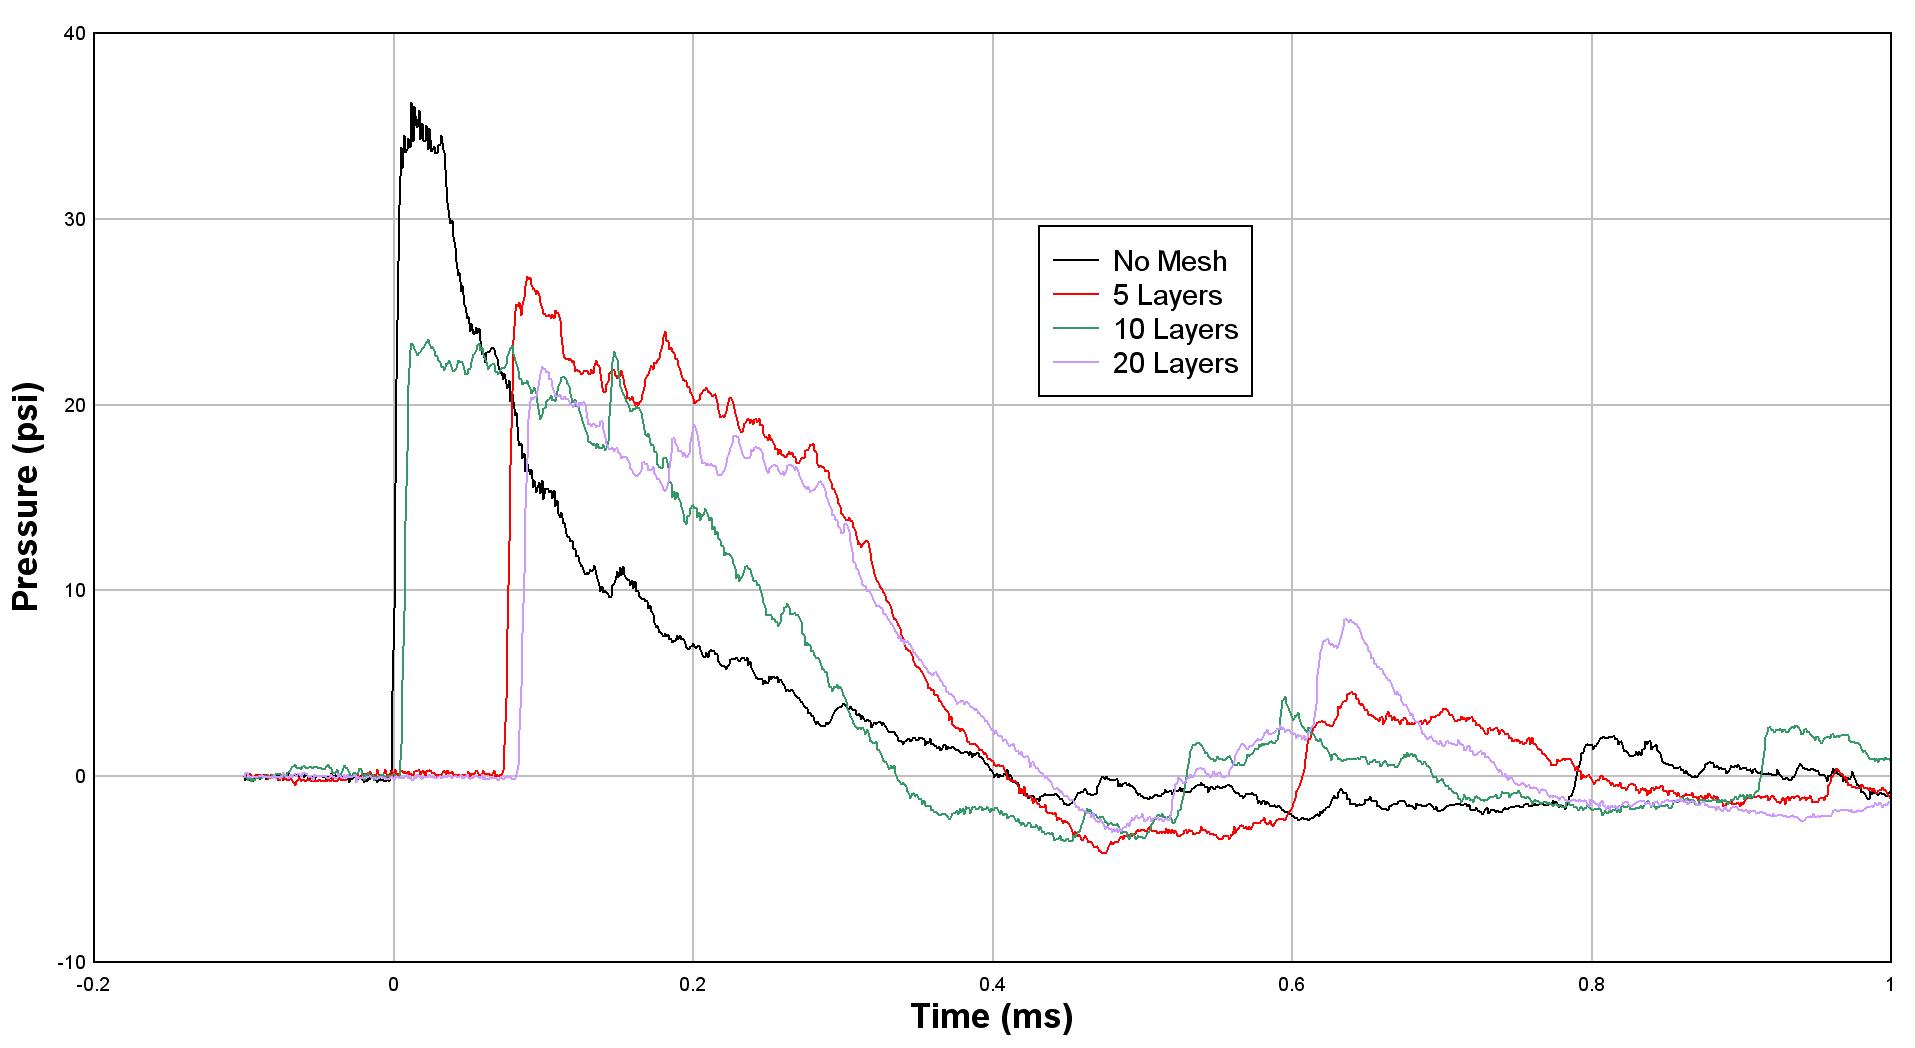
After analysis of all four series of arena tests, trends were found. The SD 5 sets were found to not have significant impulse reductions. Since the gauges are set closer to the explosive during a SD 5 test, the frequency of the blast is higher compared to SD 7.6. The aluminium mesh clips the peak pressure generated by the blast resulting in a peak pressure reduction, but the waveform is not altered by the mesh enough to cause an impulse reduction. Figure 14 shows example waveforms of a 1.4 ounce SD 5 set. The peak pressure is clipped by the layers of mesh, but the rest of the wave remains approximately the same resulting in an approximately equal impulse. Impulse is calculated by multiplying pressure by time; therefore, a small pressure decrease over a small timeframe will result in a small impulse reduction. Figure 14 shows the peak pressure is reduced by the mesh, but only over approximately 0.1 ms before the waveforms begin to look identical. This very brief clip of the pressure is believed to be why the impulse is not reduced for the SD 5 experiments.
After the sensors were moved back for the SD 7.6 experiments, the positive phase duration of the waveforms nearly doubled. Scaled distance 5 experiments resulted in an approximate 0.4 ms positive phase, while SD 7.6 had a 0.7 ms positive phase. The waveforms that went through the mesh seemed to be pushed to a shorter duration yielding a smaller impulse. Figure 15 shows an example of the waveforms from a 1.4 ounce SD 7.6 test.
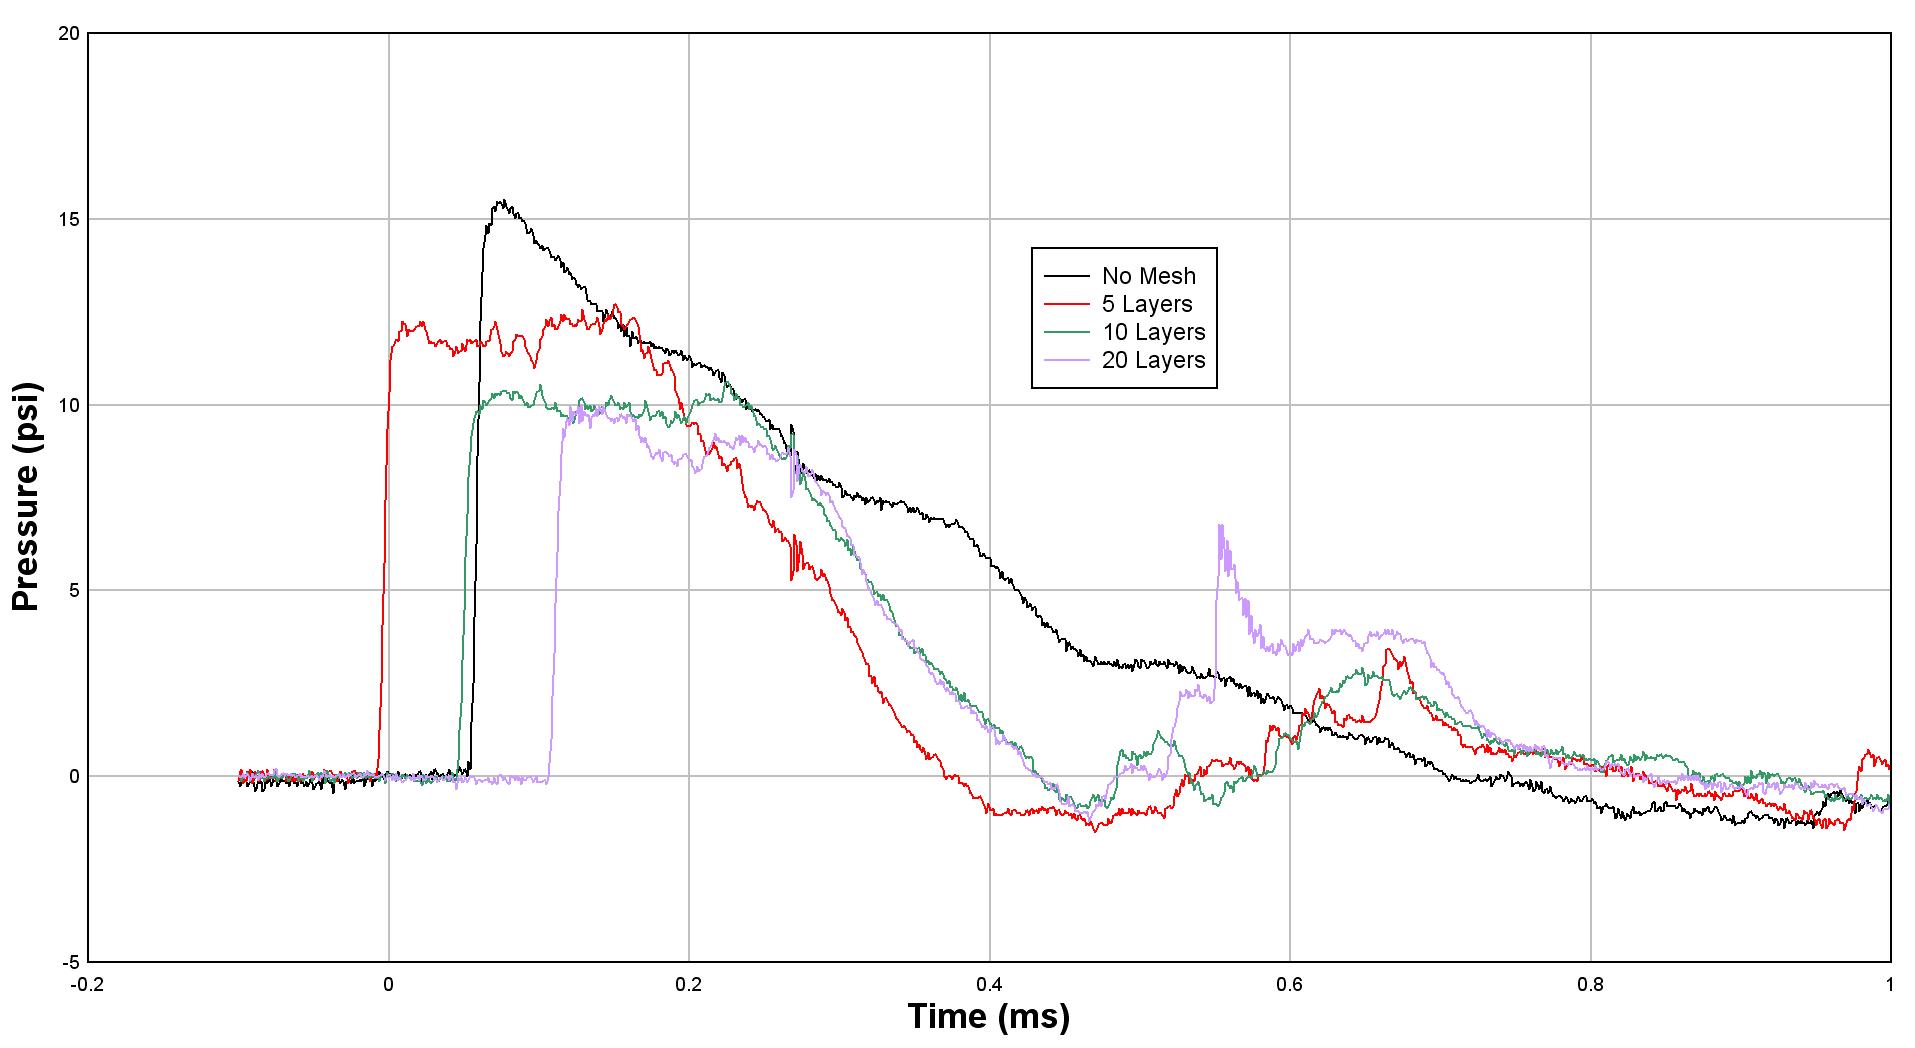
After examination of the waveforms from the two different scaled distances, several conclusions can be made. Small scaled distances result in shorter duration waveforms with a more rapid decay of pressure. These peak pressures were clipped by the aluminium mesh, but the waveforms continue on the approximate same path. The higher scaled distance experiments resulted in a longer duration positive phase of the pressure wave. The aluminium mesh reduced the peak pressure, but not by as much as a shorter duration wave generated in SD 5 experiments. Although the peak pressure was not reduced as much in SD 7.6 experiments, impulse mitigation became evident. Since the higher scaled distance waves have a longer duration, the clipped peaks result in a larger area reduction of the wave. The waveforms that travelled through the mesh also resulted in a shorter duration as well. The combination of these two phenomenon result in a larger impulse reduction for SD 7.6 experiments. Table 12 quantifies the pressure and impulse reductions sorted by scaled distance. The reductions were calculated by averaging the pressures and impulses first, and then calculating the percentage reductions. For SD 7.6 average pressure and impulse reductions, the second set of 1.4 ounce (five additional tests that gave more agreeing data with previous arena tests) was used.
| Table 12. Peak pressure and impulse reduction summary. | |||||
|---|---|---|---|---|---|
| Scaled Distance 5 | Scaled Distance 7.6 | ||||
| Mesh Layers | Reduction of Average Pressure | Reduction of Average Impulse | Reduction of Average Pressure | Reduction of Average Impulse | |
| 5 | 16.42% ± 0.32% | −23.29% ± 2.36% | 9.36% ± 3.65% | 8.27% ± 6.08% | |
| 10 | 22.38% ± 3.90% | −13.16% ± 7.81% | 17.03% ± 2.15% | 15.20% ± 6.65% | |
| 20 | 33.77% ± 6.82% | 3.72% ± 11.76% | 29.25% ± 7.82% | 26.79% ± 7.68% | |
| Table 13. Pressure reductions by scaled distance. | |||||
| Test Type | Scaled Distance | Average Pressure Reduction Percentage | |||
| 5 Layers | 10 Layers | 20 Layers | |||
| 0.35 Ounces RDX | 5 | −5.78% ± 29.49% | −1.44% ± 24.83% | 22.33% ± 20.22% | |
| 1.40 Ounces RDX | 5 | 15.82% ± 12.27% | 29.15% ± 8.96% | 33.15% ± 7.70 % | |
| 0.35 Ounces RDX | 7.6 | 12.02% ± 9.26% | 18.23% ± 11.88% | 34.50% ± 9.33% | |
| 1.40 Ounces RDX | 7.6 | 6.38% ± 7.96% | 14.96% ± 12.39% | 23.32% ± 7.45% |
The simple averages calculated for Table 12 suggest that the aluminium mesh performs better at reducing pressure at lower scaled distances while performing better at reducing impulse at higher scaled distances. Additional information may be necessary to categorize the performance of the mesh.
| Table 14. Reduction of average pressure. | ||||
|---|---|---|---|---|
| Test Type | Scaled Distance | Reduction of Average Pressure | ||
| 5 Layers | 10 Layers | 20 Layers | ||
| 0.35 Ounces RDX | 5 | 16.19% | 19.63% | 38.60% |
| 1.40 Ounces RDX | 5 | 16.65% | 25.14% | 28.95% |
| 0.35 Ounces RDX | 7.6 | 11.93% | 18.55% | 34.77% |
| 1.40 Ounces RDX | 7.6 | 6.78% | 15.51% | 23.72% |
Discussion
Interpretation of Data
After analysis of the data, the aluminium mesh product has proven promise for reducing the pressure blast effects from high explosives. 55 Arena tests were analyzed for this paper. Overall, 129 Mesh sample configurations were tested in the arena test. The data shows that in all scaled distance and charge size configurations, 20 layers of aluminium mesh reduced the peak pressure by over 20%. Even 5 layers of mesh consistently reduce peak pressure by almost 10%. Impulse reduction was not as consistent. Impulse reductions were experienced in the larger scaled distance, but not in the smaller scaled distances. Table 13 shows the average pressure reductions for each test series separated by scaled distance. The pressure reductions were taken on a test by test basis and then averaged rather than averaging the pressures first and then finding percent reduction. For the 1.4 ounce RDX SD 7.6, the second data set (additional five tests that were in agreement with the other arena data sets) was used.
It is difficult to identify trends in this data as it is tabulated. Through analysis of the cumulative frequency curves, the reduction of averages method was deemed acceptable and can be seen in Table 14. When generating the reduction percentages in this method, trends become more apparent. The trend that is most dominant is that pressure reduction goes up as layers of mesh is increased, closely followed by the trend that pressure reduction goes down as scaled distance goes up. This suggests that longer waveforms may not allow for pressure reduction through the mesh as easily as shorter waveforms like those in smaller scaled distance experiments. Since charge size is also a factor in wave duration, more tests with differing charge sizes would be beneficial as well.
Table 15 shows similar data for average impulse reduction. This table shows the trend that higher scaled distances allow for greater impulse reduction. This suggests a design trade-off.
| Table 15. Reduction of average impulse. | ||||
|---|---|---|---|---|
| Test Type | Scaled Distance | Reduction of Average Pressure | ||
| 5 Layers | 10 Layers | 20 Layers | ||
| 0.35 Ounces RDX | 5 | −21.62% | −18.68% | 12.04% |
| 1.4 Ounces RDX | 5 | −24.96% | −7.63% | −4.59% |
| 0.35 Ounces RDX | 7.6 | 3.95% | 10.49% | 21.35% |
| 1.40 Ounces RDX | 7.6 | 12.57% | 19.90% | 32.37% |
It is believed that energy absorption at the larger scaled distances may have come in the form of transferring blast energy into movement of the mesh; however, more investigation of this theory is necessary before adequate discussion can proceed. It is likely that the mesh would not be able to react with motion quickly enough to transfer this energy; thus, an alternative hypothesis is that the mesh acts porously and tends to slow the advance of the blast wave as it progresses through the mesh. Analysis of the high speed video could yield correlations between movement and resulting blast wave duration.
The clipping of short duration waves suggests that energy from the blast wave may not be absorbed, but rather pushed to longer duration. It is evident that more of a trend in impulse reduction exists in the larger scaled distances. This is somewhat counterintuitive when considering the mechanics of a blast wave. Generally larger scaled distance equates to longer duration and thus higher impulse. Perhaps this is the fundamental reason for better performance of the mesh at larger scaled distance. If more impulse is available, more can be utilized as energy for movement of the mesh. Further investigation of the mesh is called for to determine the mechanics of this phenomenon. Since all of the mesh tests were performed in a free-field format that allowed for the mesh to move away from the blast, a comparative study of reflected pressure measurements with mesh covering solid surfaces could provide insight to impulse reduction.
Arena Test Repeatability
In each arena test series, setup of each test was attempted to be as consistent as possible. Before testing occurred, the steel rods supporting the sensors and mesh frames were positioned at the desired distance and secured as tightly as possible. The sensors and mesh frames were also tightly fastened with set screws on the steel rod. As with any explosive blast, damage to a test setup may occur. After testing, analysis of the materials included in the setup showed only slight damage and deformations from the relatively small explosive charges used. The minor damage may lead to very slight inconsistencies in arrival time and peak pressure. The general shape of the waveform is very consistent for each configuration.
| Table 16. Summary of repeatability for arena tests. | ||||
|---|---|---|---|---|
| 0.35oz SD 5 | 0.35oz SD 7.6 | 1.40 g SD 5 | 1.40 g SD 7.6 | |
| 5 Layers | -5.78% ± 29.49% | 12.02% ± 9.26% | 15.82% ± 12.27% | 6.38% ± 7.96% |
| 10 Layers | -1.44% ± 24.83% | 18.23% ± 11.88% | 29.15% ± 8.96% | 14.96% ± 12.39% |
| 20 Layers | 22.33% ± 20.22% | 34.50% ± 9.33% | 33.15% ± 7.70 % | 23.32% ± 7.45% |
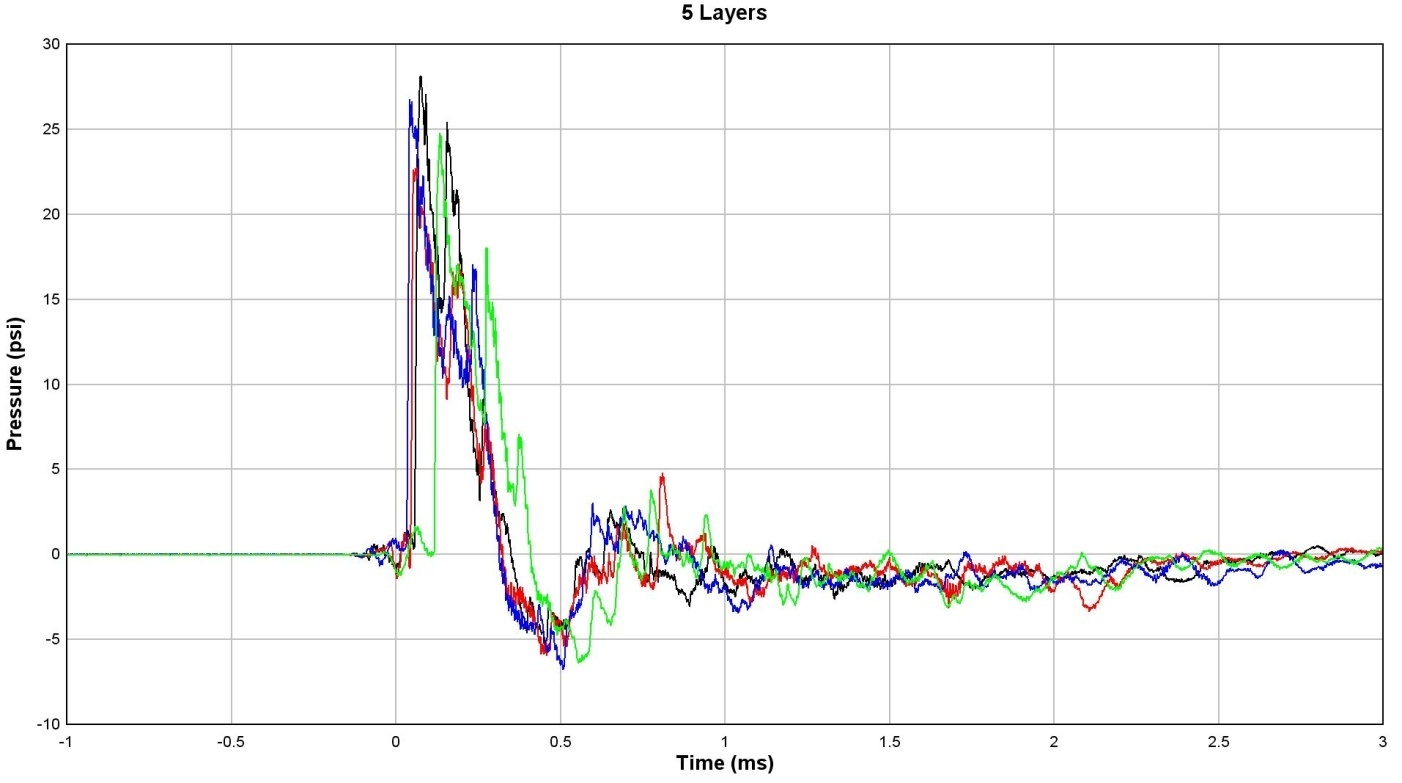
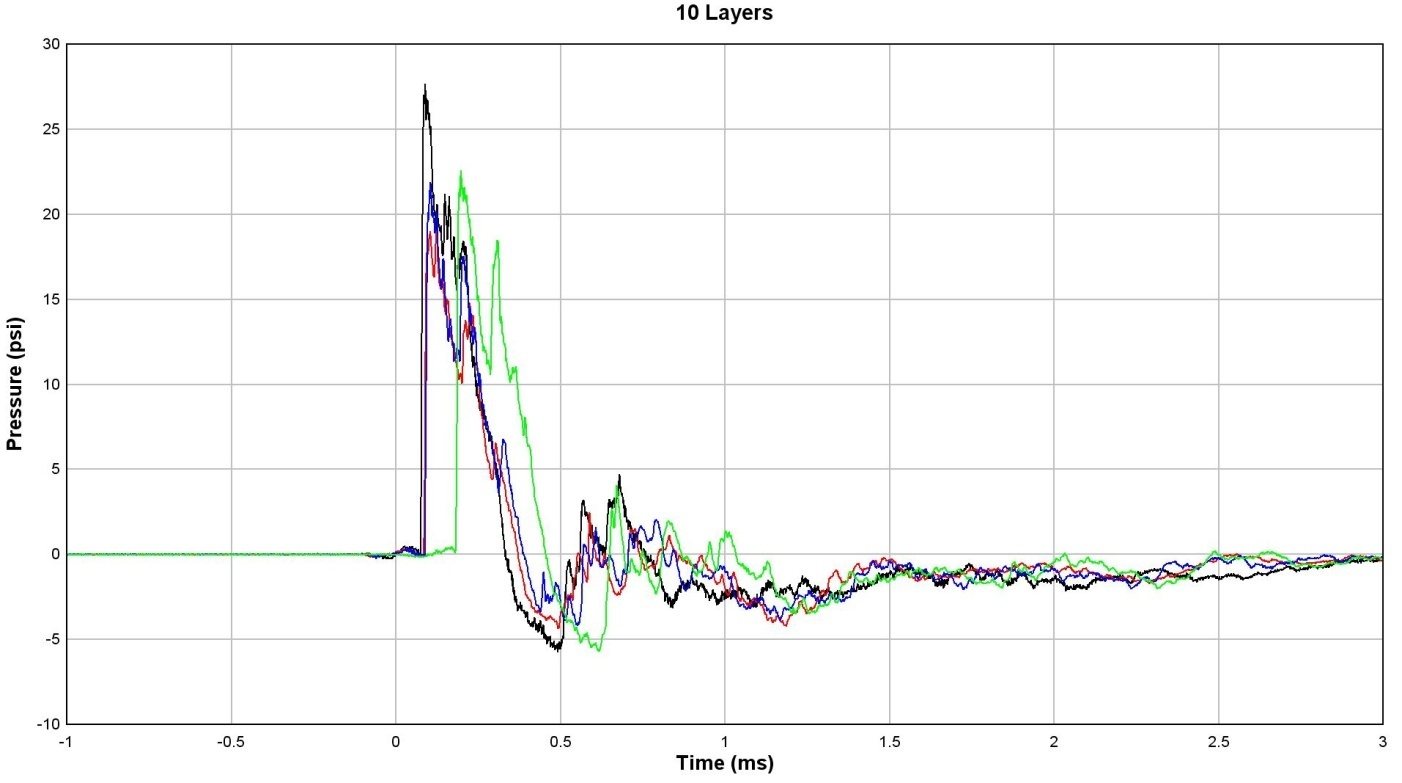
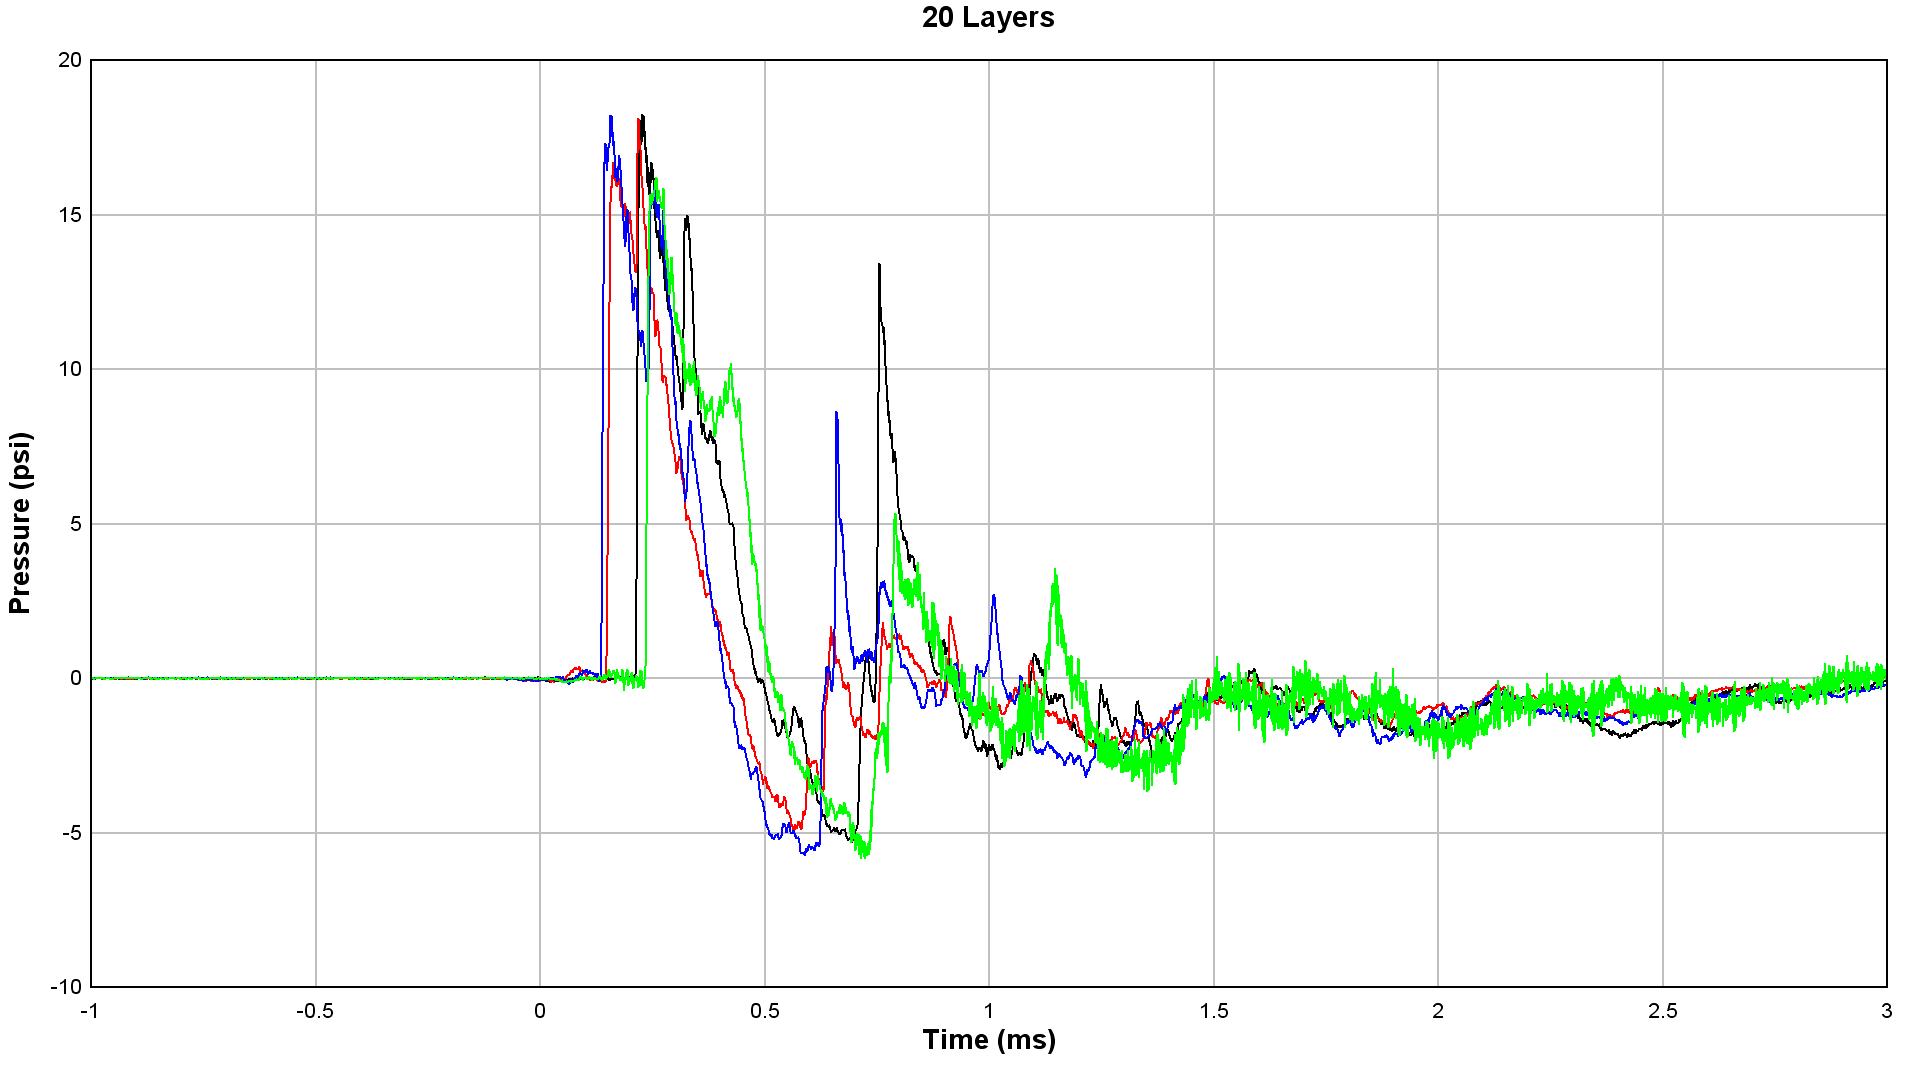
The following figures give a qualitative example of the repeatability of arena testing. In this example, four tests shot on the same day using the same sensors were analyzed. The waveform from each test was overlaid on the same graph for each respective mesh configuration. Figures 16−19 show the four graphs of the waveforms of different mesh layers.
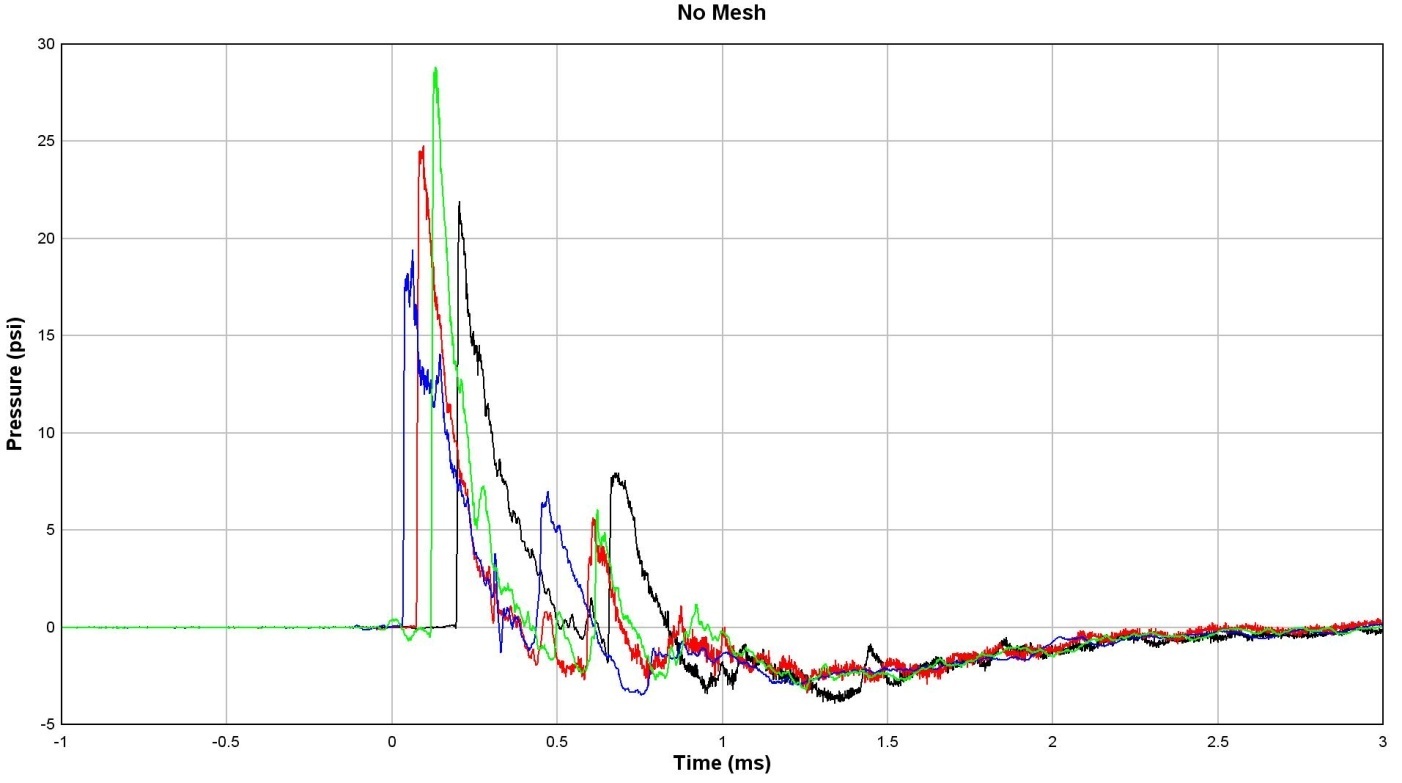
Through statistical analysis the repeatability of the arena tests can be assessed by investigation of the percent reductions in pressure for the various mesh configurations. Table 16 shows the pressure reduction percentages calculated using averaged individual test reductions with the standard deviation. The 0.35 oz SD 5 data has a very large error associated with it, but averages have good agreement with the other data sets that had tighter intervals. Even the best arena tests only generated statistical accuracy to +/− 7.45%.
Conclusion
Summary and Conclusions
Aluminium mesh has shown the ability to mitigate blast effects in the form of reducing free-field pressure and reducing impulse for small charges (<2 oz). Analysis of the data has shown that the mesh is more efficient at pressure reduction at lower scaled distances while it more effectively reduces impulse at higher scaled distances. The effect of charge size has not been completely characterized. It is uncertain whether large ranges of charge sizes would generate the same results. In general, larger scaled distances would produce longer durations while using similar charge sizes; however, larger charge sizes would also produce longer duration wave forms.
Fundamental mechanisms of the performance of the mesh have been identified. It is theorized that the mesh’s porosity could be a fundamental mechanism by which the mesh performs. Further analysis of the time of arrival data showed that the mesh either slowed down or delayed the shock front as it passed through. Further investigation might be required to determine which phenomenon dominates performance. The answer to that question would provide insight to the function of the mesh. For example, if it could be shown that the mesh doesn’t slow the shock front, but rather alters its path and delays it, the amount of delay could be used to determine pressure and impulse reduction similar to the delay experienced by distance. The attenuation of blast waves through a distance of air is well documented, and could provide additional design tools if delay time could be correlated to a distance and thus free-field pressure or impulse reduction.
The aluminium mesh reduced free-field pressure and impulse increasingly as layers of mesh were increased. A design trade-off exists between pressure reduction and impulse reduction. The performance of the mesh was a function of the pressure time curves’ frequencies and durations. Impressive reductions were achieved for such a lightweight and easy to handle material. However, the aluminium mesh is not very robust, and thus operationally, methods will need to be developed prior to field implementation. Conditions that are well outside the experimental range could cause changes in blast mitigation mechanisms that were not observed here.
Future Work
The results of this project suggest that future research should be performed to more completely characterize the mechanisms that are employed by the aluminium mesh to reduce pressure and impulse. Larger charge sizes could be simulated using a shock tube. In most cases the mesh would be applied to a solid surface, so the next logical step is to perform another test series that collects reflected pressure reduction with mesh over steel plates. Another component of future research would be investigating methods for making the mesh more robust. In its current configuration, the mesh would not stand up to field use because it is not robust enough to maintain integrity when vehicles drive through brush or other obstacles. Realistic field tests are required to substantiate this. Covering the mesh with a rubberized polymer material similar to commercial-grade truck bed liners has been identified as a potential solution that could be investigated in depth.
A key element in determining the functionality of the mesh is to determine what causes the delay in time of arrival as the shock front passes through layers of aluminium mesh. Time of arrival data could be generated in multiple locations throughout a layered mesh sample to determine whether the front is slowed or if the path is altered.
Several other questions arose through the analysis of the data collected for this project. A larger range of scaled distance could help to evaluate the performance of the mesh further. Also, a range of charge sizes would help to determine the effects of different wave durations on the performance in that several charge sizes could be employed at the same scaled distance to provide a similar pressure but varying pressure duration.
Based on the above discussion, the future work can be categorized in to four separate initiatives:
- Field Tests needed to evaluate field applicability of aluminium mesh. A large range would be required as well as a realistic target to be protected by the mesh.
- Larger Charges simulated using a shock tube for cost effective testing of mesh to other charge sizes and scaled distances.
- Improve mesh structural integrity to permit its use as a solid, protective layer. Methods for providing some mechanical strength with minimal effects on blast mitigation mechanisms should be evaluated.
- Study mesh layers on solid objects. Layers of mesh should be tested with solid objects backing the layer configurations to simulate structural materials such as vehicles and buildings. In addition, the mesh could be backed by “soft” objects to simulate the use of the mesh as armour for personnel.
- Study a broader range of scaled distances. Over a small range of scaled distances, the performance of the mesh has been evaluated for its performance to reduce pressure and impulse. A broader range of scaled distances could expand the design tool provided in Section 8.
- Identify conditions that result in mechanical failure of the mesh. Investigation of the ranges of overpressure and impulse that cause mechanical failure in the mesh is needed. Field tests suggested that the mesh is completely destroyed with charges at extremely close ranges. Debris from mesh failures could affect nearby objects although the lightweight nature of the product suggests that damage due to mesh debris would be minimal. Aluminium can be considered an energetic material in the proper configuration. The presence of mesh fragments could potentially make the blast more effective by adding energy to the reaction.
Culmination of future work would be additional field tests that employ the techniques and design tools created here and in additional future work. Once the field tests confirm the performance of the mesh on multiple tests, the aluminium mesh system could be ready for deployment.
References
[1] Y. Andreopoulos, S. Xanthos, and K. Subramaniam, “Moving Shocks Through Metallic Grids: Their Interaction and Potential for Blast Wave Mitigation”, Shock Waves, Springer-Verlag, March 2007.
[2] R.S. Wakeland and R.M. Keolian, “Measurement of Resistance of Individual Square-Mesh Screens to Oscillating Flow at Low and Intermediate Reynolds Numbers”, Journal of Fluids Engineering, Vol. 125, September, 2003.
[3] G.W. Ma, and Z.Q. Ye, “Energy Absorption Capacity of Layered Foam Cladding”, Department of Civil and Environmental Engineering, Nanyang Technological University, Singapore, Springer-Verlag, 2006.
[4] W.E. Baker, “Explosions in Air”, University of Texas Press, 1973.
[5] J.M. Dewey, “Air Velocity in Blast Waves from TNT Explosions” Roy. Soc.-Proc. Ser. A 279(1378), pp. 366−385, 1964.
[6] H. Kleine, J.M. Dewey, K. Ohashi, T. Mizukaki, and K. Takayama, “Studies of the TNT Equivalence of Silver Azide Charges”, Shock Waves, Vol. 13, No. 2, 2003, pp. 123−138.
[7] P.W. Cooper, “Explosives Engineering”, Wiley-VHC Inc., New York, 1996.
[8] G.F. Kinney, K.J. Graham, “Explosive Shocks in Air”, Springer, New York, 1985.
[9] ISEE, Blasters Handbook 17th Edition, International Society of Explosives Engineers, Cleveland, Ohio, 1998.
[10] J. Hoffman, B. Lusk, and K. Perry, “Investigations of Shock Tunnel Dynamics and Energy Realization”, Blasting and Fragmentation, Vol. 3, No. 3, pp. 207−226, ISEE, Cleveland, OH, 2009.
[11] M.M. Swisdak, “DDESB Blast Effects Computer”, US Department of Defence, Washington DC, 2001.