
Volume 13, Number 1, March 2010
An Evaluation Of Ad Hoc Routing Protocols Using An Agent-Based Mobility Model For Tactical Military Networks
Abstract
When evaluating Mobile Ad Hoc Network (MANET) routing protocols it is crucial to use a mobility model that most closely matches the likely real-world scenario. This paper outlines an agent-based synthetic warfare mobility modelling tool (called SWarMM) and presents a performance evaluation of IETF MANET routing protocols (DYMO, OLSR and AODV) using a SWarMM generated mobility model with the NS2 network simulation tool.
Introduction
Although tactical military use cases frequently appear in research papers promoting Mobile Ad hoc Networking (MANET) protocols, the actual validation of protocols against realistic military scenarios is virtually non-existent (at least in the unclassified realm of research). It was noted in [2] that while tactical military networks are indeed ad hoc, they have unique characteristics not found in normal social networking that directly affect how network topologies form, specifically:
- Military deployments have a well defined chain of command. While not suggesting that communications must strictly follow that chain of command, a chain of command will always exists, and in general, the nodes are physically located according to that model. This has an effect on how ad hoc network topologies actually form—both initially and subsequently throughout the operation. The chain of command also implies the establishment of command post (CP) or headquarters (HQ) elements where a commander will exercise command and control over their respective force elements, and therefore generate and consume large quantities of information.
- Military deployments are mission-based, and therefore units are expected to “cooperate” with one another and operate within reasonable bounds of doctrine. This mission-based characteristic can also lead to a certain amount of predictability in a unit’s movement. Mission limitations can also impose unique requirements on the network, such as asymmetry for low-power nodes and covert nodes wanting to minimise radio-frequency signatures.
- Military deployments are bounded in that they operate in a fixed area for a predetermined amount of time. Nodes do not simply move around randomly.
- Military deployments incur battlefield casualties (equipment and people), which implies that parts of a network topology can simply disappear without warning.
- Military deployments will typically be against an enemy whose primary aim is to disrupt command and control communications.
- Military deployments are dynamic, and following the three block war scenario, units may exhibit vastly different mobility patterns over time.
Given these characteristics, it is important that some effort is expended in developing a valid model of tactical networking in order to test the emerging routing protocols intended for this domain.
The aim of this paper is twofold: first, to present a brief synopsis of SWarMM (Synthetic Warfare Mobility Modeller) [2], a simple tool that generates synthetic mobility traces of complex warfare; and second to present an NS2 [3] simulation evaluation of three IETF MANET protocols using a generated deterrent clearing patrol mobility model.
Swarmm overview
Given the limitations of current synthetic mobility models to correctly represent tactical warfare [1,2] the SWarMM tool was developed based on a more dynamic agent-based combat simulation. Agent-based mobility models provide entity nodes that have a capacity to “think” and react to the changing situation of the unfolding mission.
The overall aim of SWarMM is to produce a more representative mobility model of complex warfare compared to the simplistic synthetic models currently in use. SWarMM achieves this by using realistic combat movement behaviours coupled with a simple entity “brain” consisting of Finite State Machine (FSM) logic and basic combat engagement rules.
SWarMM consists of an OpenGL 3D GUI front-end provided by the Opensteer framework [4], as well as producing numerous text output files used for input into the NS2 simulation discussed in the next section. Figure 1 provides a typical screen shot of the SWarMM tool in action [2].
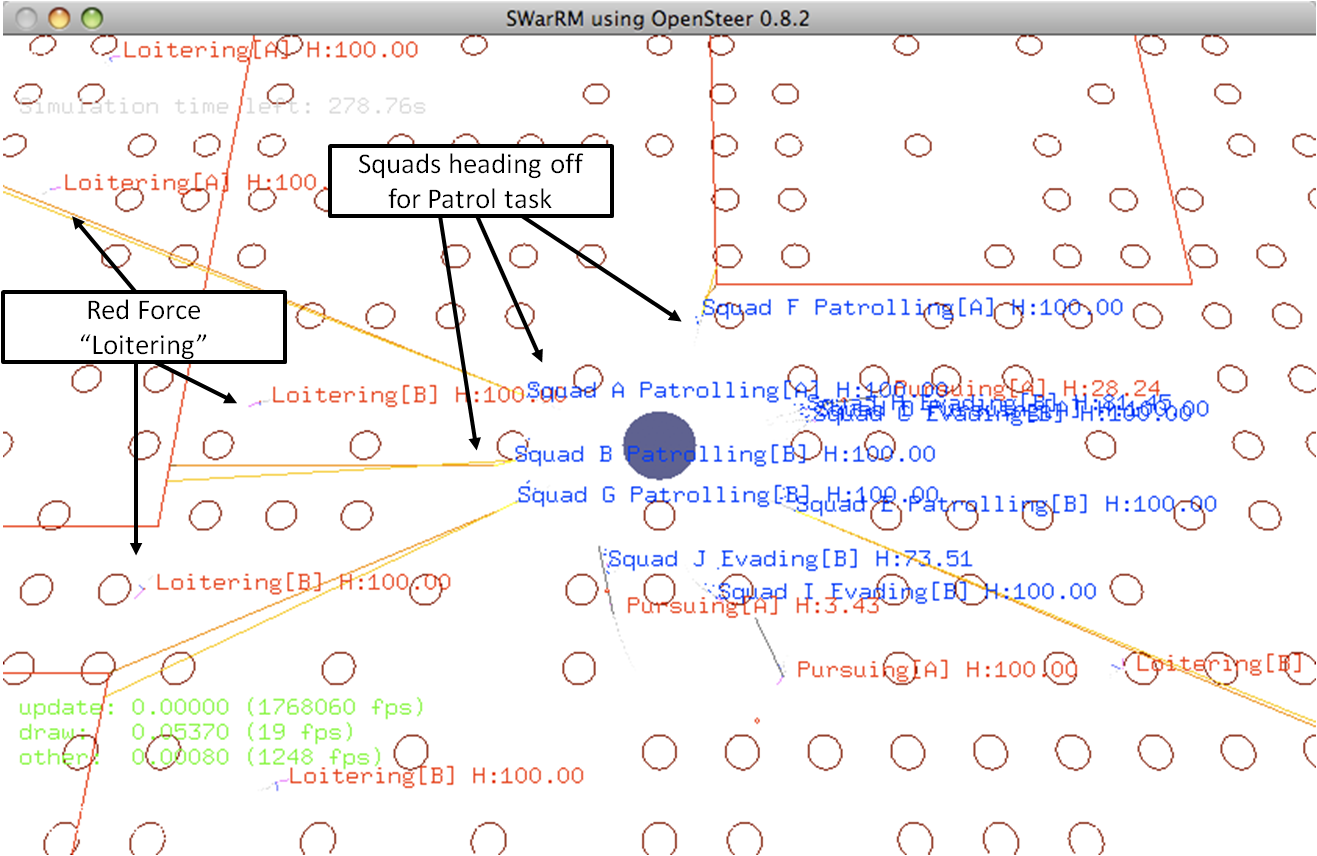
There is sufficient randomness built into the simulation to guarantee a different mobility model output each time the simulation is run. SWarMM’s AI has purposely been kept simple to enable fast believable scenario runs without onerous pre-configuration.
Ns2 simulation procedure
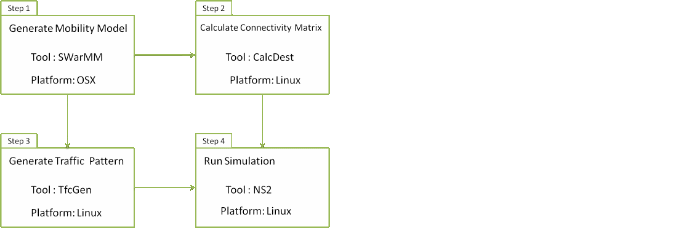
The overall NS2 simulation procedure consists of a number of steps; each step requiring a different tool for data manipulation. The diagram in Figure 2 illustrates the steps of the simulation process, including the tools and platforms used. The individual steps are discussed in detail in the following sections.
Step 1—generate mobility model
SWarMM generates the mobility model, and outputs the following text files for use in Step 2 and 3:
- Node Mobility Files. The node mobility files for this simulation contain over six thousand lines of NS2 (Tcl) formatted squad position vectors at constant time intervals. These files are used in Step 2 for calculating the connectivity matrix and are then further processed as the node mobility file for input into NS2 in Step 4. By default, SWarMM will output two mobility track files; one with UAV tracks included and one without. The UAV flight path for this scenario is a circular pattern at the maximum radio frequency range around the HQ.
- Enemy Contact File. The enemy contact file records all enemy contact made by squads during the SWarMM simulation run. Again, the output is formatted in NS2 (Tcl) script for use by the traffic generator during Step 3.
Step 2—calculate connectivity matrix
One of the features of NS2 is the Global Operations Director, or GOD object, which stores global information on the overall state of the simulation. NS2 is unable to perform real-time shortest-path calculations during wireless simulations and therefore must have this information annotated as part of the input node mobility file.
A program is provided as part of the NS2 distribution for providing these annotations, called CalcDest. CalcDest performs the following algorithm: it reads in the original node mobility file; for each time step it performs a node connectivity calculation based on a nominal communications RF range; it then calculates the shortest path connection between all nodes using the Floyd-Worshall algorithm [6]; and finally it rewrites the node mobility file with the required GOD annotations. It should be noted that the connectivity calculated during this step is based purely on a nominal range, and ignores any radio frequency effects that might be introduced by the propagation model during the actual NS2 simulation.
The choice of data link layer for wireless simulations within NS2 is limited, and typically the 802.11 wireless MAC is used. To keep the simulation realistic within the bounds of 802.11, a nominal RF range of 300m is used in this simulation by CalcDest to calculate the connectivity matrix.
CalcDest was further modified to work directly with SWarMM input files; in particular to capture the connectivity states of each node back to the HQ node (Node 0 in SWarMM) and provide more information about the route table at each time step. These additional outputs help to understand better the influence of the mobility model on the network topology and are discussed below in the protocol evaluation.
Step 3—generate traffic pattern
Traffic generation choices within NS2 are limited to the choices of Constant Bit Rate (CBR), Exponential on/off or Pareto on/off [7]. None of these default traffic generation options capture the essence of information exchange required for a synchronised NCW common operating picture (COP); therefore a specific situational awareness (SA) traffic generation module, TfcGen, was developed for the evaluation.
Volume 1 of the US Army NCW Case Studies from OIF [8], defines situational awareness as the ability to identify, process, and comprehend the critical elements of information about what is happening to the organization with regards to the mission within a particular area of operations. For our model, the COP is based simply on knowing the location of the BLUFOR and REDFOR elements. The hypothesis is that an appropriate measure of effectiveness of any tactical network (and hence routing protocol) is the accuracy of the COP over time at each individual node.
The generation of the SA messages is performed in this step. The assumption is, as with FBCB2 [9], that BLUFOR positional updates are automatically sent out at constant intervals to ensure that all friendly nodes are consistently synchronised. REDFOR positions are only known if and when BLUFOR elements come into contact with them. The input file for this step is essentially a chronology of enemy contacts recoded by SWarMM.
The TfcGen tool, which is itself a Tcl script, generates a code snippet of NS2 (Tcl) that is directly sourced by the simulation script in Step 4. Each squad automatically sends out a new SA positional update each period—which is a randomly assigned value between 10 and 30 seconds. When a squad comes into contact with an enemy node a single SA Contact Report is sent to the HQ node, then out to all other squads.
Step 4—ns2 simulation
The final step is the actual NS2 simulation. NS2 is controlled via a Tcl script that sets up all the communication, routing, application, node-mobility and traffic-generation parameters as well as sourcing the input stub scripts for node mobility with GOD annotations from Step 2, and the traffic generation for SA updates from Step 3.
The output from the NS2 simulation consists of node movement and network trace files along with a summary of SA updates sent and received by each node. The NS2 version used in this paper is 2.32, with add-on modules for OLSR and DYMO provided by the MANET Simulation and Implementation at the University of Murcia (MASIMUM) [10]. The NS2 software used in this paper was compiled on a Linux i686 2.6.20 kernel, passing all NS2 validation tests.
MANET protocol evaluation
This section evaluates the current IETF protocols of DYMO and OLSR, with AODV included for benchmark comparison.
Network fundamentals
Using the deterrent patrol scenario described above, the connectivity matrix output from Step 2 of the simulation process provides some useful insight of the network fundamentals. Figure 3 and Figure 4 show the change in connectivity experienced by each node’s route table over the duration of the mobility model. What each graph captures is a snapshot of hop counts and connectivity recorded in the route table of each node at each time step.
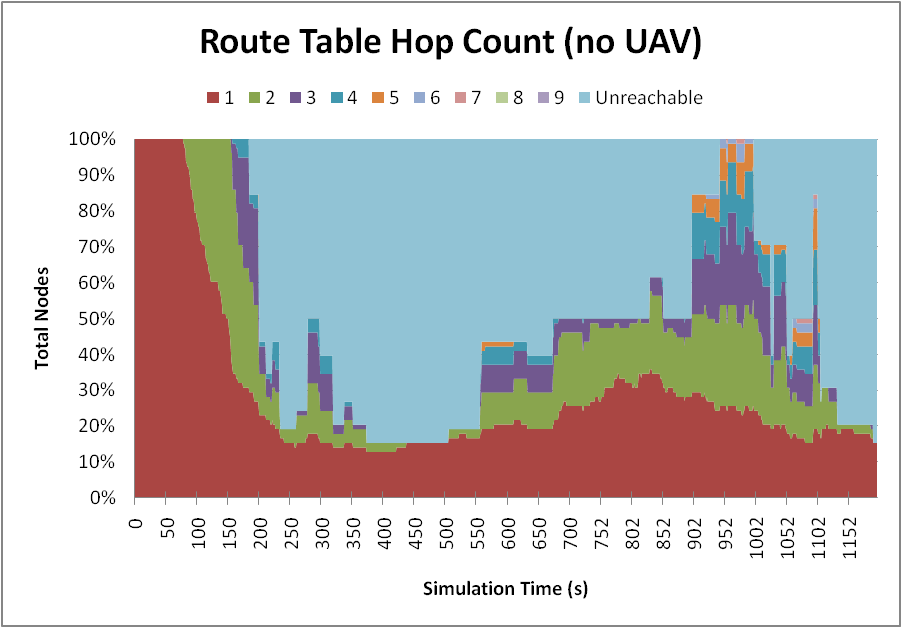
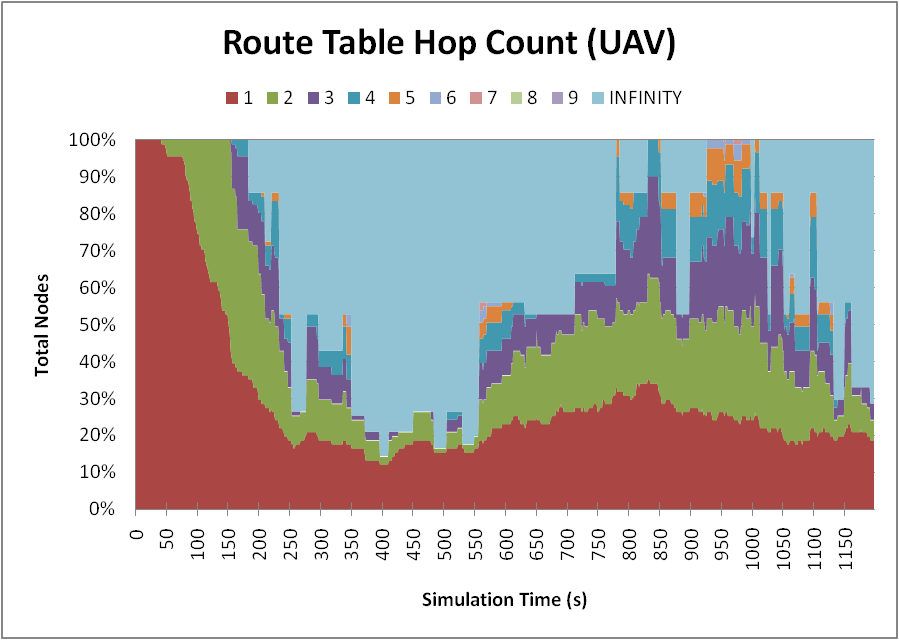
It can be observed that at time 0 all nodes are connected and are within 1 hop of each other. As the nodes move out from the HQ and travel to their patrol areas the range between nodes increases, the number of hops between nodes also increases, and the overall connectivity decreases. As the patrol paths diverge there is a distinct increase in the amount of unreachable routes being recorded in the nodes route table. As patrol paths converge, the squads once again become more connected albeit with a greater hop count.
Clearly the patrolling mobility model is causing a large percentage of nodes to report no connectivity (unreachable hop count) in a majority of routes for substantial periods of time. This is expected disruption caused by node mobility. It is also clear that having the UAV in the mobility model improves the overall connectivity, but disruption is still observable throughout the simulation.
Figure 5 and Figure 6 illustrate the number of squads that have no connectivity back to the HQ node (Node 0) juxtaposed with the maximum hop count recorded by any squad back to the HQ during the same time step. Again it can be seen that without a UAV providing some communications relay there is a substantial period of disruption where all 12 squads are without communication back to the HQ node. With the UAV included in the model, there are only a few occurrences of complete disruption to all squads; however the hop count does increase considerably.
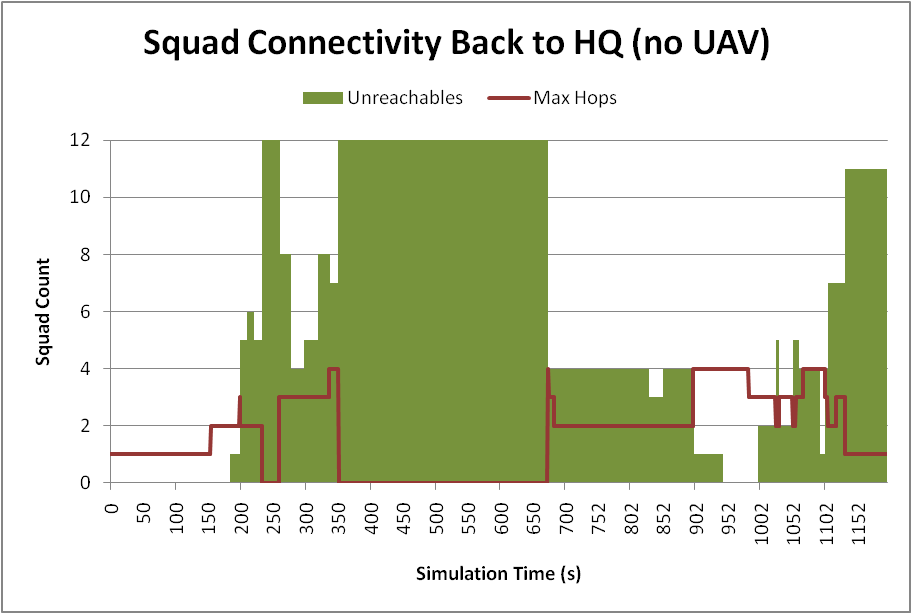
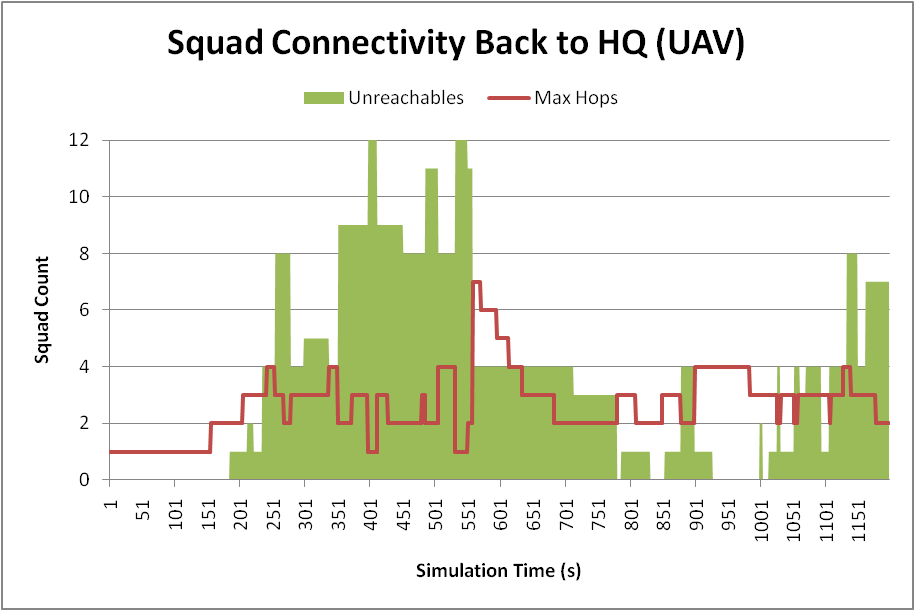
Figure 7 and Figure 8 illustrate the concept of “churn” first described in [11]. These graphs show the total amount of route and link (or connection) changes experienced by each node as a result of the mobility model. The churn provides an interesting view of the underlying network fundamentals that have an effect on the routing protocol performance during the final simulation run. One noticeable observation is that while having the UAV in the network affords improved connectivity for the squads, it does introduce an increase in network churn.
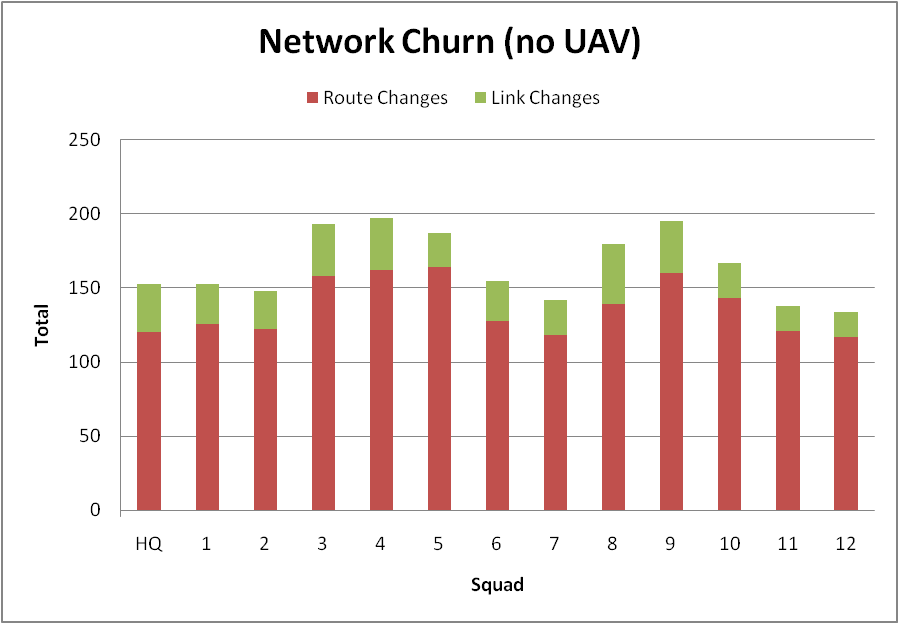
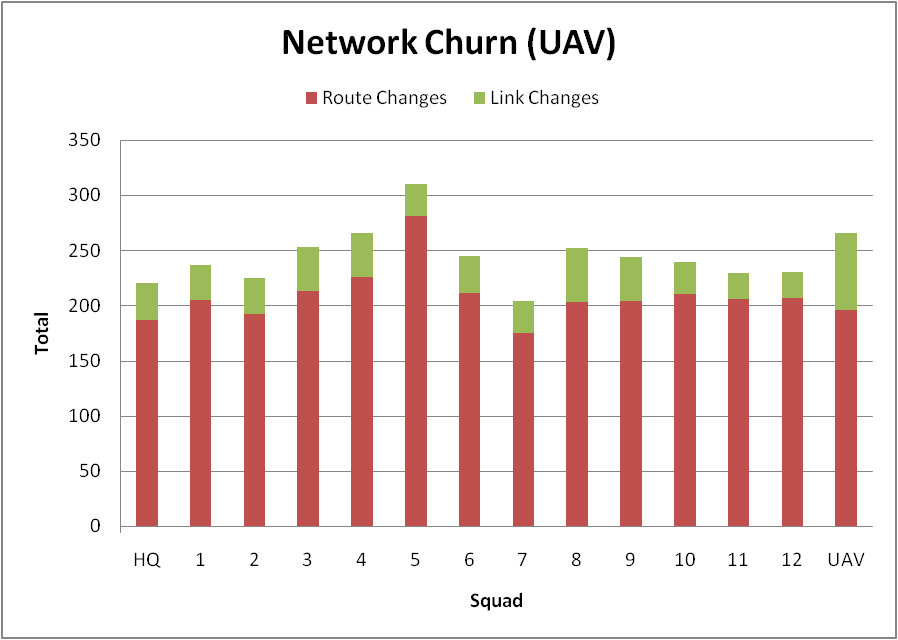
Another point of interest is that Squads 5 and 8 were both destroyed by the enemy during the simulation (Squad 5 rather early on at 209 seconds into the simulation, Squad 8 much later at 1175 seconds). The amount of churn observed by Squad 5 due to the erratic movement while in contact is comparable and even greater than other nodes that completed the entire simulation.
Network traffic patterns
Figure 9 illustrates the traffic pattern generated by the NS2 simulation. As discussed above in Step 3, rather than a simplistic constant bit rate transmission, the traffic pattern for this simulation is based on a more realistic SA update paradigm that allows measurement of each squad’s synchronised common operating picture. The SA updates are limited to BLUFOR and REDFOR location status; hence the COP should provide each squad with an understanding of where all friendly and known enemy forces are located.
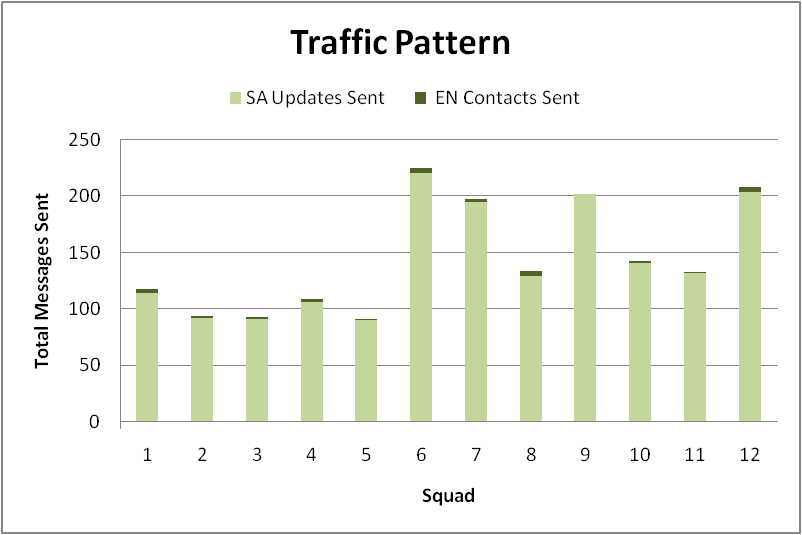
Each squad automatically generates SA positional updates based on a random interval of between 15 and 30 seconds. Enemy contact messages are only sent when the squad actually comes into contact with REDFOR elements, thus some squads may send no enemy contact reports at all. The traffic pattern for this particular mobility model generated 1,717 positional updates and 31 enemy contact reports, with two squads (5 and 8) being completely destroyed during the simulation.
MANET protocol performance
Figure 10 provides a measure of the COP synchronisation for all squads without a UAV providing any communications relay in the mobility model. COP synchronisation is measured as a percentage of the number of SA updates actually received by a particular node compared to the number to SA updates sent by all other nodes. It can be observed that all squads experienced less than perfect COP synchronisation due to their patrol route and circumstances (noting that Squad 5 is actually killed in action early on in the simulation); however the majority of squads achieved a fairly consistent COP, albeit below 50% for BLUFOR and 80% for REDFOR.
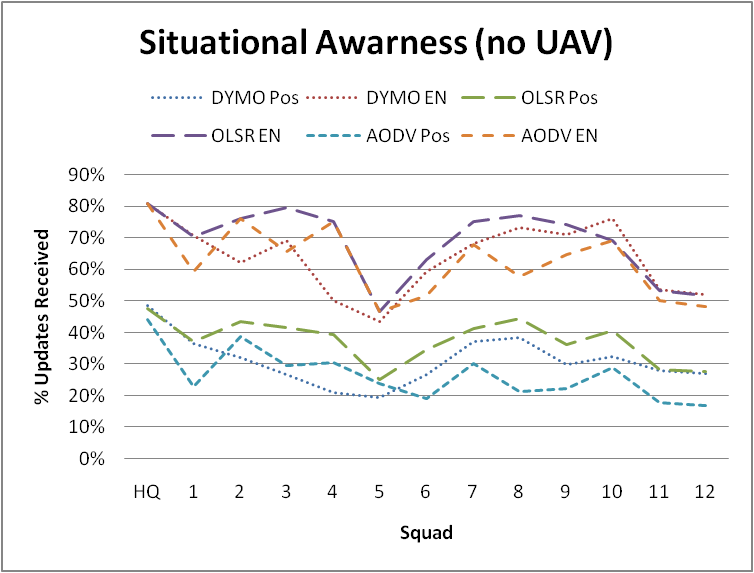
Of the routing protocols, OLSR performed marginally better than DYMO with AODV only a few points behind; there was no obvious superior MANET protocol for this mobility model without a UAV. Figure 11 shows the average percent of messages received by each protocol. Overall the average measure of SA updates across all squads is 32% (OLSR 37%, DYMO 31% and AODV 27%) and of REDFOR contact reports across all squads is 65% (OLSR 69%, DYMO 64% and AODV 62%).
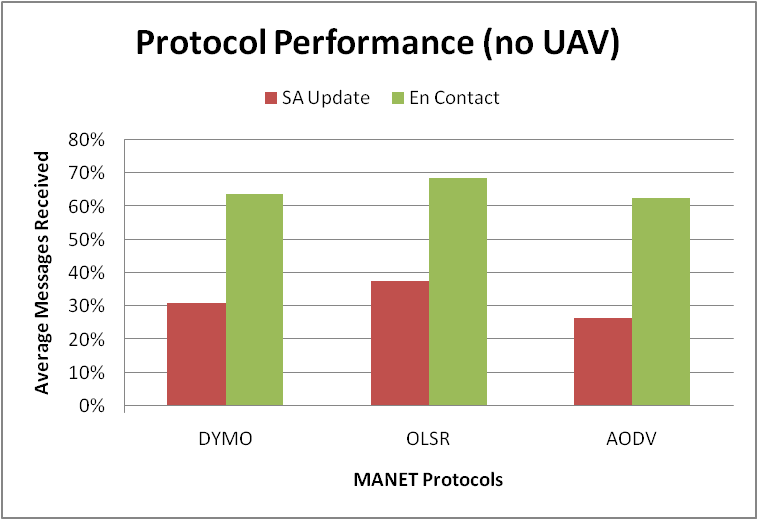
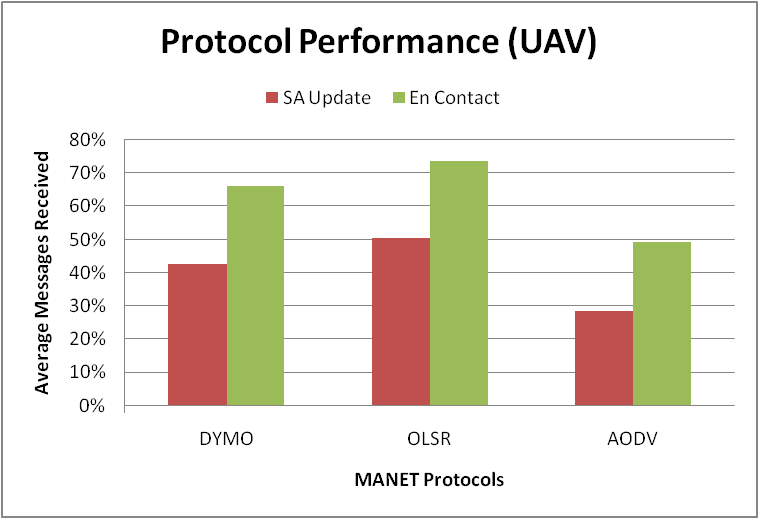
Figure 12 illustrates the COP synchronisation for all squads with a UAV flying at a fixed range around the HQ node. Overall, it can be observed that there is a distinct improvement for OLSR and DYMO protocols; however AODV performed the same for enemy updates, but much worse for SA updates. This would indicate that OLSR and DYMO are better suited to handle the higher churn rate caused by the UAV.
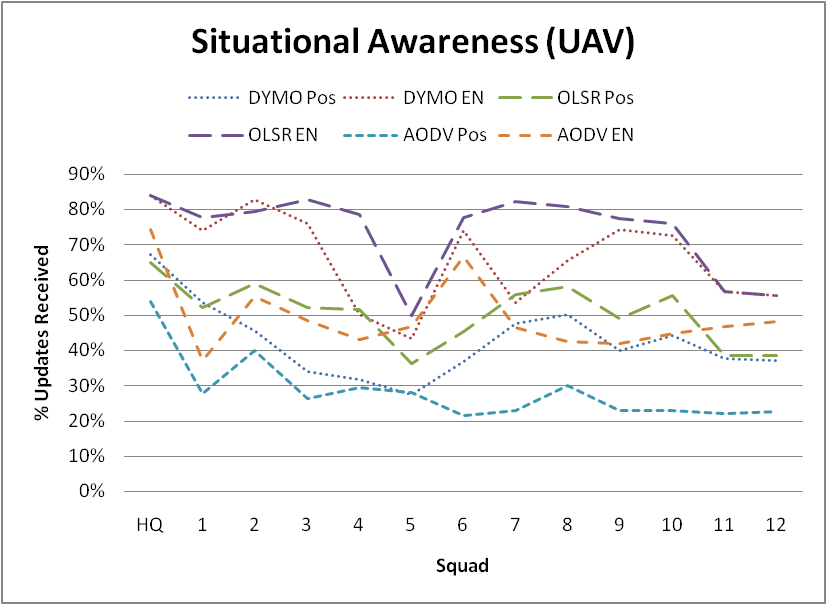
Figure 13 shows the average percent of messages received by each routing protocol. In this case, it appears that OLSR has noticeably outperformed the other two reactive routing protocols, with AODV showing real trouble in handling the increased link and route changes introduces by the UAV. The overall average SA message delivery is up to 41% (OLSR 50%, DYMO 43% and AODV 29%), with the average REDFOR contact reports steady at 63% (OLSR 74%, DYMO 66% and AODV 49%).
Follow on work
In the above evaluation it can be observed that disruptions caused by node mobility and communication limitations cause less-than-optimal routing protocol performance and the subsequent deterioration in situational awareness. MANET protocols do not perform particularly well primarily due to the inability of synchronous protocols to handle communications disruptions gracefully—packets are merely discarded when a destination becomes unreachable.
What is needed for tactical military networks is a synchronous routing protocol with built in disruption tolerance. A synchronous MANET protocol allows real-time services to be offered while the network is connected, with a graceful transition to an asynchronous, disruption-tolerant protocol when the network becomes disconnected. A proposed hybrid routing protocol that provides one such solution is presented in [12].
Summary
This paper has briefly outlined SWarMM (Synthetic Warfare Mobility Modeller); a simple but effective tool that generates synthetic mobility traces of complex warfare for use with discrete network simulation tools such as NS2. A more complete description can be found in [2].
The complete SWarMM to NS2 simulation environment was presented and used to evaluate three IEFT MANET protocols against a deterrent patrol mobility model. The network fundamentals and traffic patterns caused by the mobility model were presented, followed by a detailed discussion of the performance of each protocol. The results show disruption caused by squad activities (mobility, enemy engagement and mission requirements) seriously degrades the performance of synchronous MANET routing protocols, and consequently reduces the effectiveness of the common operating picture.
References
[1] T. Camp, J. Boleng, and V. Davies, “A Survey of Mobility Models for Ad Hoc Network Research”, Wireless Communication & Mobile Computing (WCMC): Special issue on Mobile Ad Hoc Networking: Research, Trends and Applications, 2002.
[2] P. Holliday, “SWarMM—A Mobility Modelling Tool for Tactical Military Networks”, IEEE Military Communications Conference (MILCOM), 2008.
[3] NS-2 Discreet Network Simulation Tool, 10 May 2008, http://nsnam.isi.edu/nsnam/index.php/Main_Page.
[4] C. Reynolds, OpenSteer—Steering Behaviors for Autonomous Characters, http://opensteer.sourceforge.net.
[5] P. Holliday, “An Evaluation of Mobile Ad Hoc Routing Protocols Using a Realistic Tactical Mobility Model”, Military Communications and Information System Conference (MilCIS) 2008, Canberra.
[6] R. Floyd, “Algorithm 97: Shortest Path”, Communications of the ACM, Vol. 6, 1962, pp. 345–370.
[7] The VINT Project, The NS2 Manual (formerly Notes and Documentation) http://www.isi.edu/nsnam/ns/doc/everything.html.
[8] U.S. Army War College, NCW Case Studies, http://www.carlisle.army.mil/usacsl.
[9] U.S. Army, Force XXI Battle Command Brigade and Below, http://peoc3t.monmouth.army.mil/fbcb2/fbcb2.html.
[10] F. Ros and P. Ruiz, MASIMUM, http://masimum.dif.um.es/.
[11] W. Blair and A. Reynolds, Ad Hoc Networks - Headline 2000 Communications Analysis, DSTO Report DSTO-TR-1317, 2002.
[12] P. Holliday, “NOMAD—A Mobile Ad Hoc and Disruption Tolerant Routing Protocol for Tactical Military Networks”, IEEE Wireless Mobile Ad hoc Networks (WiMAN), 2009.