
Volume 12, Number 3, November 2009
Development Of Cost-Effective PC-Based High-Fidelity Infrared Signature Modelling Of Transport Aircraft
- 1 College of Aeronautical Engineering, National University of Sciences and Technology, Pakistan.
- 2 Department of Informatics and Sensors, Cranfield University, Swindon, UK.
Abstract
There are various costly aircraft IR signature-modelling software packages available in the marketplace that require high computational power. The goal of this paper is to present a cost-effective approach to these expensive options. In a low-fidelity model the whole aircraft body is taken as one IR source, while high-fidelity models aim at taking different parts of the aircraft as different IR sources. In our approach, the aircraft 3D model is divided into different parts such as nose, metallic body, glass canopy and exhaust gas plume and then the radiance of the different parts of the aircraft based on their emissivity and temperature is calculated to represent its high-fidelity IR signature. The model is validated against numerical values and visual thermal images of the aircraft. This personal computer based non-destructive application additionally provides a cost-effective alternative to the field trials/testing of flares in which numerous scenarios can be simulated efficiently and with controlled environmental conditions.
Introduction
Slow-moving airborne platforms such as transport aircraft have in recent years come up against a wide variety of threats, including several generations of man-portable surface-to-air missile systems (MANPADs or SAMs). Any person standing near the runway who launches a Stringer missile for example, will most probably hit the aircraft taking off from the runway because the missile seeks the infrared (IR) signature. One of the likely countermeasures is to use expendable IR flares. Recently, missions such as regional peacekeeping efforts, election support and the rendering of medical assistance or the supply of food to isolated areas have become normal day-to-day events for military personnel and assets [1]. Hence, the need for the self-protection strategies of the aircraft is immense. Signature prediction is an important part of IR system analysis. These models should reflect the characteristics of the most important radiative signature processes. As IR systems typically utilize contrast between target and its background and because natural sources of target IR radiation are frequently important, environmental as well as target radiative phenomena must be included in the predictive analysis tool [2]. Different IR signature modelling software packages are already available to the military market, all of which are very expensive and based on big machines or high-end PCs [3−6]. This PC-based low-cost non-destructive simulation can provide a cost-effective alternative to the modelling software on high-end computation machines. Simple analytic techniques can be applied that may provide a lower level of fidelity and accuracy, and may give a physical insight into the radiative phenomena. Simple techniques may be appropriate for those occasions when it is useful to estimate the IR intensities of objects (military targets, in particular) without resorting to complex and time-consuming computer modelling techniques [2]. IR signature management has now become important for modern surface warheads, and the use of IR design tools to enable aircraft designers to manage the IR characteristics of the platform is essential [7]. The analysis addresses the perception of objects by IR sensors by measuring the radiation emitted by targets and backgrounds with the parameters of interest usually being the source radiance, intensity and temperature. An aircraft IR signature is composed of several components including:
1. Internal sources such as engines and plumes, and internal heat.
2. External sources such as solar heating and background signature.
All of these signature components must be considered in the analysis of an IR signature. In this paper, radiations emitting from different parts of the aircraft are calculated using Planck’s law which states that the spectral distribution of the radiation from a blackbody is a function of the temperature and emissivity value of the object and is directly proportional to the frequency of that radiation [8]. For modelling the signature of an aircraft a basic 3D model is used and different shapes are added on the model such as exhaust plume geometry, leading shining edges, and so on, for modelling the different heating effects in the signature model [9]. For 3D visualization, Virtual Reality Modelling Language (VRML) and for computational algorithms, MATLAB has been used in this work. Aircraft manoeuvrability is incorporated through a Flight Model using SIMULINK and Aerospace Blockset of MATLAB. This model is interfaced with the virtual model for visualization using 6-DOF equations of motion. The model performs the yaw, pitch, and roll movement and translates in the Z-axis using a pilot joystick with a throttle and rudder.
This paper then goes on to describe the:
- 3D model of the aircraft,
- developed algorithm that is used for IR signature modelling,
- validation and optimization of the IR model,
- flight model for manoeuvrability of the 3D model, and
- analysis and results.
3D model
The fundamental design structure in VRML is the scene graph. This scene graph describes the 3D models, their visual properties and interactions, plus a user’s interactions with the scene. The scene graph is composed of groups of encoded content called nodes. Nodes are added to the scene to display graphical objects such as a Box, Sphere, Cylinder (primitive objects), ElevationGrid, or IndexedFaceSet (complex polygon representations). These nodes can be grouped together to describe more complex objects that can then be used to specify animation or interaction [10]. The C-130 Hercules represents a typical military transport aircraft. Figure 1 shows the actual dimensions of the C-130 aircraft [11]. The basic C-130 VRML 3D model was used [9].
![Actual dimensions of C-130 aircraft [11].](/journals/journal-of-battlefield-technology/volume-12/issue-03/assets/12-3-6-sarfraz/figures/figure01.gif)
The basic 3D model of C-130 is divided into the following parts in order to use it for IR signature modelling.
1. Body of the aircraft (fuselage, tail and wings).
2. Nose of the aircraft.
3. Engines (1, 2, 3, and 4 separately).
4. Engine exhaust gas plume (separate for each engine).
5. Engine propellers (1, 2, 3, and 4 separately).
6. Leading-edges of wings and tail section.
7. Glass cockpit.
In VRML, every geometrical object contains an independent ‘geometry’ node and ‘appearance’ node [10]. The geometry node controls the size and shape of each part, whereas, the appearance node controls the texture and material properties. The ‘appearance’ node specifies the physical properties such as the colour, shininess, transparency etc. The material properties of each sub-part can be controlled independently. To show the leading-edge effects, on the wings and tail section, a separate geometry is added on their edges. The dimensions and shape are matched and the leading-edge geometry is superimposed on the wings and tail geometry. The nose section geometry is also separated from the main body so that the heating effects on the leading-edge of the nose can be highlighted. The aircraft exhaust gas plume geometry is created by using the ‘cone’ geometrical node of VRML. The plume may be modelled as layers of concentric cones as shown in Figure 2. These cones represent the inviscid core of the engine exhaust which contains the hottest exhaust gas region [12].
![Concentric cones of plume [12].](/journals/journal-of-battlefield-technology/volume-12/issue-03/assets/12-3-6-sarfraz/figures/figure02.gif)
In VRML, there is a provision for the readymade ‘background’ node that models the whole space around any scene as layers of sky in the upper hemisphere and layers of ground in the lower hemisphere.
The colour and size of these layers can be controlled by ‘GroundAngles’, ‘GroundColour’, ‘SkyAngle’ and ‘SkyColour’. For airborne targets, the background may be approximated as several horizontal layers of sky and ground [12]. Therefore, to increase the fidelity, the background is modelled as three layers (or planes) of the sky and one layer of the ground. For the ground targets or very low flying targets, the second order effects such as spatial variations along the mixed background can be modelled by selecting a full 3D environment with multiple backgrounds.
Figure 3 shows one such scenario of multiple backgrounds in which solid tarmac, grass, ice and mountains, and sky with scattered clouds are all depicted. For higher order modelling of the background, the following parameters are required [13]:
![Sub-background or multiple backgrounds [13].](/journals/journal-of-battlefield-technology/volume-12/issue-03/assets/12-3-6-sarfraz/figures/figure03.gif)
1. Temperature of each sub-background.
2. Emissivity of each sub-background.
3. Diffused and specular reflectance of each sub-background.
4. Solar irradiance.
5. Atmospheric transmittance.
6. Sky radiance.
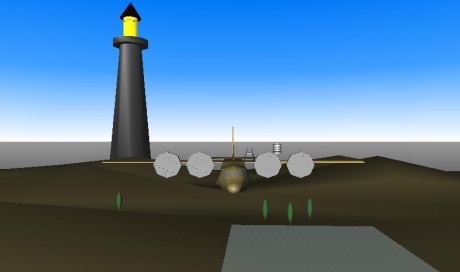
The higher-order background modelling may be considered in future work for air-to-surface and ground-to-ground modes. Different objects like terrain, water, runway, lighthouse, terminal and trees are also incorporated in the background for developing a real time scenario.
IR scene can be seen on these objects which form a part of the background. Figure 4 shows the Virtual Model of C-130 incorporating a background.
IR modelling
The IR signature modelling of the 3D model is developed in the MATLAB environment and is coupled with the 3D model. The signature modelling development process is divided into various parts:
1. Taking the input values for the Planck’s law.
2. Calculating the values of radiance of different parts of the model and the sub-background radiance.
3. Accessing the atmospheric attenuation data taken from the LOWTRAN software.
4. Interpolating the atmospheric attenuation data and applying it on the values of radiance.
5. Calculating the normalized values of radiance for colour-mapping.
6. Multiplying the normalized values of radiance with the colour index.
7. Initiating the colour-maps in the MATLAB for IR modelling.
8. Finding the RGB values of normalized radiance and pasting them on different parts of the 3D virtual model to get IR signature.
9. Creating a GUI for interaction with the user.
| PART NAME | TEMPERATURE (K) | EMISSIVITY |
|---|---|---|
| Inner Plume | 1000 | 0.9 |
| Outer Plume | 500 | 0.5 |
| Nose | 350 | 0.9 |
| Body | 320 | 0.9 |
| Tailpipe | 420 | 0.9 |
| Canopy | 250 | 0.5 |
| Engine | 360 | 0.9 |
| Propellers | 380 | 0.55 |
| Water | 308 | 0.96 |
| Terrain | 305 | 0.92 |
| Runway | 313 | 0.94 |
| Terminal | 310 | 0.79 |
| Lighthouse | 310 | 0.79 |
| Trees | 298 | 0.97 |
| Block | 310 | 0.8 |
| Light | 373 | 0.5 |
| Earth | 303 | 0.92 |
For the IR signature modelling, Planck’s law is used for calculating the radiance values of the C-130 model. The input values for the desired function—that is, temperature and emissivity values are tabulated. The temperature and emissivity values are taken from the literature [14−16]. Table 1 gives the values of temperature and emissivity for different parts of the virtual model.
The radiance values of different parts of the Virtual Model are calculated using Planck’s law in equation 1:
where Ntgt is the radiance of the target at every 0.01 micron interval; Ttgt is the temperature of target in Kelvin; tgt is the total emissivity of the target; λ1, λ2 are the start and stop wavelengths for every 0.01 micron step; and c1, c2 are the first and second radiation constants respectively.
Similarly, the sub-background radiance can be calculated by using (2).
where NB is the radiance of the sub-background at every 0.01 micron interval; TB is the temperature of sub-background in Kelvin; B is the total emissivity of the sub-radiance; λ1, λ2 are the start and stop wavelengths for every 0.01 micron step; and c1, c2 are the first and second radiation constants respectively.
The sky radiance data taken from LOWTRAN software is tabulated for sea level, 1 km and 10 km heights. LOWTRAN is software for calculating the atmospheric transmittance and sky radiance for a variety of path geometries based on absorption and scattering phenomena. The data available is from 1−15 μm range and with random step range. So, the data is interpolated for 0.01 μm step range, using linear interpolation, to make it compatible with radiance values.
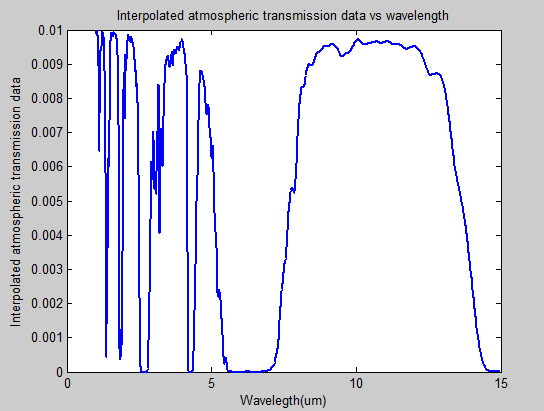
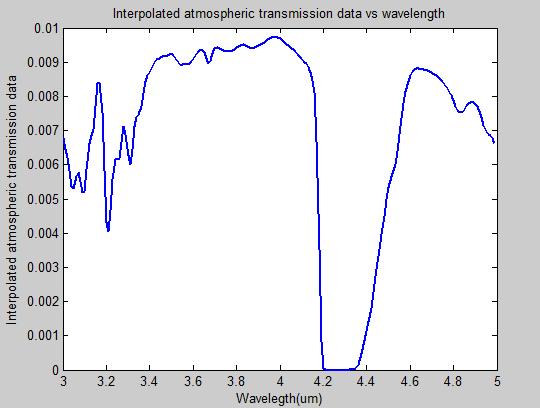
Similarly, atmospheric attenuation data is also taken from the LOWTRAN software and tabulated. This data is also linearly interpolated for 0.01 μm step range to make it applicable to the radiance values calculated for the same spectral range. Figure 5 shows the interpolated atmospheric transmission data for 1−15 μm wavelength band.
The atmospheric attenuation data is applied on individual values of the radiance to get the radiance after attenuation.
This is done by multiplying the interpolated data with the individual values of radiance and summing them using (3).
where: Ntgtτa is the total spectral radiance after atmospheric attenuation; is the target radiance at every 0.01 micron interval; is the atmospheric transmission at every 0.01 micron interval; and n is the number of 0.01 micron intervals in the detector waveband
The radiance values are normalized so that they can be used for colour-mapping. The calculated normalized values are multiplied with the colour index as per user selection. A colour-map of different sizes can be used to map radiance data. The typical colour-indices are 128, 256, 512, or 1024, and so on. However, to display the entire range of data correctly, the colour-index should be of sufficient and appropriate resolution. 128 colour-index has been selected which quantizes the entire radiance data in 128 steps. In MATLAB, there are 13 different colour-maps available. Each of these 13 colour-maps can be used for the getting the infrared signature. But the realistic results can be seen from jet, grey, HSV and the copper colour-maps. The jet and HSV colour-maps can be used to view the leading edge geometry of the model. The normalized radiance of each sub-target is then converted into corresponding RGB values of the selected colour-map. RGB values are used to control the material properties of model.
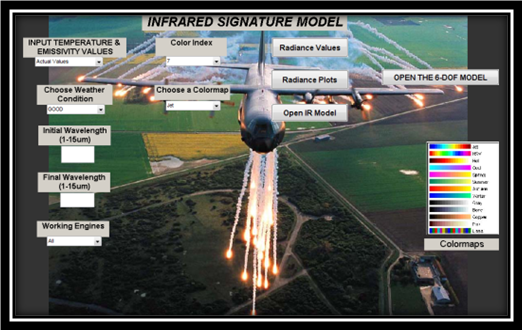
Finally, the calculated RGB colours are applied on different parts of the model. RGB colours are applied on the material property of specified node. A graphical user interface (GUI) has been developed for the ease of access of the user. The GUI incorporates:
- Selection from different temperature files to see the difference in IR scene for altered temperature values.
- Selection from different weather conditions (good, typical and bad) to model the atmospheric transmission.
- Selection from the number of engines working of the aircraft model to show how IR scene changes upon changing the number of engines working.
- Selection from different colour-maps to see the IR scene in different colour formats.
Figure 6 shows the GUI for the IR model.
Validation and optimization of IR model
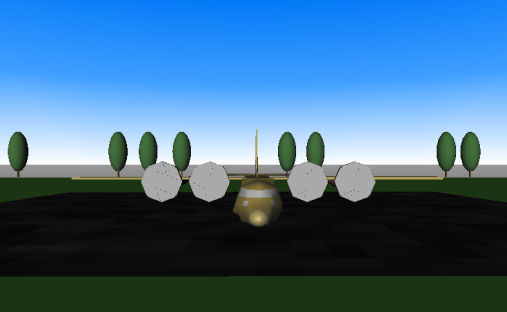
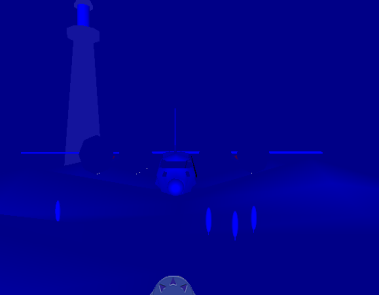
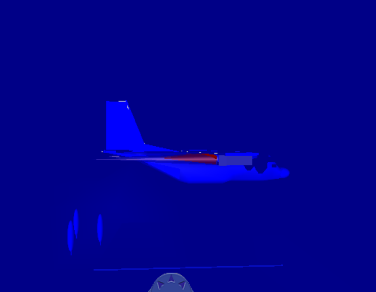
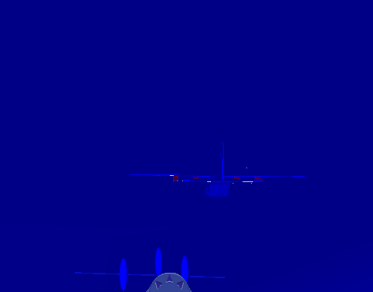
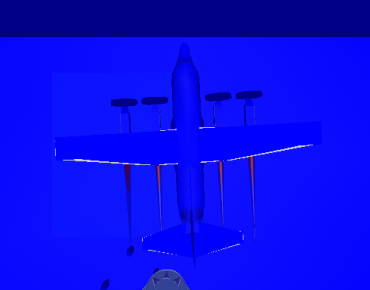
Images of the C-130 have been taken from the IR camera from different aspects like nose, tail, side, and offside to validate the developed IR model visually. These images are then compared with the developed IR model to ensure the validity the model. Figure 7 shows the modified model. The IR image of the developed virtual model of C-130 can be seen using different colourmaps. Figures 8 to 11 show the different views of virtual C-130 IR signature model using jet colourmap for 3-5 μm wavelength band using good weather condition with all the engines working. The IR image of the virtual model of C-130 has been developed using different colour-maps. The images are not very clear in 3−5 μm wavelength band as the radiations suffer more atmospheric attenuation in this band. This wavelength band is normally used for infrared modelling of hotter objects like plumes, tailpipe, and so on. Similarly, the images in 8−12 μm band are clearer than 3−5 μm band as the radiations suffer less atmospheric attenuation in this range.
IR modelling
To cater the aircraft manoeuvrability, a flight model is made using SIMULINK and Aerospace Blockset in MATLAB and is interfaced with the developed virtual model. The aircraft performs the 6 DOF in the virtual world and the model is interfaced with the Pilot joystick, throttle and rudder. The target aircraft can move in 6-DOF—that is, the target may move freely in three directions along the X-, Y- and Z-axes and can also perform ‘yaw’, ‘pitch’ and ‘roll’ movement with a joy stick control.
The yaw is rotation around a vertical axis, pitch is around horizontal axis and roll is rotation around the Z-axis. Figure 12 illustrates the 6-DOF of an aircraft. The 6-DOF is essentially required for modelling the aircraft movements in real scenarios [13].
![Aircraft’s 6-DOF movement [13].](/journals/journal-of-battlefield-technology/volume-12/issue-03/assets/12-3-6-sarfraz/figures/figure12.gif)
The virtual reality toolbox has the pilot joystick block which provides a convenient interaction between a SIMULINK model and the virtual world associated with a Virtual Reality Toolbox block. The Joystick Input block uses axes, buttons, and the point-of-view selector, if present. Figure 13 shows the pilot joystick interface which gives corresponding 6 outputs for the 6 DOF. Here, from the axes field three axes of rotation, in which two axes (pitch and roll) are from the joystick motion and one axes (yaw) is by rudder, is applied to the movement input of Euler Angle Block and three axes of translation, which are given by throttle, are applied to the Forces input of the Block. Button can be used for any function like changing the viewpoint, and so on. Before applying the joystick input to the moment block, tolerance, and sensitivity must be set for better visualization of the model manoeuvres.
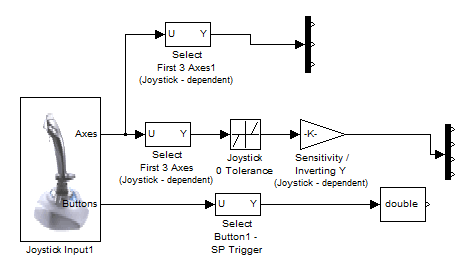
The 6-DOF (Euler Angles) block considers the rotation of a body-fixed coordinate frame about an Earth-fixed reference frame. The origin of the body-fixed coordinate frame is the centre of gravity of the body, and the body is assumed to be rigid, an assumption that eliminates the need to consider the forces acting between individual elements of mass. The Earth-fixed reference frame is considered inertial, an approximation that allows the forces due to the Earth's motion relative to the ‘fixed stars’ to be neglected [17]. Figure 14 shows the motion in Earth-fixed reference frame.
![Motion in Earth frame of reference [17].](/journals/journal-of-battlefield-technology/volume-12/issue-03/assets/12-3-6-sarfraz/figures/figure14.png)
Finally, the developed manoeuvrability model is interfaced with the virtual model using VR Sink block of Virtual Reality Toolbox which converts these data types to natural VRML.
| MODEL PART | RADIANCE (W m−2sr−1) |
|---|---|
| Inner plume | 5.8568e+003 |
| Outer plume | 83.7891 |
| Nose | 8.0805 |
| Glass Canopy | 0.1086 |
| Body | 3.3269 |
| Tailpipe | 40.3247 |
| Water | 2.3789 |
| Terrain | 2.0535 |
| Runway | 2.7613 |
| Terminal | 2.0968 |
| Lighthouse | 2.0968 |
| Trees | 1.6834 |
| Engines | 10.5335 |
| Block | 2.1233 |
| Light | 8.0980 |
| Propellers | 10.5199 |
| Leading Edges | 8.0805 |
| Sky Radiance at sealevel | 6.2961e-007 |
| Sky Radiance at 1 km | 4.1690e-007 |
| Sky Radiance at 10 km | 2.2028e-009 |
| Earth | 1.9131 |
Analysis and results
Results are calculated for the original model and the optimized model for 3−5 µm and 8−12 µm wavelength bands. These bands are of particular interest because the former is used for infrared modelling of the hottest objects like exhausts/tailpipes, plumes, and so on and the latter is used for infrared modelling in the presence of fog, haze, dust, and so on as it gives the smallest atmospheric attenuation in the specific range.
3−5 μm wavelength band
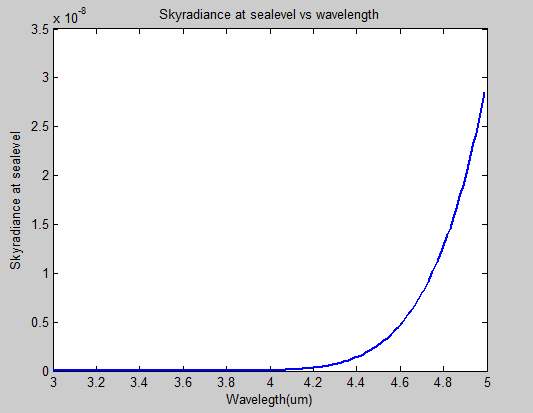
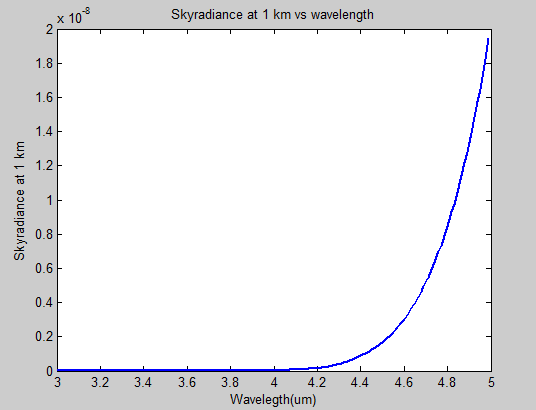
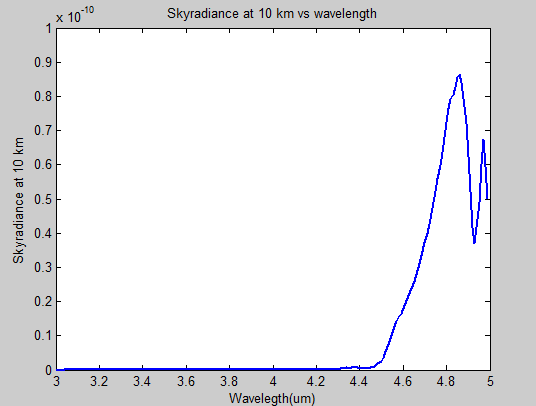
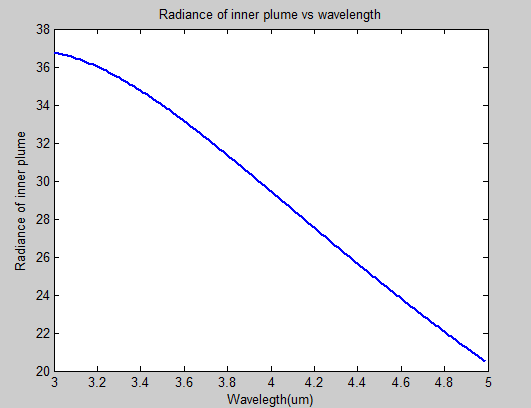
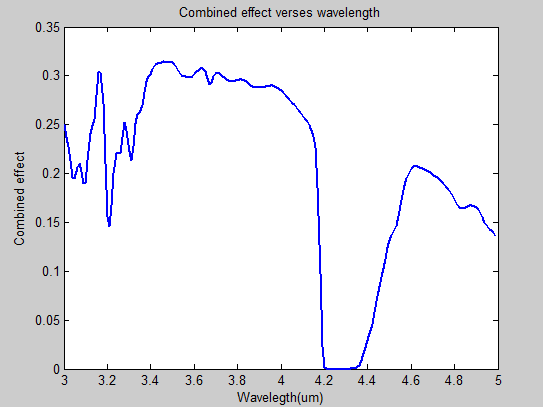
The numerical values of the target and background radiance before attenuation for good weather conditions are given in Table 2. Corresponding radiance values after attenuation and normalized radiance are given in Table 3 for the 3−5 μm band. Figures 15 to 17 give the skyradiance data for sea level, 1 km and 10 km height for the 3−5 μm band respectively for good weather conditions. Figures 18 to 20 give the radiance of inner plume, interpolated atmospheric transmission data and the total radiance from the inner plume after attenuation for the 3−5 μm band respectively for Good weather.
| MODEL PART | TOTAL RADIANCE AFTER ATTENUATION (W m−2sr−1) | NORMALIZED RADIANCE (W m−2sr−1) |
|---|---|---|
| Inner plume | 41.5720 | 1 |
| Outer plume | 0.5754 | 0.0138 |
| Nose | 0.0542 | 0.0013 |
| Glass Canopy | 7.2497e-004 | 1.7439e-005 |
| Body | 0.0222 | 5.3487e-004 |
| Tailpipe | 0.2736 | 0.0066 |
| Water | 0.0159 | 3.8202e-004 |
| Terrain | 0.0137 | 3.2967e-004 |
| Runway | 0.0184 | 4.4362e-004 |
| Terminal | 0.0140 | 3.3677e-004 |
| Lighthouse | 0.0140 | 3.3677e-004 |
| Trees | 0.0112 | 2.7012e-004 |
| Engines | 0.0708 | 0.0017 |
| Block | 0.0142 | 3.4103e-004 |
| Light | 0.0545 | 0.0013 |
| Propellers | 0.0709 | 0.0017 |
| Leading Edges | 0.0542 | 0.0013 |
| Sky Radiance at sealevel | 6.2961e-007 | 1.5145e-008 |
| Sky Radiance at 1 km | 4.1690e-007 | 1.0028e-008 |
| Sky Radiance at 10 km | 2.2028e-009 | 1.5145e-008 |
| Earth | 0.0128 | 3.0709e-004 |
8−12 μm wavelength band
The numerical values of the target and background radiance before attenuation for good weather conditions are given in Table 4 and corresponding radiance values after attenuation and normalized radiance are given in Table 5 for the 8−12 μm band. Since the exhaust plume is a selective radiator whose emissivity is wavelength dependent (in the 3−5 μm band), so radiance from the inner plume is negligible in this wavelength band.
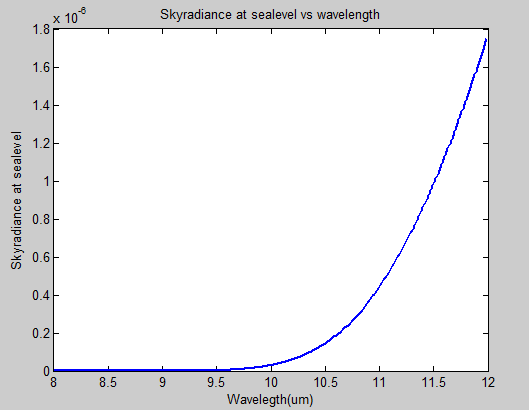
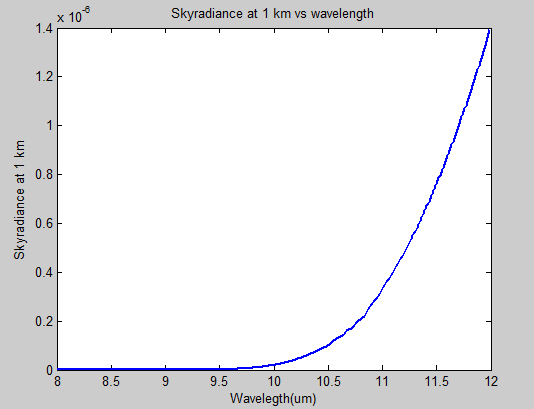
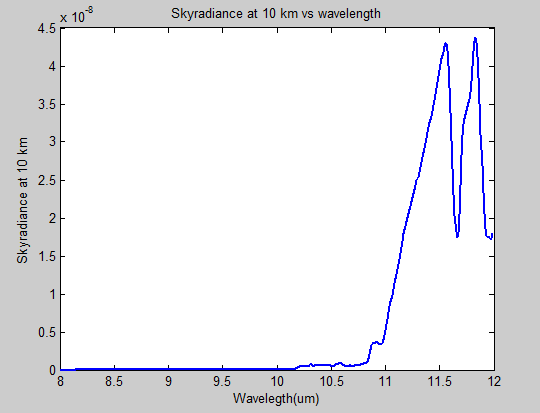
Figures 21 to 23 give the sky radiance data for sea level, 1 km and 10 km height for the 8−12 μm band respectively for good weather conditions.
| MODEL PART | RADIANCE (W m−2sr−1) |
|---|---|
| Inner plume | 1.4426e+003 |
| Outer plume | 144.9304 |
| Nose | 70.2429 |
| Glass Canopy | 7.2814 |
| Body | 47.1415 |
| Tailpipe | 144.3786 |
| Water | 41.9990 |
| Terrain | 38.3969 |
| Runway | 44.3984 |
| Terminal | 35.6472 |
| Lighthouse | 35.6472 |
| Trees | 36.1429 |
| Engines | 79.1164 |
| Block | 36.0985 |
| Light | 50.8458 |
| Propellers | 60.2598 |
| Leading Edges | 70.2429 |
| Sky Radiance at sea level | 1.2009e-004 |
| Sky Radiance at 1 km | 9.2273e-005 |
| Sky Radiance at 10 km | 2.7500e-006 |
| Earth | 37.1915 |
| MODEL PART | TOTAL RADIANCE AFTER ATTENUATION (W m−2sr−1) | NORMALIZED RADIANCE (W m−2sr−1) |
|---|---|---|
| Inner plume | 13.3910 | 1 |
| Outer plume | 1.3521 | 0.1010 |
| Nose | 0.6582 | 0.0492 |
| Glass Canopy | 0.0686 | 0.0051 |
| Body | 0.4423 | 0.0330 |
| Tailpipe | 1.3497 | 0.1008 |
| Water | 0.3943 | 0.0294 |
| Terrain | 0.3605 | 0.0269 |
| Runway | 0.4167 | 0.0311 |
| Terminal | 0.3346 | 0.0250 |
| Lighthouse | 0.3346 | 0.0250 |
| Trees | 0.3395 | 0.0254 |
| Engines | 0.7411 | 0.0553 |
| Block | 0.3389 | 0.0253 |
| Light | 0.4760 | 0.0355 |
| Propellers | 0.5640 | 0.0421 |
| Leading Edges | 0.6582 | 0.0492 |
| Sky Radiance at sea level | 1.2009e-004 | 8.9682e-006 |
| Sky Radiance at 1 km | 9.2273e-005 | 6.8907e-006 |
| Sky Radiance at 10 km | 2.7500e-006 | 8.9682e-006 |
| Earth | 0.3493 | 0.0261 |
Material field properties
The emissivity, transmission and reflectivity of the infrared radiation can be related to the material field properties of VRML. Radiance can be modelled by ‘emissiveColor’, reflectivity can be modelled by ‘diffusedColor’ and ‘specularColor’, transmission can be modelled by ‘transparency’ field of VRML. These VRML material fields are used to model the radiometric properties of objects and IR signatures in virtual reality. The list of material fields to model different radiometric properties of aircraft are given in Table 6.
Visual validation
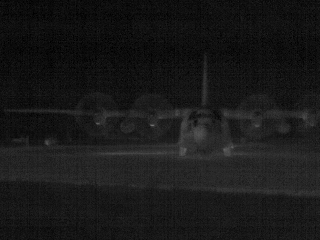
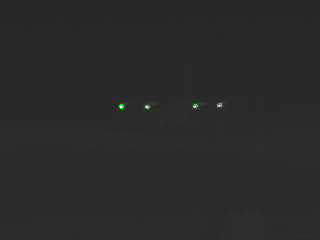
The visual validation is performed by taking the images of the C-130 using an IR camera from different aspects. The IR camera uses the 7.5−13 µm spectral band. Figures 24 and 25 show the different views of the aircraft using the IR camera compared with the developed model.
Conclusion
This paper presents a low-cost PC based method for the development of an IR signature modelling and simulation system. The high-fidelity physics-based IR signature of transport aircraft with different backgrounds is modelled. The atmospheric weather conditions such as ‘good’, ‘typical’ or ‘bad’ are incorporated to model atmospheric transmission and the sky radiance. Further, a 6-DOF motion platform has been developed to cater for the aircraft manoeuvrability in a 3D scene with the help of a pilot joystick with a throttle and rudder. The IR images of the modified model of a C-130 and the actual IR images of a C-130 have been compared. By adding the reflection effects and the path radiance and modelling earth-shine, sky-shine, cloud-shine and modelling solar irradiance as a point light source in VRML, the fidelity of the model can be improved. The atmospheric attenuation data taken from the LOWTRAN software did not incorporate the actual environmental conditions at the time of taking the IR images. This can be improved by taking the actual conditions or generating several environmental conditions. Fidelity can be increased by incorporating scattering effects and atmospheric turbulence effects. Also, clouds play a role in the background and foreground as they attenuate the radiance emitted from the object. Fidelity can be further increased by incorporating the 3D models of clouds.
Acknowledgement
The work on this project was supported by the National University of Sciences and Technology, Pakistan.
References
[1] L. Annamalai, Integrated Electronic Warfare Framework for Infrared Self-protection of Transport Aircraft, Council for Scientific and Industrial Research (CSIR), Defence Peace, Safety and Security (DPSS) www.sige.ita.br/IX_SIGE/ Artigos/GE_51.pdf/.
[2] C. Blasband, J. Bleak, and G. Schultz, High Fidelity, Physics-Based Sensor Simulation for Military and Civil Applications, Emerald Group Publishing Limited, Vol. 2, pp. 151–155, 2004.
[3] Tactical Engagement Simulation Suit (TESS), Tactical Technologies Inc. Ontario, Canada http://www.tti.on.ca/.
[4] Aerial Target IR Simulator and Naval Target and Countermeasures Simulator (NTCS) developed by W.R. Davis Engineering Ltd., Ottawa, Ontario, Canada. http://www.wrdavis.com/NTCS_aero.html.
[5] Sensor Vision, MultiGen-Paradigm CA, USA http://dspace.dsto.defence.gov.au/dspace/bitstream/1947/3325/1/DSTO-RR-0212%20PR.pdf/.
[6] IR Target Generator (IRTG) and Target IR Simulator (TIRS) of CI Institute CA, USA.
[7] D. Brennan, et al, Single High Fidelity Geometric Data Sets for LCM—Model, Martec Technical Report, DRDC Atlantic CR 2006-134, Nov 2006.
[8] (AGEMA) Thermovision-570, ‘Operating Manual’ Publ. No 557 265, Ed B, FLIR Systems AB, September 1998.
[9] Military Vehicles VRML Models, last viewed on 21 June, 2008. http://www.ocnus.com/models/Military/.
[10] ‘Virtual Reality Toolbox: User’s Guide Version 4’, The Math Works, Natick MA, 2004.
[11] http://www.fas.org/man/dod-101/sys/ac/c-130.htm.
[12] Michael C. Dudzik and Joseph S. Accetta, The Infrared and Electro-optical Systems Handbook, Vol. 4: ‘Electro-Optical Systems Design, Analysis, and Testing’, SPIE Optical Engineering Press, Washington, 1993.
[13] S. Baqar and M.A. Richardson, ‘Low Cost PC-based High Fidelity Infrared Signature Modelling and Simulation,’ pp. 99-101, pp. 175−178 Aug 2008. http://hdl.handle.net/ 1826/2912/.
[14] R.G. Driggers, et al, Introduction to Infrared and Electro-Optics systems, Artech House, London, 1999.
[15] R.D. Hudson, Infrared Systems, John Wiley & Sons, New York, Chapter 3, 1969.
[16] G.J. Zissis and J.S. Accetta, ‘The Infrared and Electro-optical Systems Handbook, Volume-1: Sources of Radiation’, SPIE Optical Engineering Press, Washington, 1993.
[17] MATLAB functions list, The MathWorks Institute, USA www.mathworks.com/support/functions/alpha_list.html/.