
Volume 12, Number 2, July 2009
Radar Target Transfer Functions And Their Application To Automatic Target Recognition And Matched Illumination Detection
- 1 Cranfield University, Shrivenham, Nr Swindon, OXON, SN6 8LA, UNITED KINGDOM.
- 2 Italian Air Force, Flight Test Centre, Pratica di Mare (Rome), ITALY.
- 3 Royal Navy, UNITED KINGDOM.
Abstract
The study of radar target transfer function (TTF) is relevant to both automatic target recognition using range profiling methods and the optimisation of detection performance by exploiting matched waveform techniques. However, range profiles, and their associated TTFs, are known to be highly sensitive to target geometry and aspect angle. This paper demonstrates that TTFs and their associated range profiles both decorrelate within 1° variation in aspect angle and that such rapid decorrelation is dominated by scintillation effects rather than the migration through range cell phenomenon. However, TTFs may offer advantages over range profiling since the former are typically characterised by many more data points than the latter. This leads to increased separability of different target classes and generally lower correlation statistics when using TTFs. TTFs are also important in the design of matched radar waveforms. A combination of experimental results using scaled model targets and simulation is presented which demonstrate that under ideal conditions matched waveforms can improve the signal to clutter ratio by up to 30 dB.
Introduction
Many modern military radar systems exploit wide band modulations in order to obtain a very fine level of range resolution. Sub-metre range resolution is obtainable and can be used to generate range profiles of targets which, in turn, lead to the ability to classify target types. Furthermore, the radar cross section (RCS) of complex targets is typically frequency-dependent and can vary quite considerably over the bandwidth used by such radars. The impulse response of a linear system is known as its transfer function. Strictly, the impulse response has an infinitely wide bandwidth, however, over a sufficiently wide radar band the RCS variation of a target with frequency approximates its target transfer function (TTF). A TTF may be transformed to an approximate range profile via an inverse Fourier transform; hence range profiles and TTFs are related by a linear transformation. The TTF may also be used as a means of target recognition [1]. The authors believe that working in the frequency domain (that is, with the TTF) has certain advantages over the time domain (that is, range profiles) when it comes to automatic target recognition (ATR) [2].
It stands to reason that a radar waveform designed to place its transmitted energy at the frequency of maximum target RCS will enjoy enhanced detection performance of that target. In practice, preferential detection of a certain target may be accomplished by the use of a waveform which is matched to the TTF. This is known as matched waveform illumination and has been the subject of recent research [3-5]. Detection performance is further maximised when the receiver transfer function is matched to the received waveform. Traditionally, this entailed the use of a receiver transfer function matched to the transmitted waveform. However, due to the frequency dependence of target RCS, the returning waveform is not an exact replica of the transmitted waveform and hence the receiver transfer function would no longer be perfectly matched to the received waveform. Since also the transfer function of unwanted clutter differs from that of the desired targets there exists the further tantalizing possibility that waveforms could be designed to enhance the returns from targets of interest whilst also suppressing the unwanted clutter return. Such a strategy would maximise the signal to clutter ratio (SCR) leading to improved detection in clutter limited scenarios.
The study of TTFs is relevant to both automatic target recognition (ATR) using range profiling methods and optimisation of detection performance by exploiting matched waveform techniques. However, range profiles, and their associated TTFs, are known to be highly sensitive to target geometry and aspect angle. This paper explores the sensitivity of TTF with aspect and compares the use of TTF with range profiles for ATR purposes. It goes on to quantify the potential improvement in detection performance of targets in a clutter-limited scenario. This work draws on measured TTF data of scaled model targets using a short range millimetre wave (MMW) radar which is supported by simulations of matched waveform illumination and detection to model the radar detection performance of the measured targets. The correlation of the measured TTF data with aspect angle is computed and presented.
The second section of this paper presents some of the underlying theory of matched waveform detection, the relationship between range profiles and TTFs and of the variation of TTF with aspect angle. The third section describes the experimental set up which was used to capture TTF data from two target types. In the fourth section we report on the investigation of the aspect dependence of TTF and in fifth section the simulation work on the matched waveform detection is presented. The sixth section presents a sample of the results and discusses them. Finally, the seventh section presents the conclusions.
Theory
Matched illumination/reception
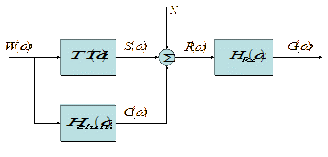
The detection of radar targets in clutter is represented by the signal flow diagram presented in Figure 1 [6]. In this diagram the transmitted illumination W(ω) is incident on the target, characterized by its transfer function TTF(ω), and the clutter, characterized by its transfer function Hclutter(ω). This results in the returns S(ω) and C(ω) from the target and clutter, respectively. We note that:
and:
S(ω) and C(ω) combine and are corrupted by white Gaussian noise N0 which results in the signal R(ω). This signal is then fed into the receiver, represented by its transfer function HRx(ω), and results in the output G(ω).
The signal at the receiver input is therefore given by:
and the signal at the receiver output is given by:
Matched illumination is obtained for the case when W(ω) = TTF*(ω) and the maximum signal-to-noise ratio (SNR) is obtained when HRx(ω) = S*(ω), where * denotes the complex conjugate.
The objective of matched illumination is to optimise the transmitted waveform, W(ω), for two objectives. Firstly, to maximise the target echo signal, S(ω) and secondly to minimise the clutter return, C(ω). Multi-objective optimisation problems are often characterised by having multiple solutions known as a Pareto set. However, it can be shown that the maximum SCR does not depend on the illumination waveform since it is applied both to the target transfer function and to the clutter transfer function. It turns out that:
That is, the optimum illumination (at least against the clutter) is not a question of the waveform, but has to be investigated in the choice of appropriate limited bandwidth(s) where the ratio between the target and the clutter transfer functions is maximum. From this point of view, the best signal-to-noise-plus-clutter ratio (SNCR) is obtained by transmitting matched illumination and employing the matched receiver filter in order to maximise the SNR, and focussing both transmission and reception in the bandwidth(s) where the ratio between the target and the clutter transfer functions is a maximum.
Correlation of TTF with aspect angle
The frequency dependence of the TTF(ω) arises from resonances between multiple scatterers on a target or individual structures of dimensions comparable with the wavelength. High range resolution radar (HRRR) seeks to generate a range profile with a fine range resolution. In the limit of infinite bandwidth (infinitesimal range resolution), the TTF(ω) is given by the Fourier transform of the range profile. Since the Fourier transform is a linear operation, one would expect both TTF(ω) and range profiles to be equally sensitive to aspect changes.
There are two effects which give rise to variations in range profiles with aspect changes. The first is the scintillation of unresolved multiple scatterers within a range resolution cell. The second is the migration of scatterers through range cells. Migration through range cells (MTRC) is avoided if the range of angular rotation is confined to [7]:
Where L is the cross range dimension of the target and ∆R is the radar range resolution. For a given ∆R, MTRC occurs more rapidly if a target’s cross-range length is greater and also if the scatterers are generally located towards the outside edges of the target.
Pairs of target profiles (range or frequency), X and Y, are compared using the Pearson Product-Moment Correlation Coefficient, rxy given by [8]:
Values of +1 indicate perfect correlation, whereas 0 indicates no correlation at all and a value of −1 indicates a perfect negative correlation.
Range resolution and ambiguity
The range resolution of a radar is given by:
In which c is the speed of light (3×10⁸ m/s) and B is the bandwidth of the transmitted waveform. A stepped frequency continuous wave (SFCW) waveform utilises N discrete frequencies of separation δf and hence:
The sampled frequency nature of the SFCW waveform invokes range ambiguity resulting in a maximum unambiguous range, Rmu of:
Experimental work
Experimental set-up
An Anritsu ME7808A Vector Network Analyser (VNA) was operated in the S11 mode with its port one connected to a standard gain 20dB waveguide horn antenna orientated for vertical polarisation. The VNA produces a low power, wide band SFCW waveform in the MMW band which is launched from the horn towards the test targets. The same horn antenna collects the signal returned from the target. In this way the VNA operates as a short range, high range resolution radar. The VNA is time gated to isolate the return from the target.
Target reflection data may be captured in the frequency domain (suitably time gated) and represents the TTF of the target or in the time (distance) domain and represents the range profile of the target. Two test targets were used; a 1:32 scale die cast model of an M1A1 Abrams main battle tank target and a 1:32 scale die cast model of farm tractor; these are illustrated in Figure 2. These are notable since one is overtly military and the other civilian. These were placed in turn on an expended polystyrene turntable which was further screened using radar absorbent material (RAM). The reflection from the turntable support was generally 10−20 dB lower than the reflection from the target. The turntable had an angular resolution of 1°. It is worth noting that no attempt is being made to determine the true target responses of these vehicles but that two arbitrary targets were selected having considerable differences in their geometry and therefore in their transfer functions. Therefore, the full polarimetric signatures over all angular ranges were not measured since it was necessary only to capture a few examples of TTFs. The targets were positioned approximately 1.3 m from the horn aperture, which was sufficient to be fully illuminated in all aspects and be in the far field of the horn.

Measurements for matched illumination [5]
For the TTF measurements which investigated the benefits of matched illumination the VNA was set up as follows:
Start Frequency 75 GHz
Stop Frequency 105 GHz
(Bandwidth, B 30 GHz)
Number of points, N 1601
Scaling the wavelength by the same factor as the model targets means that the laboratory measurements equate (approximately) to looking at the life-sized vehicles using a band of 2.34−3.28 GHz.
The targets were mounted on a board whose reflection was at least 15 dB lower than those of the vehicles and was therefore considered to be negligible. Target detection in clutter was carried out by placing the vehicles on the board upon which sand (to represent soil clutter), gravel (to represent clutter from rocks) or twigs and foliage (to represent woodland clutter) was also distributed. The transfer function of the target was measured in a head on and side on aspect. Similarly, the transfer functions of the clutter scenes was measured and also the composite target and clutter for various combinations of targets/aspects and clutter.
Measurements for correlation of TTF with aspect angle [2]
For the TTF measurements which investigated the correlation of TTF with aspect angle VNA was set up as follows:
Start Frequency 90 GHz
Stop Frequency 105 GHz
(Bandwidth, B 15 GHz)
Number of points, N 801
Thus with B = 15 GHz, N = 801, δf = 18.75 MHz, one obtains from (8) ΔR = 1 cm which is consistent with the resolution of modern HRRR scaled by the same factor as the target (that is, 32). From (10) Rmu = 8 m and is sufficient to avoid any second trace echoes corrupting the target data.
Correlation of TTF with aspect angle [2]
In this part of the investigation only the model tank target was used. The tank target had a footprint of 305 mm × 114 mm. From (6) one would expect MTRC to become significant at aspects which exceed 5° intervals. A zero degree elevation angle was maintained throughout all the experimental work.
Firstly, the correlation of TTF over successive target placements was measured. The target TTF was measured in the head-on aspect, then the target was rotated to 20° and then back to the 0° head-on aspect. Five repeated measurements were made at the head-on aspect in this way. The accuracy of the alignment of the target was estimated to be within 0.5°.
The tank TTF was also recorded at 1° angular increments over the full 360° range of aspect angles. The correlation between pairs of TTFs separated by 1° angular displacements was calculated. This was also repeated for pairs of TTFs at between 2−15° angular increments.
The TTF data was inverse Fourier transformed into the time domain so as to produce range profiles. The range profiles occupied between 30 (head-on) and 12 (side-on) range cells which is far less data than the 801 frequency points used to represent the TTF. The differing length of range profiles invalidates comparisons between range profiles at significantly differing aspect angles. Therefore, only range profiles within 20° of head-on (0°) were considered. As a target is rotated away from the head-on case, the range profile initially elongates as the radar looks down the diagonal. Beyond 20.5° of rotation the target range profile shortens as the radar looks across the width of the target. At 20° the target appears to have a range extent of 325 mm and so the comparison of range profiles over 30 range cells is valid. The correlation between pairs of range profiles separated by between 1 and 10° angular increments has then been calculated. It ought to be noted that whereas the range profile represents the returns from spatially distinct scatterers, the TTF captures the return from the whole target.
The range profiles were generated at a ΔR = 1 cm. Coarser range profiles were generated by averaging neighbouring range cells. Range profiles of ΔR = 2, 3, 4, 5, 6, 10 and 15 cm were generated. The correlation coefficient was calculated between pairs of range profiles separated in target aspect by 1°, 2° and 3° for results between 0° and 20° target rotation.
Simulation of matched waveform detection [5]
Three transmitted waveforms W(ω) were considered: (i) a rectangular pulse centred at 90 GHz having a bandwidth of 2.2%, a linear frequency modulated (LFM) chirp over the full measurement band of 75−105 GHz and the matched illumination over the band 75−105 GHz, all having the same total energy content. The receiver is modelled as having a noise figure of 10dB and a noise bandwidth, BN, given by:
where HRx(ω0) represents the peak value of the receiver transfer function and noting also that HRx(ω) = S*(ω).
The derivation of the matched transmitted waveforms, W(ω), was computed on the basis of the measured TTF(ω). The computer simulation then derived the signals S(ω), N0 and C(ω) and hence the composite signal R(ω). The simulation also derived the receiver transfer function, HRx(ω) as that function which is matched to S(ω) for the case of the matched illumination. The function HRx(ω) was maintained for all three test waveforms (rectangular pulse, LFM chirp and matched illumination). Finally, the output signal G(ω) was computed. Three metrics were used to quantify the detection performance of each waveform and target plus clutter scene, namely: (i) the transmitted to received energy ratio, (ii) the SNR and (iii) the signal to clutter ratio (SCR).
In addition to this, the frequency bands yielding the optimum SNCR were identified for the cases of the targets in the various clutter scenes (soil, rocks and woodland) and for a uniform clutter transfer function (−50 dB) for reference purposes. These bands were selected on the basis that the SCR was within 35 dB of its peak value (or 15 dB for the uniform clutter transfer function) and were of width ≥ 5 frequency points (that is, ≥ 75 MHz). The −35 dB level and 75 MHz bandwidth were arbitrarily selected thresholds which captured the principal SCR peaks and avoided overly complex waveforms associated with the noisy SCR profiles. The three detection metrics for the reduced matched illumination bands of optimum SNCR were not simulated in this study.
Results and discussion
Correlation of TTF with aspect angle
Repeated measurements at head-on aspect
The five repeated tests of target placement give rise to 10 combinations of pairs of TTFs. The correlation between these 10 pairs varies from 0.53 to 0.99. The mean of these 10 correlation coefficients is 0.8 which may be regarded as a high degree of correlation over the estimated angular displacement of 0.5°. However, in the realms of target identification, if one can only expect to obtain a correlation coefficient on average of 0.8 between two measurements that appear to be taken of nominally the same target aspect, one must temper one’s expectation of what may be obtained by correlating a measurement of a particular target aspect with a reference library. The corresponding pairs of range profiles (transformed from the TTF data) exhibited a mean correlation coefficient of 0.86. Although this suggests that range profiles correlate marginally better than TTFs it must be borne in mind that the correlation of the range profiles is on the basis of 30 data points whereas the correlation of TTFs is over 801 data points.
Correlation of TTF over all aspects
Pairs of TTFs pertaining to measurements taken of target aspects separated in azimuth by increasing amounts were correlated. The expectation was that TTFs with a small separation would correlate better than TTFs with a large separation. Figure 3 displays the correlation coefficient between a TTF measured at a particular target aspect and the TTF measured after rotating the target by a further 1°. Results are plotted for 0° to 359° target rotation.
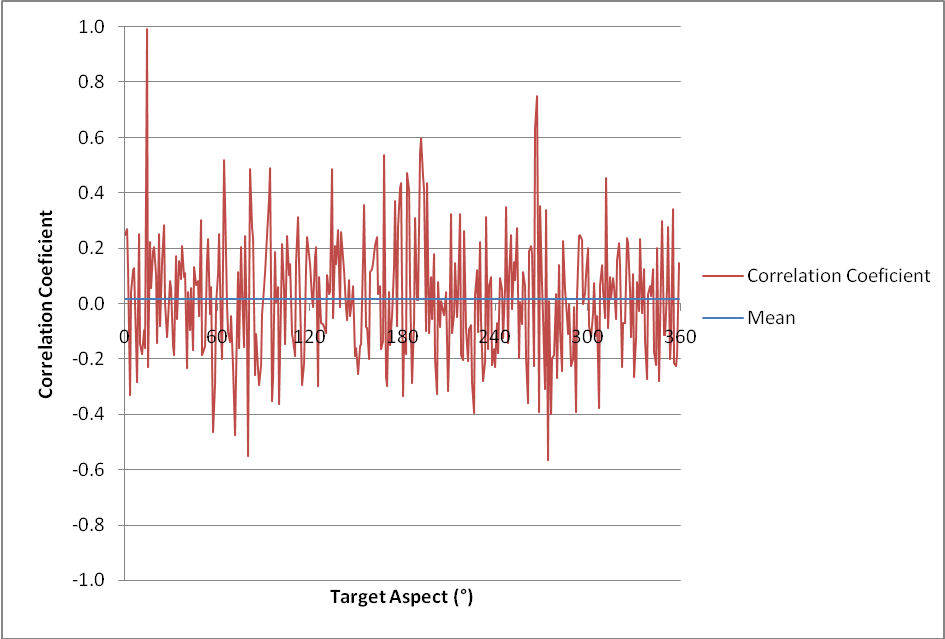
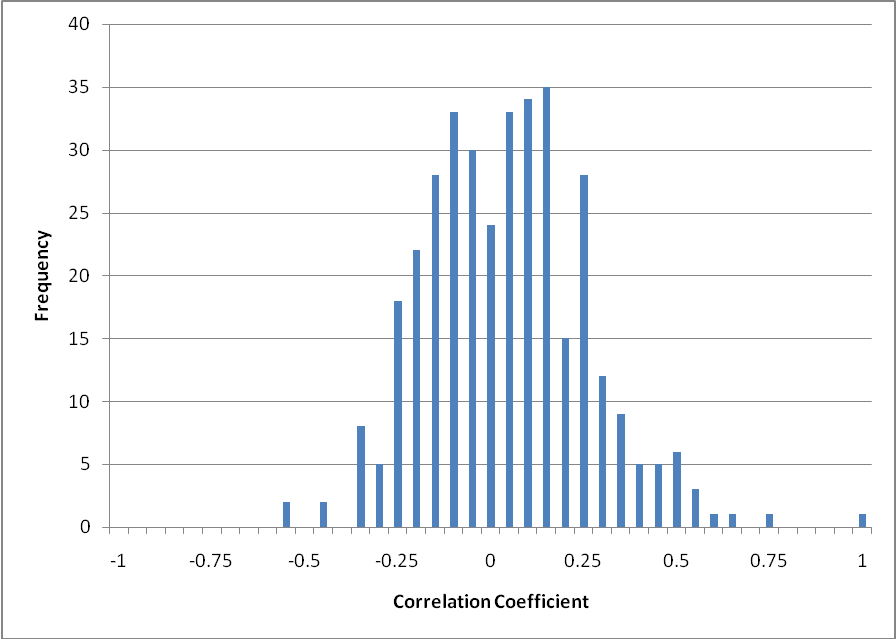
The mean correlation coefficient was 0.016 indicating that on average, pairs of TTFs measured at target aspects separated by 1° do not correlate with each other. One can see that at certain aspects, weak correlation is exhibited, with correlation coefficients of 0.4 to 0.8 and −0.4 to −0.6. These indicate weak increasing and decreasing linear relationships, but appear to be the exception rather than the norm. A correlation coefficient of 0.99 was obtained when correlating the TTFs associated with 14° and 15° target rotation, indicating that this pair of TTFs is strongly related. However, this result is so rare that it can be discounted as insignificant. The distribution of correlation coefficients is plotted as a histogram in Figure 4.
| Angular Separation Between Range Profiles (°) | Mean Correlation Coefficient |
|---|---|
| 1 | 0.427 |
| 2 | 0.403 |
| 3 | 0.393 |
| 4 | 0.341 |
| 5 | 0.340 |
| 6 | 0.350 |
| 7 | 0.446 |
| 8 | 0.342 |
| 9 | 0.332 |
| 10 | 0.360 |
| Mean | 0.373 |
The distribution has a standard deviation of 0.22 and supports the conclusion that TTFs associated with target aspects separated by 1° are unrelated.
Correlation coefficients were calculated in a similar manner for pairs of TTFs separated by an increasing aspect angle. For angular separations between TTF pairs ranging from 1° to 15°, the mean correlation coefficients varied from −0.015 to +0.017. These results show that in general pairs of TTFs are uncorrelated when measured at target aspects separated by between 1° and 15°. In general there is clearly no similarity or relationship between TTFs associated with target aspects separated by a degree or more. The change in TTF with target aspect occurs much more rapidly than originally expected and TTFs appear to totally de-correlate over 0−1 degrees of target rotation.
Correlation of range profiles with aspect angle
The range profiles of the tank at 0° (head-on), 1° and 2° occupy 30 range cells and are shown in Figure 5.
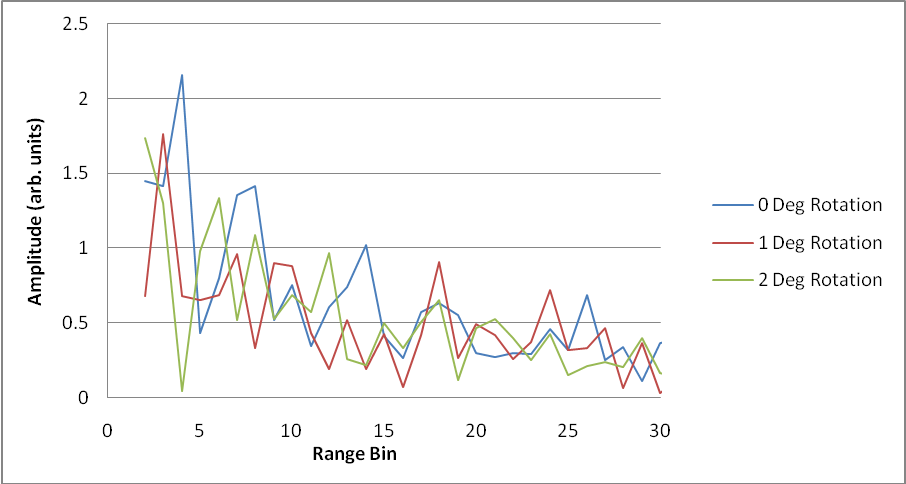
The benefit of analysing range profiles as opposed to TTFs is that one might start to associate features of the range profile with physical features on the target. In this case the initial peak might be associated with the front surface of the tank’s chassis, with the second peak four range bins (40 mm) later perhaps associated with the turret. One observes that the magnitude of the range profile tends to decrease with range, or distance from the antenna, R. This can largely be attributed to a combination of the 1/R4 reduction in received power plus the effects of self-shadowing. From Figure 5 one can observe some similarity between the three profiles, for instance the common peak at around range bin 18. There are also, however, some notable differences. The initial peak at range bin 4 in the 0° profile quickly becomes almost zero (0.04) after 2° rotation. This illustrates the effect of scintillation.
Table 1 shows the results of correlating pairs of range profiles between 0° and 20° separated by an increasing amount in azimuth. The correlation coefficients were calculated over the first 30 range bins. The values of 0.3−0.4 (mean 0.37) indicate some weak correlation, but one can see that increasing the angular separation between range profiles does not significantly change the degree to which they correlate. The range profiles all exhibit a degree of similarity, possibly caused by the common trend to reduce in magnitude with range due to self-shadowing effects and increasing range. These results show that de-correlation occurs much more quickly than predictions based on MTRC—equation (6). This suggests that scintillation effects are more significant and far more sensitive to aspect angle than MTRC.
Correlation of range profiles with range resolution
Range profiles for ∆R = 1, 2, 3, 4, 5, 6, 10, 15 cm have been generated and compared. The correlation coefficient was calculated between pairs of range profiles separated in target aspect by 1°. This was done for results obtained for between 0° and 20° target rotation, so as to avoid the complications with shortening of the range profile with rotation. The mean correlation coefficient was calculated for the various values of ∆R, and the results are plotted in Figure 6.
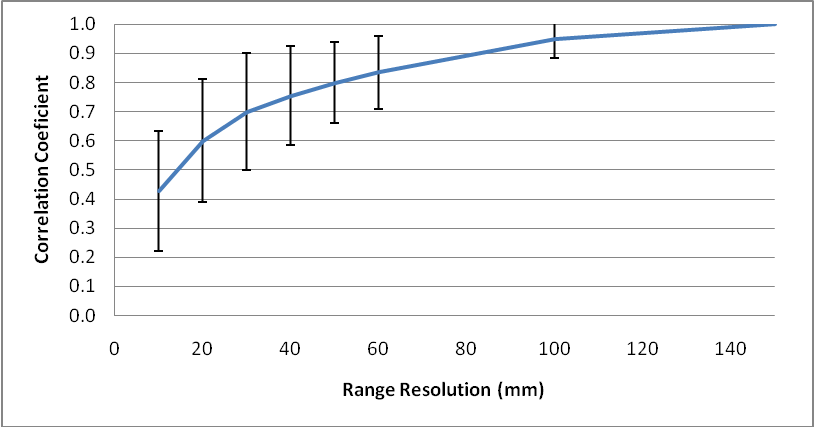
Each data point has an associated error bar extending to ±1 standard deviation about the mean. One observes that the mean correlation coefficient increases with ∆R whilst the standard deviation tends to decrease. (Standard deviation remains between 0.20 and 0.21 for ∆R between 10-30mm, and drops off thereafter.) When the ∆R is set to 150 mm, the correlation coefficient becomes 1. In this case, two sets of only two data points (range bins) are correlated. The overall tendency in all cases is for the amplitude of the range profile to decrease with range. The correlation coefficient is therefore calculated between two linearly decreasing variables. When two variables decrease together, the correlation coefficient will equal 1.
This clearly illustrates the limitation in using correlation coefficient as a means of comparison between small samples of data and supports the argument that it is ‘easier’ to obtain higher values of correlation coefficient between smaller sets of data. Similar correlation statistics were obtained for the correlation between pairs of range profiles separated by 2° and 3° in azimuth.
Matched waveform detection
The different combinations of target type, aspect and clutter type generate a mass of statistics. A summary of the results with a representative sample is given below.
Detection metrics—summary
The transmitted to received energy ratio and the SNR of the rectangular pulse varies somewhat from one target/clutter combination to the next. This is because all its power is concentrated into a narrow band which may coincide with a peak (or trough) in the target transfer function. This suggests that the best detection performance results from a CW waveform (that is, an infinitely narrow one) at a frequency coincident with the maximum value of TTF(ω), however, this is not a practical waveform for most applications. In general, the spectrum of a narrow band rectangular pulse does not coincide with a TTF(ω) peak and so, in general, it is outperformed by the matched illumination. The matched illumination always outperforms the LFM chirped waveform.
For the tank target (head-on and side-on aspects) the transmit to receive energy ratio is between 20−38 dB superior for the matched illumination over the other two waveforms. This means that between 20−38 dB more transmitted power is required for the rectangular pulse and LFM waveforms in order to recover the same received energy, and hence the same detection performance, than for the matched illumination. The SNR of the matched illumination is between 19−43 dB better than that of the other two waveforms. The SCR of the matched illumination is between 1.3 dB and 11 dB worse than that of the other two waveforms. For the tractor (both aspects) the transmit to receive energy ratio is between 10−40 dB superior for the matched illumination over the other two waveforms. The SNR of the matched illumination is between 10−46 dB better than that of the other two waveforms. The SCR of the matched illumination is between 0.1−17 dB worse than that of the other two waveforms.
Detection metrics—representative sample
The case of the tank in a head on aspect in the presence of rock clutter is fairly representative of the trends observed throughout all the tests. For this situation we find that 30 dB more transmitted power is required for the rectangular pulse and 28 dB more power for the LFM chirp than is required for the matched waveform in order to recover the same received energy and hence the same detection performance. The SNR of the matched illumination is some 30 dB and 37 dB better than those of the rectangular pulse and LFM waveforms, respectively. The SCR resulting from the matched illumination is around 6 dB worse than the other two waveforms. This anomalous result arises because the waveform has not been optimised for the best SNCR since the transmitted energy is spread across the whole frequency range (75−105 GHz) instead of being focussed into a few narrow, optimal bands.
Matched illumination bands of optimum SNCR
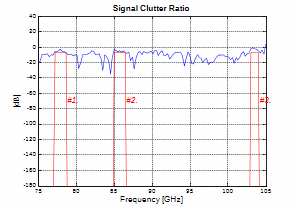
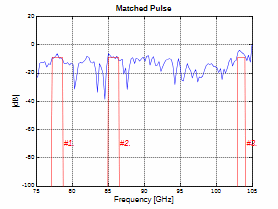
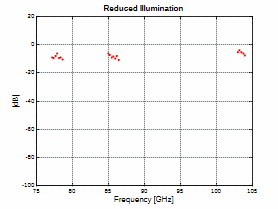
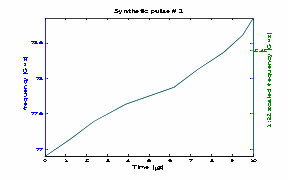
For the matched illumination case of optimum SNCR, W(ω) was derived as an approximate match to TTF(ω) by identifying those bands for which the SCR exceeded an arbitrary threshold and then deriving nonlinear chirp waveforms within each band which are matched to TTF(ω). Bands narrower than five consecutive frequency points were dismissed as these were regarded as noisy phenomena. The nonlinear chirps were synthesized using stepped frequency waveforms in which the step size was taken as 18.75 MHz, this being the limitation of the VNA used. An example of a matched waveform is illustrated in Figures 7−10. This case considers the tank target in a head on aspect with a constant clutter spectral power density at −50 dB/Hz. Figure 7 illustrates that there are three bands of maximum SCR which are within 15 dB of its peak value. Within these bands, the TTF(ω) is sampled in order to produce three corresponding matched waveforms, as illustrated in Figure 8. Figure 9 illustrates the stepped frequency samples necessary to provide the matched illumination within the three bands previously identified. The matched waveforms may be produced by varying the power or dwell time at each frequency sample. In this study, a variation of dwell time is assumed and results in nonlinear chirp waveforms. Figure 10 illustrates the nonlinear chirp waveforms necessary to provide the matched illumination within each band. The total matched waveform can be formed by stitching the three nonlinear chirps together.
Conclusions
It has been shown that both TTF and range profiles vary significantly with changes in target aspect of more than 1°. It has also been shown that there exists some variation between TTFs and range profiles when the target aspect is changed by less than 10, indicating that both TTFs and range profiles are very sensitive to small changes in aspect. In the case of small changes in target aspect (<1°), pairs of TTFs were shown to have a mean correlation coefficient of 0.80. Under a similar analysis, pairs of range profiles had a mean correlation coefficient of 0.86. The similarity between these results is to be expected since TTFs and range profiles are related by a Fourier transform. The TTF result is perhaps more significant given the size of its data set. As a correlation coefficient of 0.8 was obtained by comparing TTFs at nominally similar aspect angles, one must moderate one’s expectation of what value might be obtained when searching for very close matches. For instance, when employing profile-correlation techniques, the threshold of correlation coefficient which indicates a probable match needs to be established at a value significantly lower than 1, possibly around 0.8, and should be adjusted according to the size of data sets being compared.
This result is, however, quite different when considering larger changes in target aspect. Pairs of TTFs separated by between 1° and 10° target rotation had a mean correlation coefficient of 0.003, indicating that there is no similarity between such pairs. Furthermore, the correlation coefficient between pairs was shown not to significantly deteriorate with increasing separation in aspect. Pairs of TTFs separated by just 1° correlated just as poorly as pairs separated by 10°. Scintillation effects seem to be highly sensitive to aspect angle and tend to dominate over MTRC.
Given such a rapid variation in TTFs, when considering profile-correlation techniques within the realms of ATR, it may be appropriate to space TTFs within the reference data set at intervals of less than 1°, such as every 0.5° change in aspect. This leads to a requirement to store 82506 TTFs in order to produce a reference set of data covering the upper hemisphere of a single ground target. This number is to be multiplied by the number of expected target types. Alternatively, 82506 different matched waveforms may be required in order to ensure matched illumination of a particular ground target over any aspect. This in turn highlights the signal processing and data storage implications associated with such rapid variations in TTF.
It is also worth noting that whilst the range resolution used in the experimental work here scales accurately to current HRRR systems, the frequency scales to approximately 3 GHz on the life-sized target. Should the life-sized target be illuminated by a higher-frequency radar such as a 35 GHz or 94 GHz seeker, then one may expect scintillation to be even more sensitive to aspect changes. Correspondingly, TTFs and range profiles will decorrelate even quicker than the results presented here with changes in aspect. The rapid variation in range profiles with aspect reported on here affirms the view of Liao et al [7] who report that:
“For microwave radars, aspect changes of tenths of 1° can cause drastic changes in HRR profiles”.
When considering range profiles, some amount of correlation was evident. Correlating pairs of range profiles separated by between 1° and 10° target rotation produced a mean correlation coefficient of 0.373, indicating a weak relationship. However, as per TTFs, this correlation coefficient did not significantly vary with increasing separation in aspect between pairs. Pairs of range profiles separated by 1° correlated to approximately the same extent as pairs separated by 10°. Degrading the range resolution resulted in superior correlation statistics due to the trend in range profiles to decrease with increasing range and because of the reduced data set (fewer range cells). However, the loss of resolution associated with coarser range profiles reduces the separability of different target classes and so is not beneficial to ATR.
It is a step too far to conclude from this that range profiles correlate better than TTFs, and hence that the time domain may be better to work in from the perspective of non-cooperative target engagement or similar applications. The TTFs each contained many more data points than the range profiles. As mentioned earlier, it is ‘easier’ to obtain a higher correlation coefficient from two smaller data sets than from two larger ones. The TTFs present a picture of a far higher data dimension that has more scope for variation (including the separability of different target classes) and hence de-correlation than the lower dimension range profiles.
This study has also shown how the transfer functions of targets may be used as the basis of matched illumination waveform design and has quantified the potential benefits of these waveforms. Very significant improvements in the ratio of the transmit-to-receive energy and in the SNR result from the use of matched target illumination and matched receiver response. However, some degradation in the SCR is noted for the matched illumination/matched receiver response case. Improvements in the SCR could be obtained by using reduced matched illumination bands which are optimised for optimum SNCR. This study has also revealed that target transfer functions can vary considerably, having peak to peak variations by as much as 30 dB. Since targets are characterised by such large variations there are significant advantages to be gained from the design of appropriate waveforms, if only in the selection of the centre frequency of a crude narrowband signal. Furthermore, it is believed that the target transfer function nulls are equally important as the peaks for the purposes of automatic target recognition and matched waveform design.
It should be recognised that the investigation to assess the benefits of matched illumination have been conducted under ideal conditions; the clutter was stationery and so its TTF should not vary, which is unlikely to be maintained for any period in practice. Furthermore, the simulations reproduced the exact matched waveforms and the exact matched reception both of which would be very difficult to realize in practice. Therefore, the improvements reported on here represent the maximum possible improvements which may be obtainable under ideal, and perhaps exceptional, circumstances. In practice, the actual detection performance improvements are likely to be significantly lower.
References
[1] S.K. Wong, “Non-Cooperative Target Recognition in the Frequency Domain” IEE Proceedings of Radar Sonar and Navigation, Vol. 151, No. 2, 2004.
[2] J.W. Hyde and C.M. Alabaster, “Correlation of Target Transfer Functions and Range Profiles as a Function of Aspect Angle and Resolution”, Proceedings of IET Waveform Diversity and Digital Radar Conference, Savoy Place, London, UK, 8−9th December 2008.
[3] D.A. Garren, J.J. Sacchini, and J.S. Goldstein, “Investigation of Non-Traditional Transmit Waveforms for SAR Based Target Detection”, Proceedings of International Conference on Waveform Diversity and Design, Edinburgh, 8−10 November 2004.
[4] D.A. Garren, A.C. Odom, M.K. Osborn, J.S. Goldstein, S.U. Pillai, and J.R. Guerci, “Full-polarization matched-illumination for target detection and identification”, IEEE Transactions on Aerospace and Electronic Systems, Vol. 38, No. 3, July 2002.
[5] F. Soldani, C. M. Alabaster, “The Benefits of Matched Illumination for Radar Detection of Ground Based Vehicles in Clutter”, Proceedings of International Conference on Waveform Diversity and Design, Pisa, Italy, 4–8 June 2007.
[6] D.A. Garren, M.K. Osborn, A.C. Odom, J.S. Goldstein, S.U. Pillai, and J.R. Guerci, “Optimized Target Detection and Identification Using Full-Polarization Radar Waveforms”, Proceedings of International Conference on Waveform Diversity and Design, Edinburgh, November 2004.
[7] X. Liao, Z. Bao, M. Xing, “On the Aspect Sensitivity of High Resolution Range Profiles and Its Reduction Methods”, Proceedings of IEEE International Radar Conference, 2000.
[8] C. Wilson, Applied Statistics for Engineers, Applied Science Publishers Ltd., 1972.