
Volume 11, Number 3, November 2008
Meeting The Challenges Of Delivering Software Development Projects: Simulation Of Alternate Project Strategies
- 1 School of Information Technology and Electrical Engineering, University of New South Wales at the Australian Defence Force Academy (UNSW@ADFA), Northcott Drive, CANBERRA, ACT, 2603, AUSTRALIA.
Abstract
Despite the growing body of knowledge regarding software engineering and management of projects involving software development or integration, such projects frequently overrun cost and schedule estimates by a factor of two or more. In the first part of this two-part series, it was argued that conventional methods of estimating the effort involved in software development projects are flawed because they do not take rework into account, or at the very least are unable to accommodate reliably the need for rework effort. Rework impacts upon almost every aspect of software projects, from the earliest stage when requirements are being captured, through to final acceptance testing. How rework impacts upon each phase of the project, and the project overall, is identified through the use of a dynamic simulation coupled with scenario planning. Using the approach described in this article, managers of projects involving software development can identify where management and engineering efforts are best directed, before committing to delivering a project which subsequently proves unexpectedly costly or involves undue risk.
Introduction
This article is the second in a two-part series (see McLucas, 2008 for part one) which examines software development projects and how we might improve their management. Modern communication and information systems (CIS) and weapons systems cannot be separated from the software that enables their operation. This software takes a wide variety of forms. Software might be a computer application designed to generate codes for communications security, it might control the flight of a missile. Software might be embedded in a microprocessor integrated circuit (IC) chips or might designed as an application or operating system for a microcomputer.
The need to develop highly functional software for military applications is accompanied by an imperative that the software is highly reliable. Despite the demands for high levels of reliability, given enough time and resources software having the most demanding functional requirements can be developed. However, a critical challenge for those who define capability requirements, develop military systems and those who have responsibility for acquiring them that they meet user requirements, and those systems need to be delivered in a cost-effective and timely manner.
Regardless of the software being bespoke, and thereby having to be developed ab initio, or being the product of integration of existing commercial off-the-shelf (COTS) or military-off-the-shelf (MOTS) software, the threats to achieving the required performance on time and within budget can be substantial. Indeed, software development and integration projects are costly and frequently by the time they are ultimately delivered they can exceed the original schedule and budget estimates by factors often between two and three. History tells us that conventionally based estimates need to be inflated to reflect real costs and schedules.
This article examines how we can improve our estimates of time and cost for software projects, and how we might develop effective strategies for managing resources allocated to such projects, whilst improving the management of quality. How system dynamics modelling and simulation coupled with scenario planning can be used to improve our estimates is also explained.
The challenge of accommodating rework cycles in developmental projects
Many activities in developmental projects involve rework and iteration (after Boehm, 2007):
- incremental, iterative development of statements of requirement and confirmation by users;
- incremental or concurrent, iterative requirements definition in software engineering terms;
- incremental, iterative systems decomposition and definition;
- development of stakeholder trust and commitment;
- development of user trust and commitment;
- development of trust between sub-contractors and contractor or contractor and customer, noting that new partnerships between contractors and sub-contractors are increasingly frequent: they start with relatively little built-up trust; and
- development of group performance, which is vitally dependent on development of robust trusting relationships through the experience of a history of honoured commitments: without trust, partners must specify and verify details, which is increasingly untenable in a world of rapid changes.
Meeting the challenge of managing developmental projects
In conventional project management terms, rework is almost universally accommodated by providing management reserves or contingency, where the provision of these is made on the basis of the experience of the estimator. Infrequently, or rarely, is the extent of rework quantified with any rigorous understanding of rework mechanisms, with the consequence that projects such as those involving software development result in significant cost and schedule overruns. It does not require much imagination, and reflection on the rework metaphor (McLucas, 2008), to realize that our usual methods of estimating the extent of rework will fail us except where rework is minimal such as that for routine, technically naïve projects. To make reliable estimates of the impact rework will have on software development projects, we need different techniques.
Dynamic model of a single phase project involving rework
Single phase development projects involving process feedback, that is, having a single rectification or rework cycle, have been described in the system dynamics modelling literature (Abdel-Hamid, 1984; Abdel-Hamid and Madnick, 1990; Ford and Sterman, 1998 and Taylor and Ford, 2006). In each case these studies have set out to explain why even experienced project managers consistently and seriously underestimate how long such projects are likely to take. System dynamics modeling techniques (Coyle, 1996; McLucas and Linard, 1999; Wolstenholme, 1990; Wolstenholme and Coyle, 1983; Sterman, 2000; McLucas, 2005) are most suitable for this analysis because they focus on feedback causality. The application of these techniques, firstly to a single phase developmental project, and secondly to a multi-phase software development project is described.
In system dynamics modelling, stock-and-flow diagrams depict the relationships between state and rate-controlling variables. The basic rework cycle for a single phase software development project, depicted as a stock-and-flow diagram, is shown at Figure 1. The rework cycle involves a physical feedback loop where primary rates of flow through the phase Rate of Writing Code, Rate Code Approved and Rate Code Released and the rework cycle rates Rate of Inspecting Code and Rate of Rectifying Code Found to be Defective, are constrained by application of limited resources and the need to share resources within this single phase.
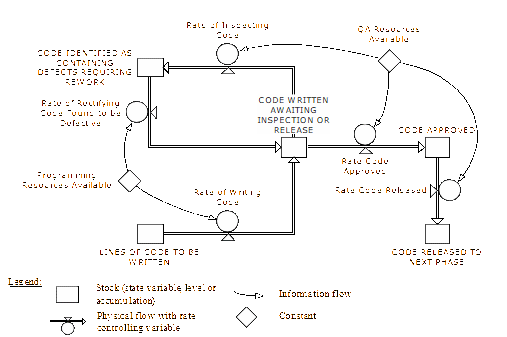
As code is written, defects are inadvertently added. The rate of adding defects is linked to the rate of writing code, and can be estimated according to the maturity of the software engineering practices and the skill of the programmers. Depending on the intensity and effectiveness of effort applied to inspection, many of these defects will be discovered. Another sector of the simulation model (not shown in Figure 1) contains linked variables. These are used in calculating, for example, the likely incidence of defects being present in written code, probability defects will be found through routine quality assurance (QA) processes, allocation of resources to programming and rectification work, and allocation of QA resources.
In the following examples the focus is on a single phase. Later, focus will shift to a project which has several such phases. Whilst resources available to do the work are limited they are initially dedicated to the current single phase. As the number of phases in the project increase so the need to share the project’s total resources across each of the phases increases. As will be shown later, allocation of resources across the phases constrains the rate of working and priorities need to be set for the dynamic re-allocation as the work to be done shifts from earlier to later phases.
Figure 2 depicts the rates of work achieved and residual defects when there is no inspection and no rework. Note that the y-axis indicates relative scales for the different variables and that this figure and the two that follow, Figures 3 and 4, should be used for comparison.
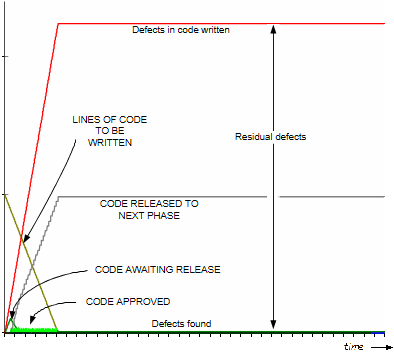
In this case code is released almost as quickly as it is written and time taken is determined simply from information about the amount of code to be written and the average expected time taken to write each line of code.
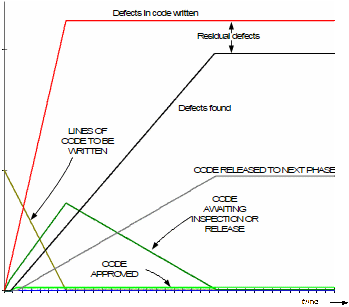
When high rates of effort are allocated to inspection and consequent rectification, the residual defects are greatly reduced, as shown in Figure 3.
When moderate rates of effort are allocated to inspection and consequent rectification, the residual defects are greatly reduced, as shown in Figure 4. Note that whilst there is an obvious reduction in residual defects, the rate of writing code is slowed because effort must be applied to rectification work. Code awaiting inspection or release accumulates before being reduced because programming effort is divided between the writing of code and rectifying defects. Underlying the behaviour over time depicted in Figure 3 is an assumption that the efforts of programmers, shared between writing code and rectifying defects, are not dynamically re-allocated with priority of effort being given over to rectification work once initial writing of code has been completed.
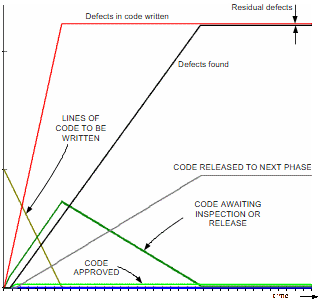
However, if priority of effort is shifted to rectification once initial writing has been completed, in an equivalent time and with the same effort applied to inspection additional defects are found and rectified. This is shown in Figure 4.
Figures 3 and 4 represent two of range of possible options for re-allocating available resources. Investigating such options becomes more important when there is more than a single development phase, in which case dynamic allocation of resources across the phases becomes increasingly important. Re-allocation and other such options can be investigated through a series of ‘what if’ scenario-based simulation runs.
Dynamic model of software development projects
A dynamic model of a generic software development project described in subsequent sections of this paper is assumed to have four interconnected phases:
1. Code writing.
2. Integrating coded modules.
3. Integrating modules into functional blocks.
4. Acceptance testing.
Each phase contains its own rework cycle. For the analysis described in this paper, it is assumed that rework outside that defined within each of the four phases is not required. For example, this means that during the acceptance testing phase, code which is found not to function as required is reworked during that phase rather than being sent back to an earlier phase for the rework to be done. This is an alternate representation of the Waterfall Development Model rather than a simplification of that model.
As the project proceeds, resources are progressively re-allocated depending on a balance of competing priorities for:
- initially completing work, such as writing code or integrating coded modules;
- managing the quality of work done in the first instance;
- applying inspection effort to finding defects; and
- applying programming effort to rectifying defects found.
The dynamic re-allocation of resources is aimed at achieving most effective employment of available. An unintended consequence, albeit a necessary consequence, is that some activities proceed more slowly than they might otherwise. For example, coding takes longer than would be possible if all resources were allocated to that task first. However, the actual allocation is based on considerations of the need to allocate resources to concurrent activities.
The options for resource allocation are investigated through a series of scenario-based simulations which seek to investigate time and cost implications. Through repeated simulations under a variety of scenarios, strategies are identified for:
- making resource allocations which are effective in reducing the time taken to complete the whole project, rather than a particular phase;
- making resource allocations which are effective in reducing the cost taken to complete the whole project, rather than a particular phase;
- identifying where resource allocations are critical, and where supplementation may be needed;
- rate-determining steps in processes, particularly where a number of activities are concurrent or otherwise interdependent;
- allocating QA effort to reduce defects to target levels across the whole project; and
- making trade-offs of cost and time for delivering the project.
These simulations reveal that traditional methods of estimating the work needed to complete the project are inappropriate.
Results of simulations
Figure 5 (adapted after Elwell, 2007) demonstrates the simulated results of the project being completed over time. Rates of completion of each phase are shown. Note that the y-axis does not depict comparative scales for the extent of the work conducted in each phase. Rather, the maximum amount of work conducted in each phase has been normalized to 100%. For example, the range of values for Phase 1 To Be Completed is 32,000 to 0 lines of code, whilst Phase 4 To Be Completed is 1 to 0 where 0 represents completion of acceptance testing of the whole operating system. Each represents 100% of the work done.
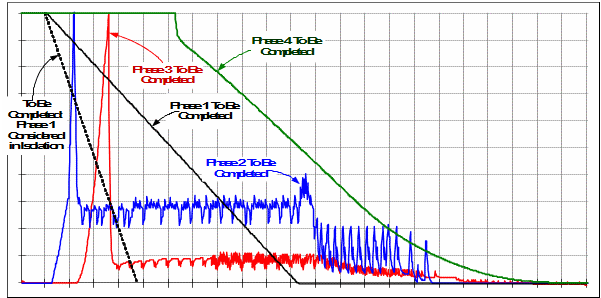
For the intermediate phases, represented by Phase 2 To Be Completed and Phase 3 To Be Completed the maximum value in Figure 5 represents the amount of work that accumulates before the Phase is allowed to commence. For example, assembling of modules in Phase 2 does not commence until a specified number of modules, say 10, are available to be assembled. A similar control applies to Phase 3.
The dotted line To Be Completed: Phase 1 Considered in Isolation depicts the estimated work needed to complete Phase 1. Whilst this estimate is based on the model depicted in Figure 1, insofar as takes into account the need for inspection and rework to keep the defects at or below the target level, it does not take into account the need to share available resources with other phases. When concurrent working, and rework, with limited resources is taken into account, the rate of completing is significantly reduced. See Phase 1 To Be Completed.
The need to share resources across the other phases, whilst allocating resources for work, rework, inspection and QA activities within phases, impacts on the rates of working that can be achieved in each of the phases. The rates of working and progress to completion of the project are non-linear.
It is of particular interest that when Phase 4 is 90% complete, 25% of the total time to complete the project is needed to complete the last 10%. In this case applying additional resources in Phase 4 will not improve the situation. The most effective way to reduce the time to complete the project is to employ additional resources from the outset.
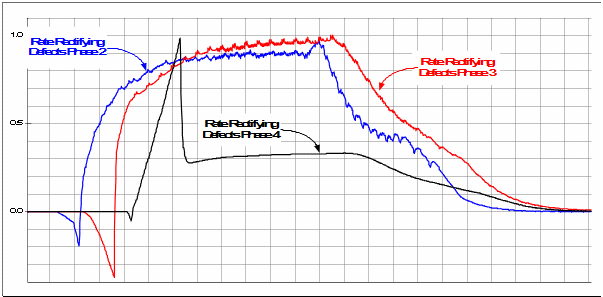
The rates of finding and rectifying defects are non-linear and different across each of the phases. This is depicted in Figure 6, where the later three phases are considered. The negative rates of finding and rectifying defects arise as a consequence of the need for some work to build up before work in the phase can commence. Again, the rates of finding and rectifying defects slow after initial success and become very low as each of the phases, and the projects, near completion. Note that although rates of finding and rectifying defects are shown for these phases as they near completion, concurrent work continues albeit at diminishing rates until the end of the whole project.
Discussion of simulated results
A surprising number of non-linear dynamics in the observed behaviour over time appear as a consequence of:
- the non-linear relationship between intensity of QA effort, and the impact this has on success in finding defects;
- the non-linear feedback dynamics of the rework cycles within the phases; and
- the dynamic sharing of resources both within phases and between phases of the project.
Greatest gains in terms of reducing time to complete accrue from being able to most effectively allocate resources from the very beginning of the project. This requires that those resources be made available when need which, in turn, can only be achieved if project managers know of this need well beforehand because the availability of resources is frequently characterized by long lead times.
There is very little, if anything, to be gained by adding resources later in the project. The effectiveness of various options for allocating resources cannot be determined by use of intuition and judgment: they can only be identified through testing of alternate scenarios in a series of simulation runs.
This simulation modeling approach can be extended to take into account the sensitivity of project delivery cost and time to complete to other factors such as programmer skill levels, time to assimilate new programming techniques, inter-phase rework, alternate inspection strategies, enhancements in project management maturity and use of CASE tools.
Future research
The simple ‘marbles in a bathtub’ metaphor (McLucas, 2008) used to represent the basic rework cycle has been sufficient to demonstrate which alternate candidate resource allocation and quality management strategies are likely return immediate improvements in delivering developmental projects. This metaphor is insufficient to be used as a forensic tool for making detailed comparisons with statistical models of previous software development projects, such as COCOMO. Whilst the metaphor is a sufficient representation over a narrow range of rates of working, it is not robust over a broad range of rates of working.
Further, it does not treat modules (or functional blocks) of code as discrete entities having different sizes and having potentially complex linkages to other modules arising from the ways they are “called” by other modules.
Assigning attributes such as number of lines of code in each module and linkages to other modules will inform the development of alternate strategies for risk and quality management. For example, testing efforts should be applied to the modules most called and those which are inherently complex in terms of their functionality.
Follow-on work has led to the development of a series of linked multi-dimensional array models to represent a given phase such as integration of modules. Here, each row is used to represent a specific module (in the module integration phase, for example) and array elements are indexed one column to the right each simulated time step, with the varying numbers of time steps (ageing) needed being driven by the complexity of the module and the effort required to integrate it with other modules and to conduct testing. Whilst this leads to the possibility of representing specific architectures which define how modules are linked together, the rules themselves become complex and need to be validated against actual specific software development projects. Doing this would offer the opportunity to develop a means of gathering specific insights into projects and comparison with the statistical analyses such as COCOMO.