
Volume 11, Number 1, March 2008
Airborne Infrared Observations Of Research Vessel Quest
- 1 Defence Research & Development Canada—Atlantic, 9 Grove Street, P.O. Box 1012, Dartmouth, Nova Scotia, Canada, B2Y 3Z7.
Abstract
Defence Research and Development Canada—Atlantic conducted co-operative infrared (IR) surveillance of research vessel Quest from the air in October 2006 near Halifax harbour. A Canadian Forces Military Patrol Aircraft imaged the Quest in the mid-wave IR band using the Wescam MX-20 IR camera. The Quest cruised along headings such that the sun’s azimuthal position was directly astern, perpendicular, and at 45 to the ship heading. For each of the ship-sun orientations, the aircraft executed a flight pattern that consisted of starboard and port passes that transected the Quest at nominal altitudes of 30 m and 300 m. An additional pass along the ship heading from stern to bow was made at an altitude of 150 m. Wide field-of-view IR images were collected from ranges typically exceeding 5 km with a 640 512 pixel resolution. From the digital video, we have extracted the background radiance and the total contrast signature of the Quest for the various ship-sun-pass configurations. The background sky-to-sea profiles reveal a strong increase in mid-wave IR sea radiance with steepening viewing angle. The total contrast mid-wave IR signature has an approximate power-law decay with distance for ranges between about 1–10 km. At close ranges, we qualitatively note contributions to the signature by the radiance from the wake and from reflections of the ship in the sea surface.
Introduction
Commercial off-the-shelf electro-optical (EO) systems are regularly employed on military patrol and search-and-rescue aircraft. Their primary purpose is to aid the operator to detect and identify objects rapidly, especially, in conditions that are challenging for visual observation, such as at night or through fog. For this reason, the commercial systems have several cameras and filters that render multiple pictures of the scene in several visible and infrared (IR) bands. When used on airborne platforms, the operator can use the camera system to scan efficiently large swaths of area and, with optical zoom, the operator can readily isolate targets for identification and tracking. In this paper, we discuss IR imagery of a ship taken by an operational EO surveillance system from an aircraft.
Defence Research and Development Canada—Atlantic (DRDC-A) conducted co-operative IR surveillance of Canadian Forces Auxiliary Vessel (CFAV) Quest (Figure 1) from the air by a Canadian Forces Military Patrol Aircraft (MPA CP-140) Aurora (Figure 2). The Aurora, which is equipped with a Wescam MX-20 Electro-Optics/Infrared system [1], was used to image Quest in three solar loading configurations. Extensive sets of images were collected from three altitudes for each of the configurations. For each configuration and altitude, the image data covers a broad range of viewing angles and ship-aircraft separations. As a result, a significant bank of images was quickly collected that encompass several ship-sun configurations, altitudes and a systematic variation in range and viewing angle. These image data add substantially to the primarily shore-based IR measurements of Quest obtained during previous trials [2,3].
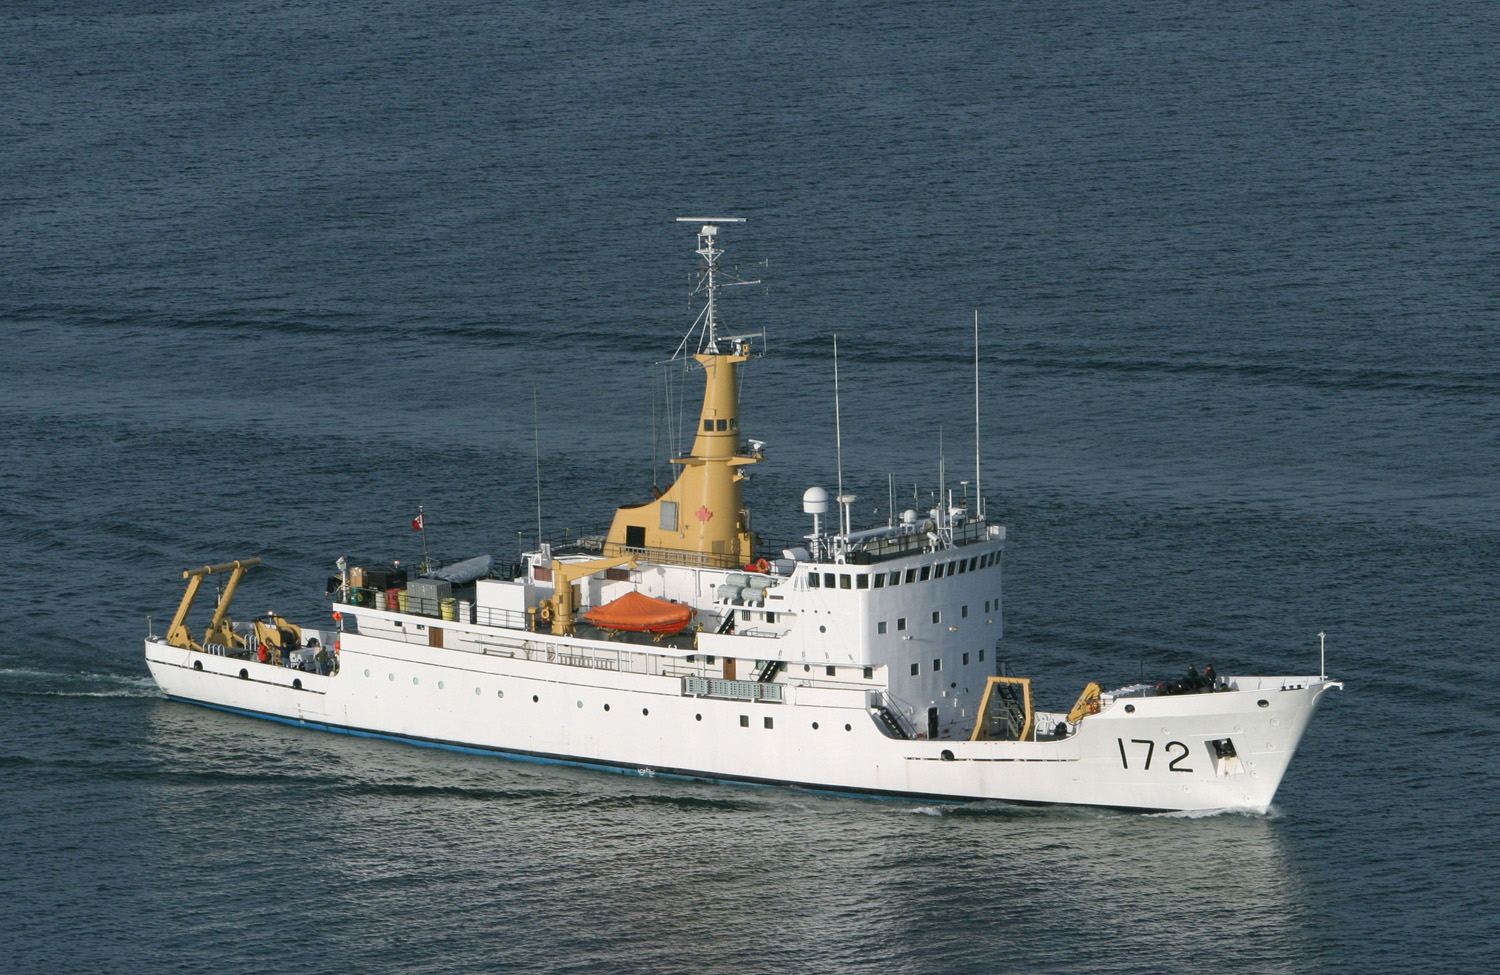
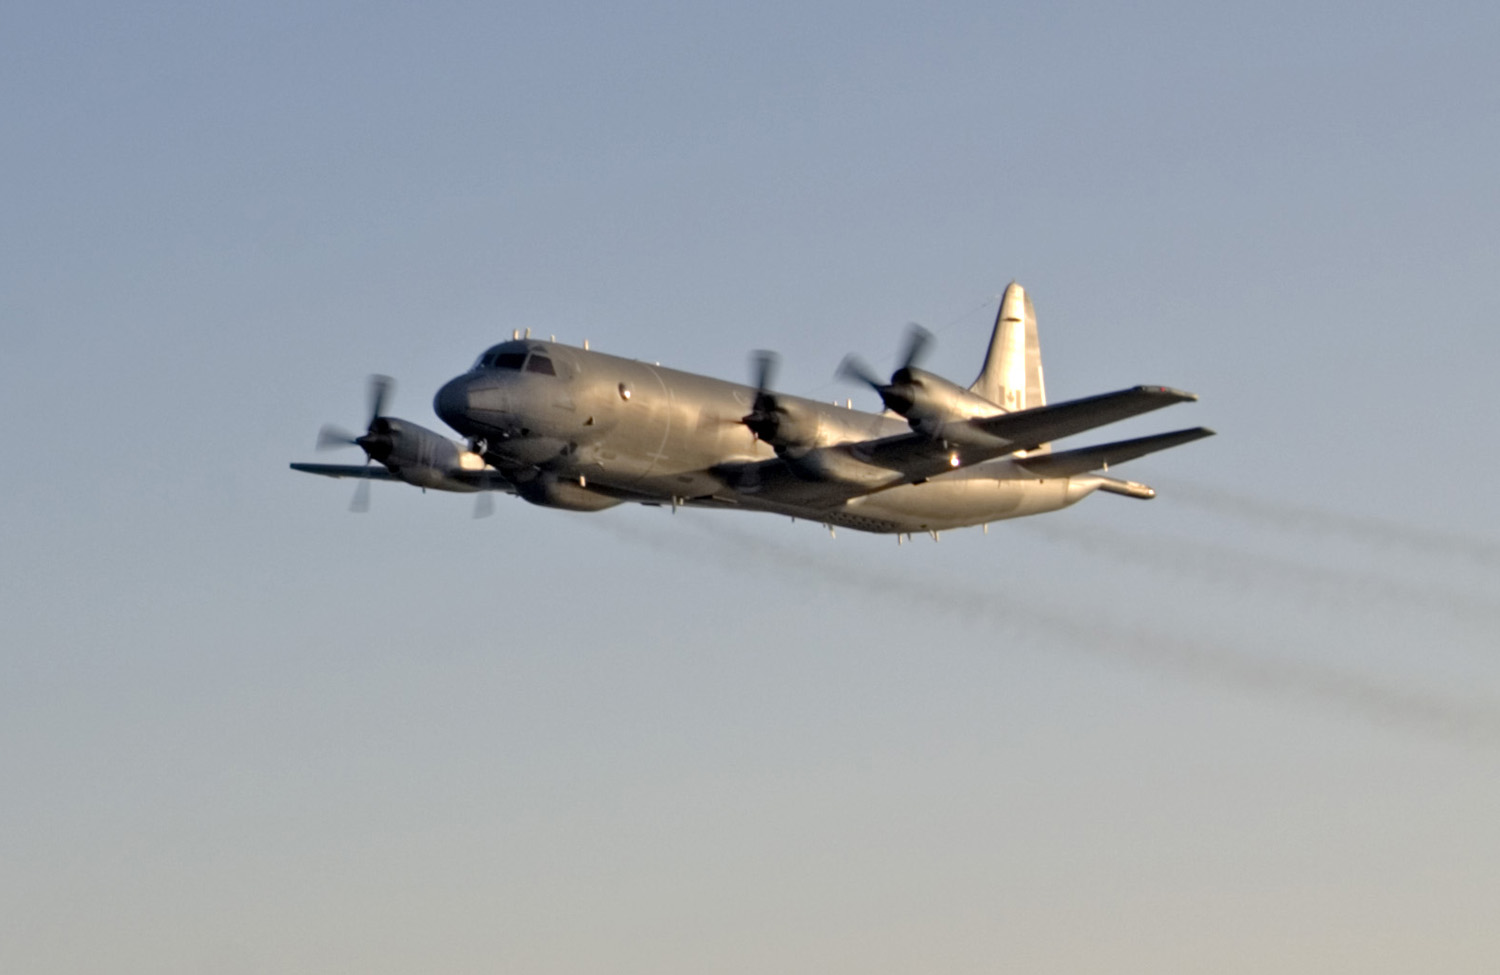
IR images from the MX-20 system acquired during this trial were processed to extract background radiances and ship total contrast signatures. Our results show that the background sky to sea profiles reveal a strong increase in mid-wave IR sea radiance with steepening viewing angle for angles steeper than about –8°. For the ship, we find that the total contrast mid-wave IR signature has an approximate power-law decay with distance for ranges between about 1–10 km. At shorter ranges and steeper viewing angles, the increase in the sea radiance results in a slower increase in the ship contrast. In our analysis, we have qualitatively observed significant contributions to the signature by the radiance from the wake and from reflections of the ship from the sea surface at steep viewing angles and near ranges.
Description of the trial
On 10th October 2006, the Aurora made a total of 15 passes over the Quest in a trial to collect mid-wave IR imagery from a set of observation directions. The trial took place in an area of about 20 × 20 nautical miles of open ocean, approximately 25 nautical miles southwest of Halifax harbour in the North Atlantic. The approximate geographical location is 44.2°N and 63.1°W. The prevailing conditions during the trial were a clear sky, a calm ocean, excellent visibility, air temperature of 15.3°C, and sea surface temperature of 14.7°C.
CFAV Quest, at 76 m in length and 2200 tonnes displacement, is about the size of a small frigate. Under diesel propulsion, Quest cruised at 10 knots along three well defined trajectories denoted as Legs A, B and C. A sketch of the Quest cruise routes is shown in Figure 3. During each leg, Quest cruised at constant speed for about 20 minutes before being approached by the Aurora. This period allowed the ship to attain a constant temperature. After a sequence of five passes by the Aurora, Quest was released to embark on the next leg.
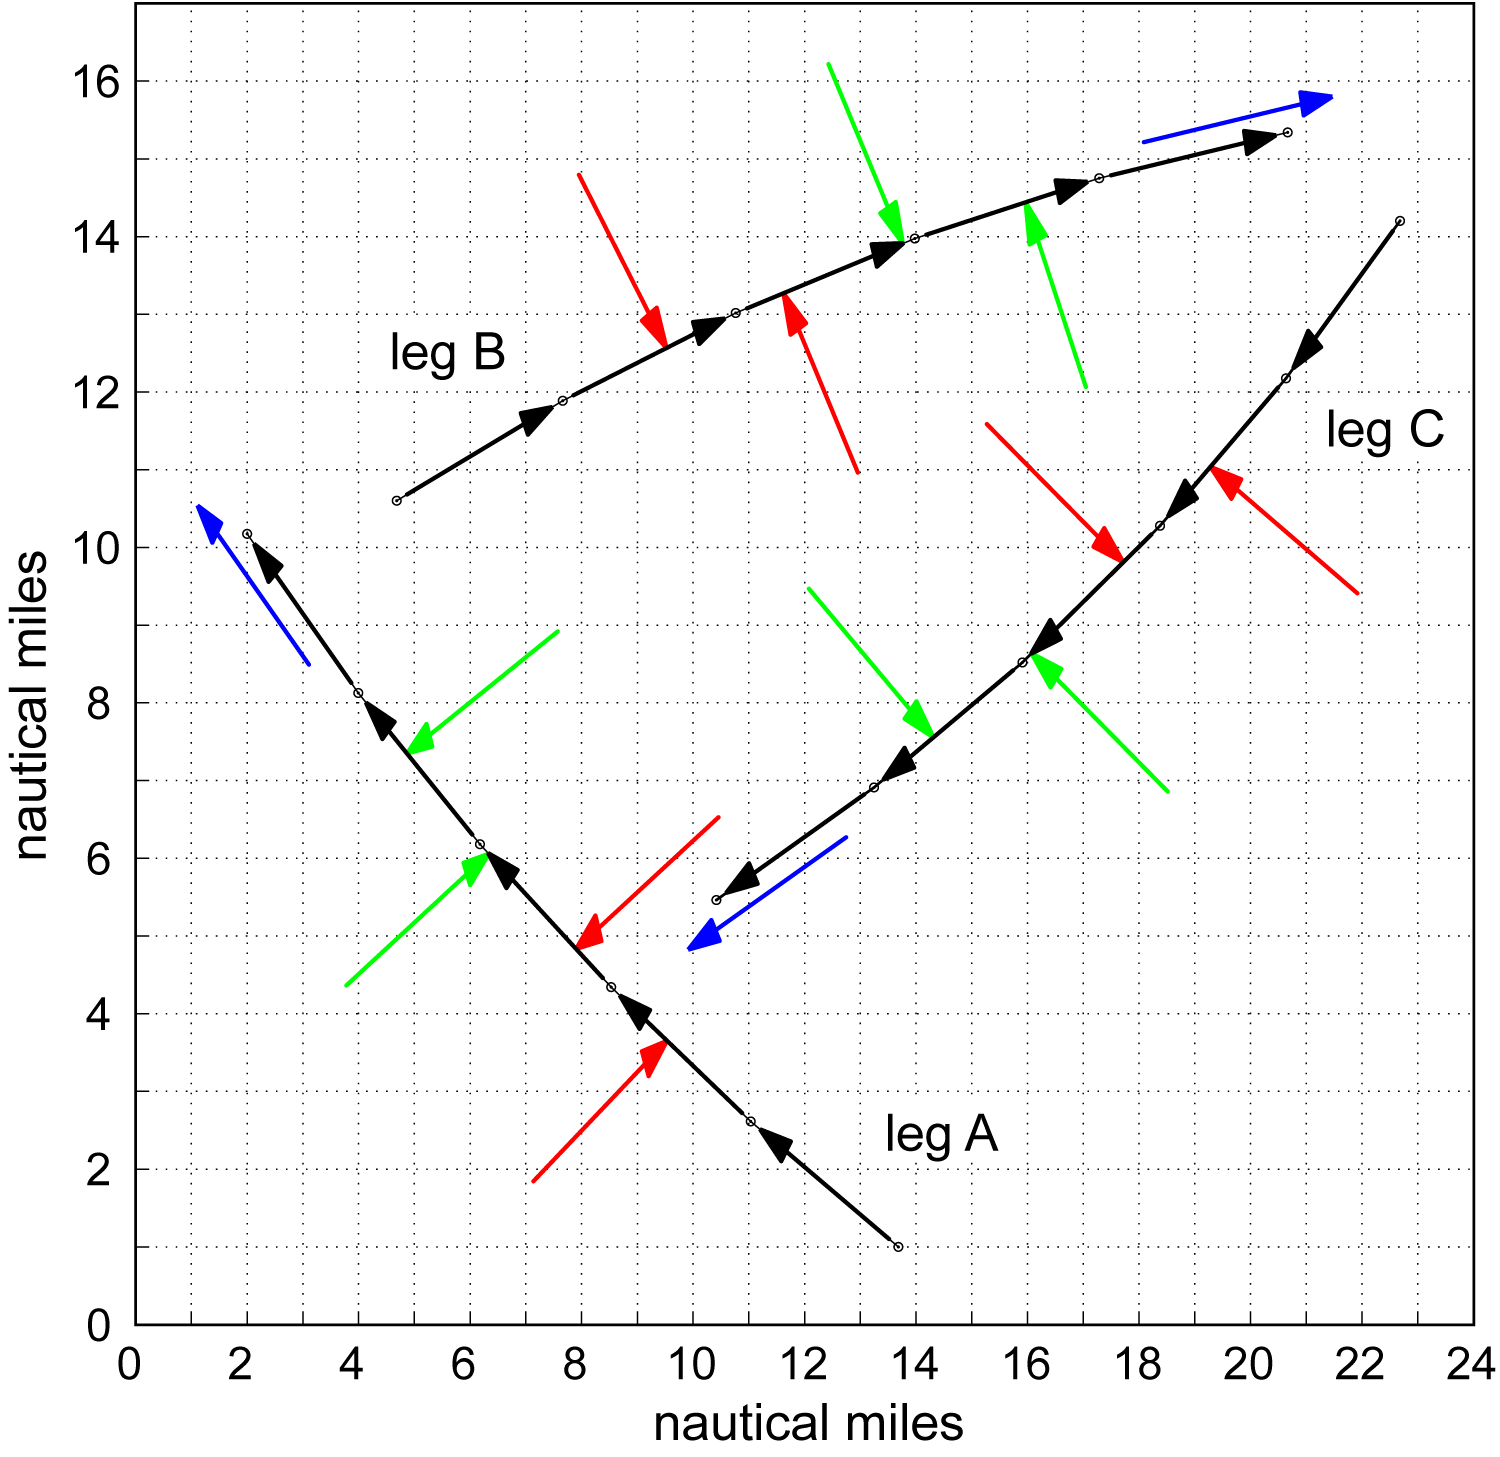
The cruise trajectories for Legs A, B and C were chosen so that the sun was located directly astern, perpendicular to and at 45° to Quest’s heading, respectively. In order to keep the same ship-sun configuration, Quest’s heading was corrected every 15 minutes. The typical correction over a leg was about 3°. The sequence of five passes on each leg executed by the Aurora started with a port pass at an altitude of approximately 30 m. The pass consisted of an approach perpendicular to Quest from a range in excess of 4 km. The approach was made at a constant speed and altitude. For the pass at 30 m altitude, the Aurora did not go directly over Quest but safely astern. An approach and pass from the starboard side followed the port pass. A similar pair of passes, transecting the Quest trajectory, at an altitude of 300 m was executed. At 300 m, the Aurora passed directly over Quest at midship. The fifth and final pass on each leg approached Quest from the stern, aligned with the wake and passed directly over the centerline of the ship. The stern-bow pass was at an altitude of 150 m. The trial plan showing the Quest trajectories and the Aurora approaches are summarized in Figure 3. Each black arrow shows the heading for CFAV Quest over a 15-minute duration within each of the three legs. The red (green) arrows indicate the Aurora port and starboard flight passes at an altitude of 30 (300) m. The blue arrows show the Aurora stern-bow flight pass at an altitude of 150 m.
In Table 1, we have summarized the ship and solar configurations during the Aurora passes. The solar azimuth (and thereby the required ship heading) and elevation were calculated using the Solar Position Algorithm calculator which is accessible at the National Renewable Energy Laboratory website [4].
During each approach and until past Quest, the Airborne Electronic Sensor Operator (AESOp) recorded mid-wave IR images of the ship with the Wescam MX-20 IR camera system [1]. The MX-20 is a stabilized turret with a cryogenic, high resolution, focal plane array, mid-wave IR sensor. The AESOp manually set the gain and level of the sensor at the start of each approach. The AESOp then manually tracked and kept in focus Quest with constant field of view. The widest field of view of 21.7° × 16.4° was used for all the passes. The images, several thousand per pass, were recorded and stored as 8 bit digital video at a standard framing rate of 30 Hz. Note that while the passes have different gain and level settings, within each pass these parameters were kept constant. Relevant parameter settings of the MX-20 system are summarized in Table 2.
| Leg | Local time | Ship heading | Sun position | Solar elevation |
|---|---|---|---|---|
| A | 1610–1630 | 063–066 | Astern | 14.1°–10.8° |
| B | 1650–1715 | 161–165 | Starboard | 7.5°–3.3° |
| C | 1735–1800 | 305–308 | Port at 45° | 0.1°– –4.8° |
| Spectral band | 3.4–5.2 µm |
|---|---|
| Calibration | Internal, 1 point |
| Resolution | 640 × 512 pixels |
| Field of view | 21.7° × 16.4° |
| Tracking | Manual |
| Focus | Manual |
| Gain | Manual |
| Frame rate | 30 Hz |
| Data | 8-bit digital video |
Over the 15 passes, the speed of the Aurora varied between 57–139 m/s and the maximum range spanned 4.4–18.2 km. In this paper, we assume that the speed is constant within each pass. The six passes at a nominal altitude of 30 m varied between 27–39 m with an average of 33 m. For the passes at a nominal altitude of 150 m the spread was 146–154 with an average of 150 m. The passes at a nominal altitude of 300 m varied between 288 m and 304 m with an average of 301 m. During each pass the aircraft altitude is assumed to be constant. Given the altitude and speed, a trivial geometric relation connects the horizontal range with the camera viewing angle. In Figure 4, we have plotted the viewing angle versus horizontal range for the 15 passes. An angle of 0° corresponds to the camera oriented horizontally and an angle of –90° corresponds to the camera pointing vertically downwards. The minimum horizontal range is chosen when the ship occupies about half the image. The maximum range typically exceeded 5 km. The variation in the data stems from the differences in the altitude from pass to pass. Errors, though small, would arise from variability in the Aurora’s speed within each pass.
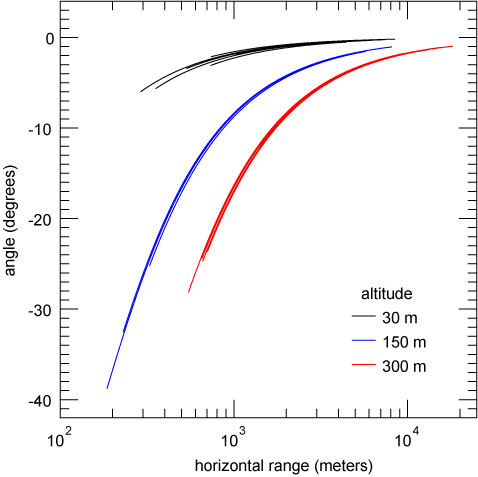
Figure 5 shows mid-wave IR images of Quest from altitudes of 30 m and 300 m. At these very near ranges, typically a few hundred meters, there is abundant detail in the spatial variation in IR radiance over the ship. In the upper panel of Figure 5, the sun, on the starboard side, is almost perpendicular to the ship heading and has a low elevation of about 5°. This results in strong reflections from several of Quest's surfaces and subsequent reflection off the sea surface. In the lower panel of Figure 5, the sun has just set and is at an elevation of about –4° on the port side. Yet we see reflection from the bow wake on the port side and not on the starboard side. This suggests that solar scattering at the horizon where the sun has just set is a significant source of mid-wave radiance that can be reflected by the port side bow wake while the starboard side bow wake is shadowed by the ship. At this near overhead view, we can see the detailed structure of Quest’s decks.
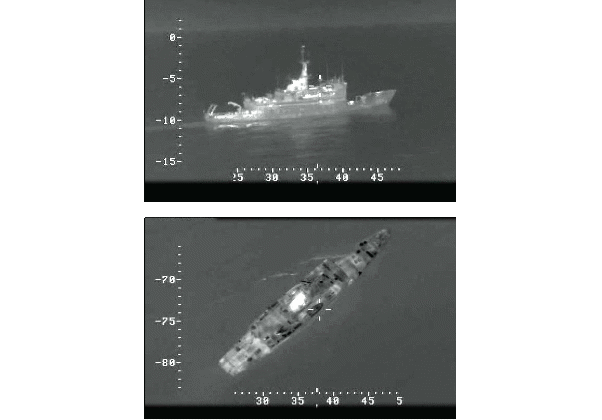
Images, such as those shown in Figure 5, where Quest occupies most of the field of view are not analysed quantitatively for contrasts since they preclude a statistically meaningful background. Only images in which the ship spans less than half the field of view are processed by the image analysis algorithm described in the next Section.
Image analysis
The objective of the image analysis was to extract a contrast signature representative of Quest as a function of range, viewing angle and ship-sun-pass configuration. Therefore, the image analysis algorithm must demarcate ship and background regions so as to determine a contrast. There are several methods to extract a target from its background, see for example [5]. The method we describe below is not intended for general use but only as a means for us to obtain approximately the ship contrast.
The first step in analysing the digital video data from the MX-20 was to decompose it into its constituent image frames. Image data from the passes resulted in 1,500 to 5,500 frames depending on the length of the pass. Representative images are shown in the upper panels of Figures 6 and 7. These images contain parts of a data overlay and cross-hairs which are at a fixed position on the image. The cross-hairs were replaced with mean pixel values from either side leaving behind only a small residual imprint of the cross-hair.
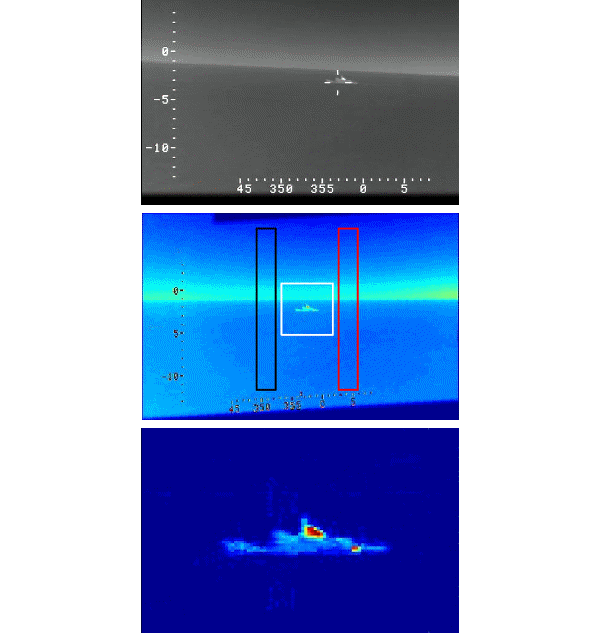
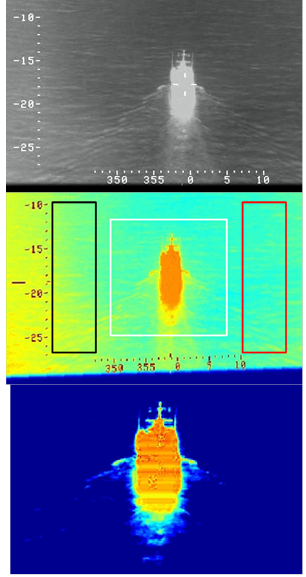
At long ranges and especially at the lowest altitude, the camera’s large field of view captures a significant portion of the sky. At times, particularly early in an approach, the horizon appears tilted as the aircraft manoeuvres into level flight. When the horizon is present, the image is corrected for tilt. Typical tilts were on the order of a few pixels across the field of view but could be as large as a grade of 10%.
In each image three regions were selected: a square region fully encompassing the ship and two rectangular regions on either side of the ship to sample the background. The ship region was centred with respect to the cross-hairs and was hence almost always centred relative to the ship. The dimensions of the regions (width × height) are:
The background regions are separated from the ship region by x pixels. The integer variable x parameterizes the ship-aircraft range through the approach; it increases with decreasing range. As expected, the dimensions of the ship and background regions also increase with decreasing range. With these regions, the sampled background is, in each image, comparable to the ship dimensions and in close proximity to the ship. Therefore, we are able to obtain a meaningful sampling of the background variation near the ship. In the middle panels of Figures 6 and 7 are examples of the image processing after horizon-tilt correction, removal of cross-hairs, and identification of ship and background regions. Note the relative size and positioning of the ship and background regions at long (Figure 6) and near (Figure 7) ranges.
The image analysis algorithm, for all flight passes, starts with x = 3 where the ship occupies on order of 10 pixels. The last image used is when Quest spans approximately 200 pixels. Images at closer range at the tail end of the approaches are neglected since the ship would occupy a disproportionately large part of the total field of view. In this way the inequality of total pixel allocation between ship and background was avoided. Limiting x ≤ 32 resulted in a total of between 1375 and 4485 image frames for the passes.
The background regions are used to extract the radiance profile of the scene as a function of viewing angle. At long ranges, the 300 pixels in the vertical direction span a significant portion of the sky and sea. With decreasing range, the camera viewing angle becomes steeper, and the background region has an increasing proportion of sea. In this way, the background radiance at fixed altitude as a function of viewing angle can be extracted. Averaging across the 3x pixels for each of the background regions results in a statistical average of the background profile near the ship:
In addition to encompassing Quest, the square ship region contains the immediate background: sky, horizon, sea and wake. We contrasted this region with the background by subtracting the line-by-line average of the appropriate 3x × 8x segment from the 3x × 300 background region:
Noise in the contrasted region due to the inherent background fluctuations were suppressed by thresholding. The threshold value was taken as the mean of the line-by-line standard deviations of the 3x × 8x background region:
The threshold value is typically 1–3% of the mean background radiance. Pixels for which the absolute value of the ship contrast radiance are less than the threshold are set to zero. This thresholding results in mainly non-zero pixels values on the ship and zero pixel values outside the ship. The lower panels of Figures 6 and 7 show the resultant ship contrast images. At near ranges, the wake around the ship is a significant contributor to the contrast as is the ship reflection from the sea surface at steep viewing angles. These are ship effects and so arguably are part of the ship signature.
Summing up the values of all the pixels in the contrasted, thresholded ship region, we obtain the total contrast signature Ic(R) of the ship at range R:
Note that the total contrast signature, which is not corrected for atmospheric attenuation or range dependence, is related to the conventional total radiant intensity contrast Jc ∝ IcR2. In the next section, we discuss our results for the background radiance and total contrast signature of the ship.
Results and discussion
Our window of opportunity for this trial coincided with a setting sun. Whereas, this presents an interesting scenario, it also puts forth a rather challenging image acquisition and analysis situation. During Leg B the two passes that were directly into the sun were dominated by strong sea surface glints and the two passes that were directly away from the sun had insufficient signal levels. Furthermore the image data for the second and fourth pass in Leg C, which were obliquely into a setting sun, were contaminated by spurious optical effects that prevented us from a proper analysis of these flight approaches. Consequently, the foregoing six passes are omitted from further analysis. The remaining nine passes, three at each altitude, are discussed below. We begin with the background radiance profiles and then proceed to ship contrasts. All the radiance values for the backgrounds and the ship contrast are presented in arbitrary units.
Data from the two 3x × 300 pixel background regions on either side of the ship were processed to extract the mean radiance of the sea, sky, and horizon. Each image in a given pass furnishes data at a specific range and viewing angle (see Figure 4). Assuming that the centre pixel of the cross hair corresponds to the viewing angle of the MX-20 camera system, and using the vertical field of view given in Table 2, we assign a continuous angle parameter to the 300 vertical pixels of the background region per image. Averaging over the 3x horizontal pixels, we get the mean radiance as a function of angle for each image. Lining up these averages for the image sequence in a pass, we create a composite of the mean background radiance measured through an approach. Composites for the backgrounds on either side of the ship and from representative runs at the three flight altitudes are shown in Figure 8. The white (zero pixel value) bands at the top and bottom of each figure are outside the span of the 300 pixels in the background regions. In each figure, the viewing angle increases (becomes steeper) from left to right. Horizontal range decreases from left to right.
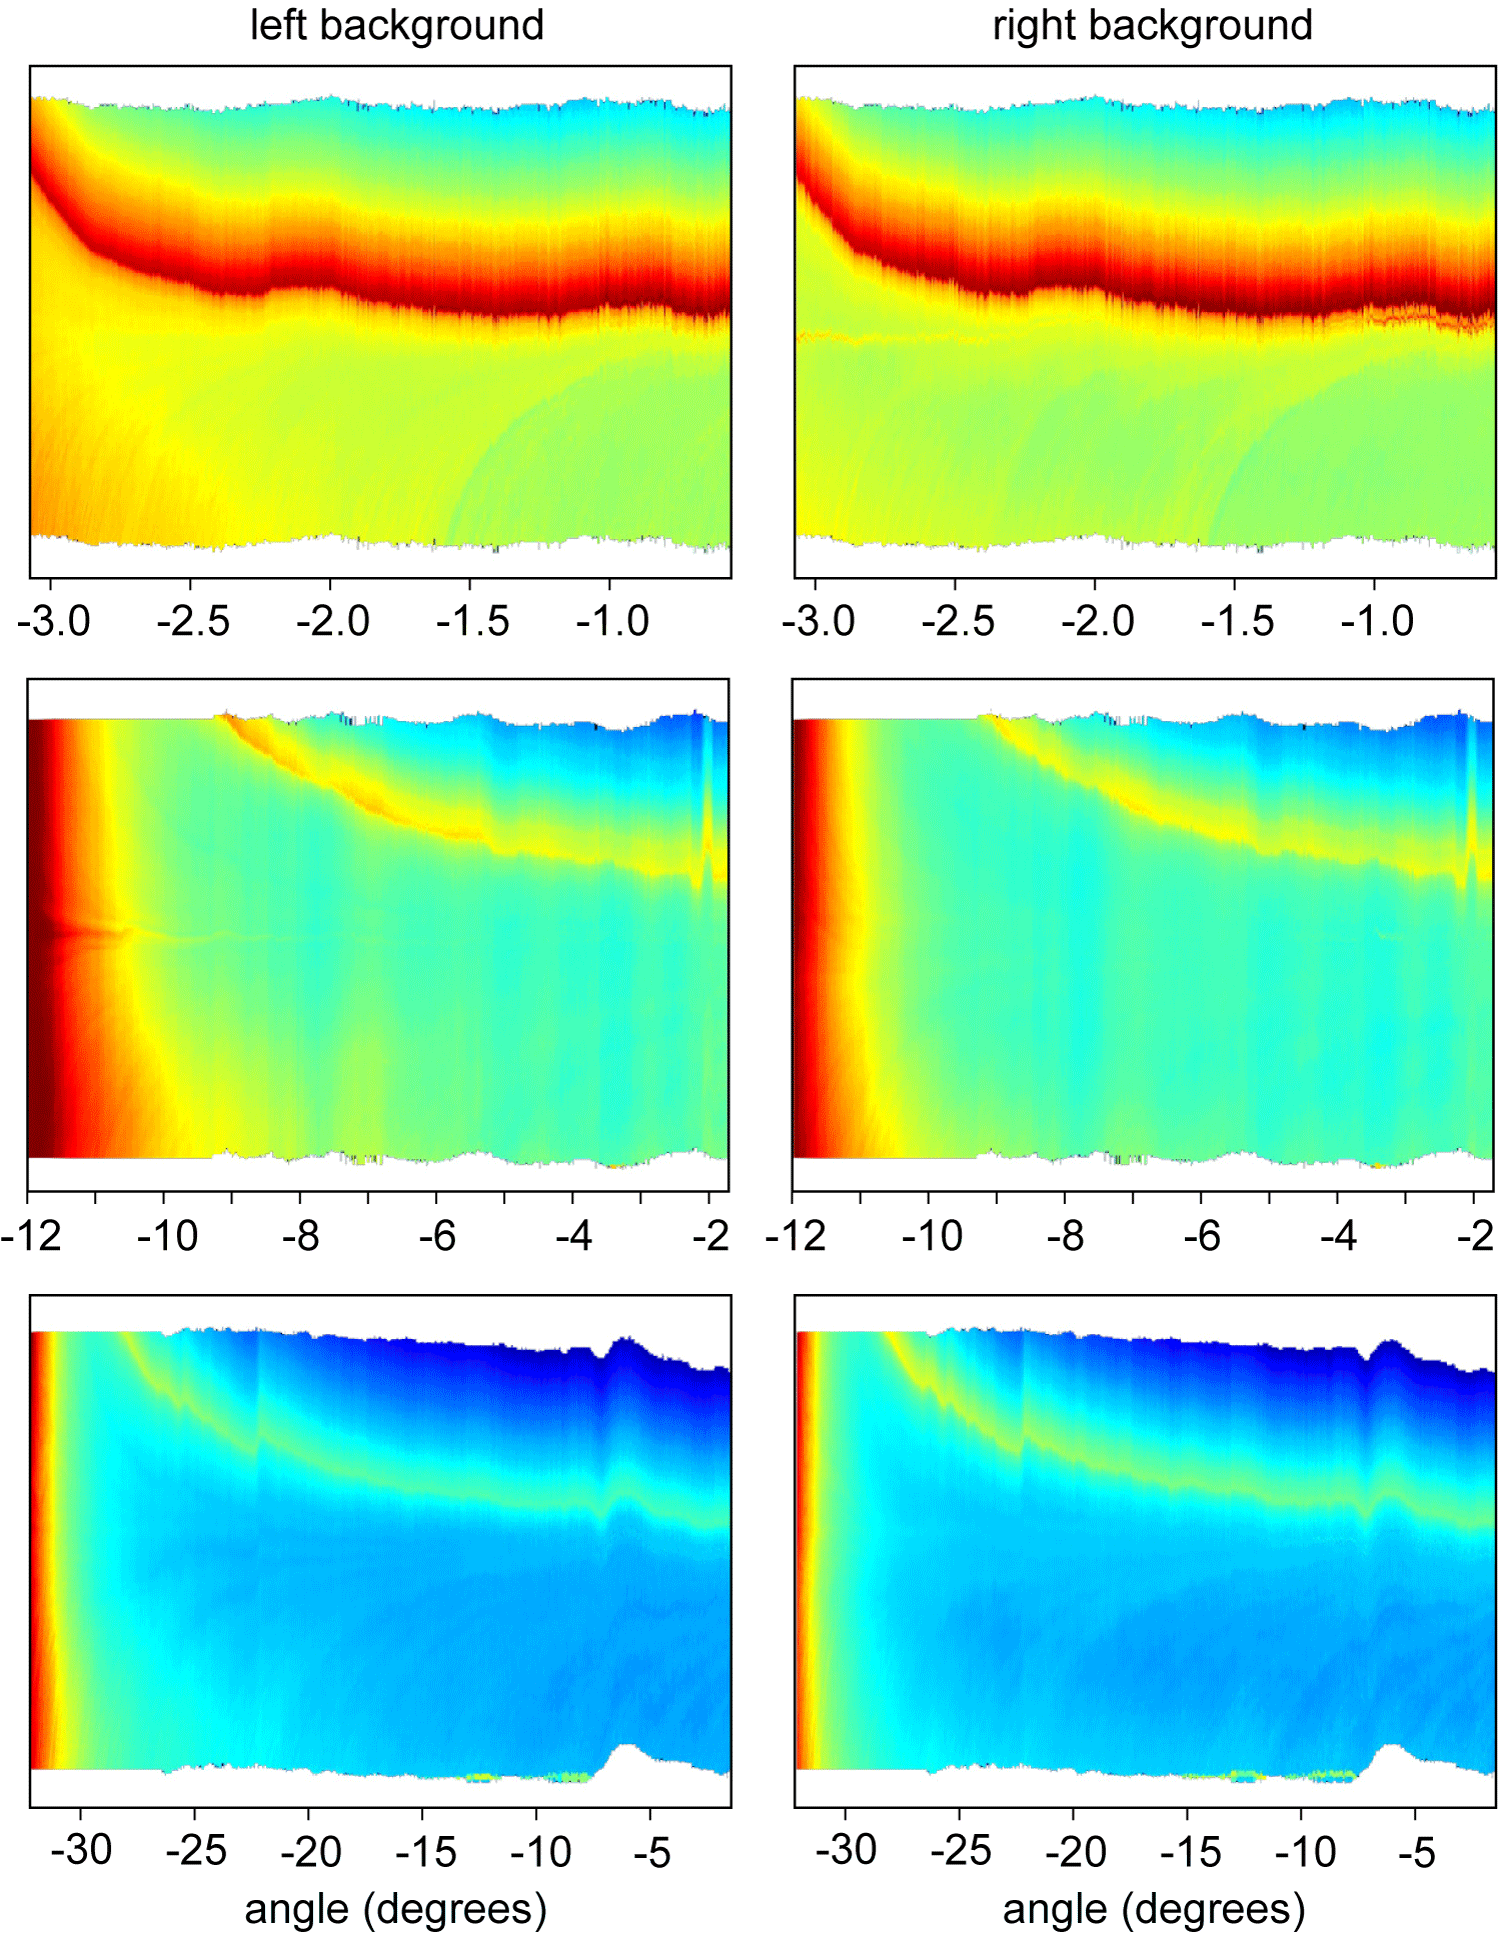
As expected the backgrounds on either side of the ship are closely similar. Some differences, especially the asymmetry due to the wake are easily observable. Optical effects of wakes in the visible and IR bands are primarily due to modulation of reflected sky radiance, changes in the reflectivity from the bubble distribution that make up foams and the surfactants that modify the local sea surface roughness [6].
The data from the composites such as in Figure 8, from a total of nine passes, are accumulated in a radiance versus angle plot shown in Figure 9. There are three background profiles for each of the three altitudes. The background radiance in all the profiles has been normalized to be unity at an angle of –2.5°. Here positive angles span the sky and negative angles correspond to the sea regions. All the radiance profiles of the background have consistent features: a strong local maximum at the horizon, a rapid decay with increasing angle in the sky, a roughly constant sea radiance between viewing angles of about –1° to –6°, and a steadily increasing sea radiance with steeper viewing angles. The general shape of the profile is qualitatively consistent with the dependence of the sea surface emittance and reflectance on the viewing angle [7].
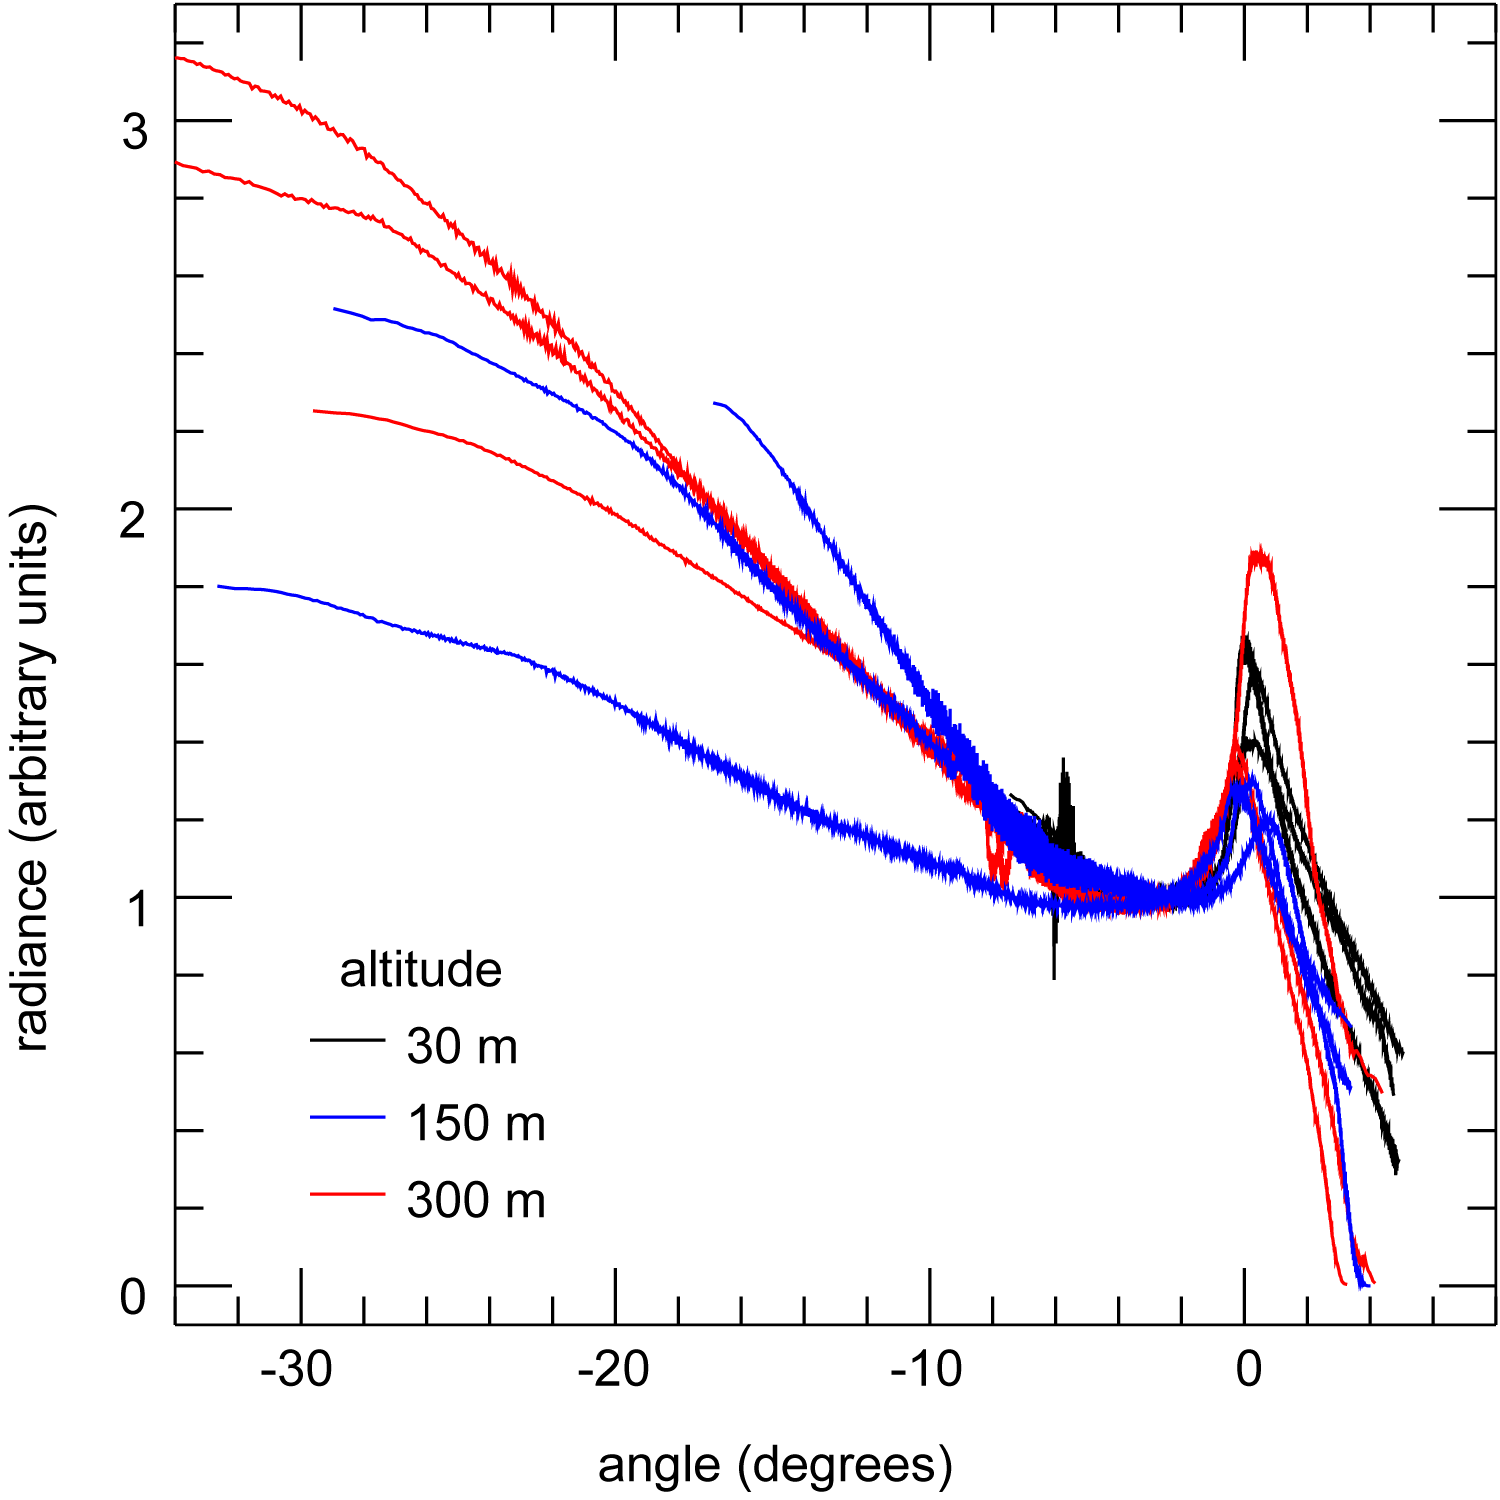
The variation amongst the profiles stems from several sources: systematic azimuthal dependence, measurement error in the viewing angle, sea surface variability and thermal and optical stability of the camera system. We believe that the dependence on altitude has been normalized out with our scaling of the data. The Aurora observation paths make various angles with the solar azimuth: five of the nine passes are perpendicular to the sun, one has the sun directly behind it, two have the sun at 45° behind, and one has the sun at 45° ahead. The different solar illumination of the backgrounds causes, through atmospheric scattering and sea surface reflection, most of the variation in the data in Figure 8. The measurement error in the viewing angle comes from fluctuations that are due to altitude and speed variability of the aircraft during the approach. These are likely to be small and would result in minor rescalings of the horizontal axis in Figure 9. Variability of the sea surface roughness results in systematic variation in the sea surface emissivity and thus in the observed radiance [8]. Our observations of the wind speed show a variation between 2.2–4.0 m/s which suggests a few percent change in the emissivity. Finally, drifts in the absolute signal from the camera system as well as non-linearities and spatial variation across the focal plane array will lead to some systematic variability in the background profiles.
At long ranges, typically in excess of about 1 km, there appears to be an approximate power-law decay in the total contrast signature with range, for all the passes. This decay is consistent with the inverse square law augmented by atmospheric attenuation. At shorter ranges the total ship contrast is dependent upon whether the background is sea or sky and thus on the altitude of the pass. For the passes at an altitude of 30 m the background that is contrasted against the ship consists of the horizon with a few degrees of sea and sky. At the smallest of ranges, the sea region is yet within about –8° in viewing angle where the sea background radiance is rather constant (see Figure 9). Thus the total ship contrast continues to increase with decreasing range as shown in Figure 10. On the other hand, for the 150 m and 300 m passes, the viewing angle is rather steep at near ranges and the background is exclusively composed of the sea surface. As the viewing angle becomes steeper, the sea radiance increases (see Figure 9) and thus the ship contrast grows more slowly, reaches a local maximum and eventually begins to decrease. The precise viewing angles are functions of the altitude of the pass, but the trend in the total ship contrast is the same as shown in Figures 11 and 12.
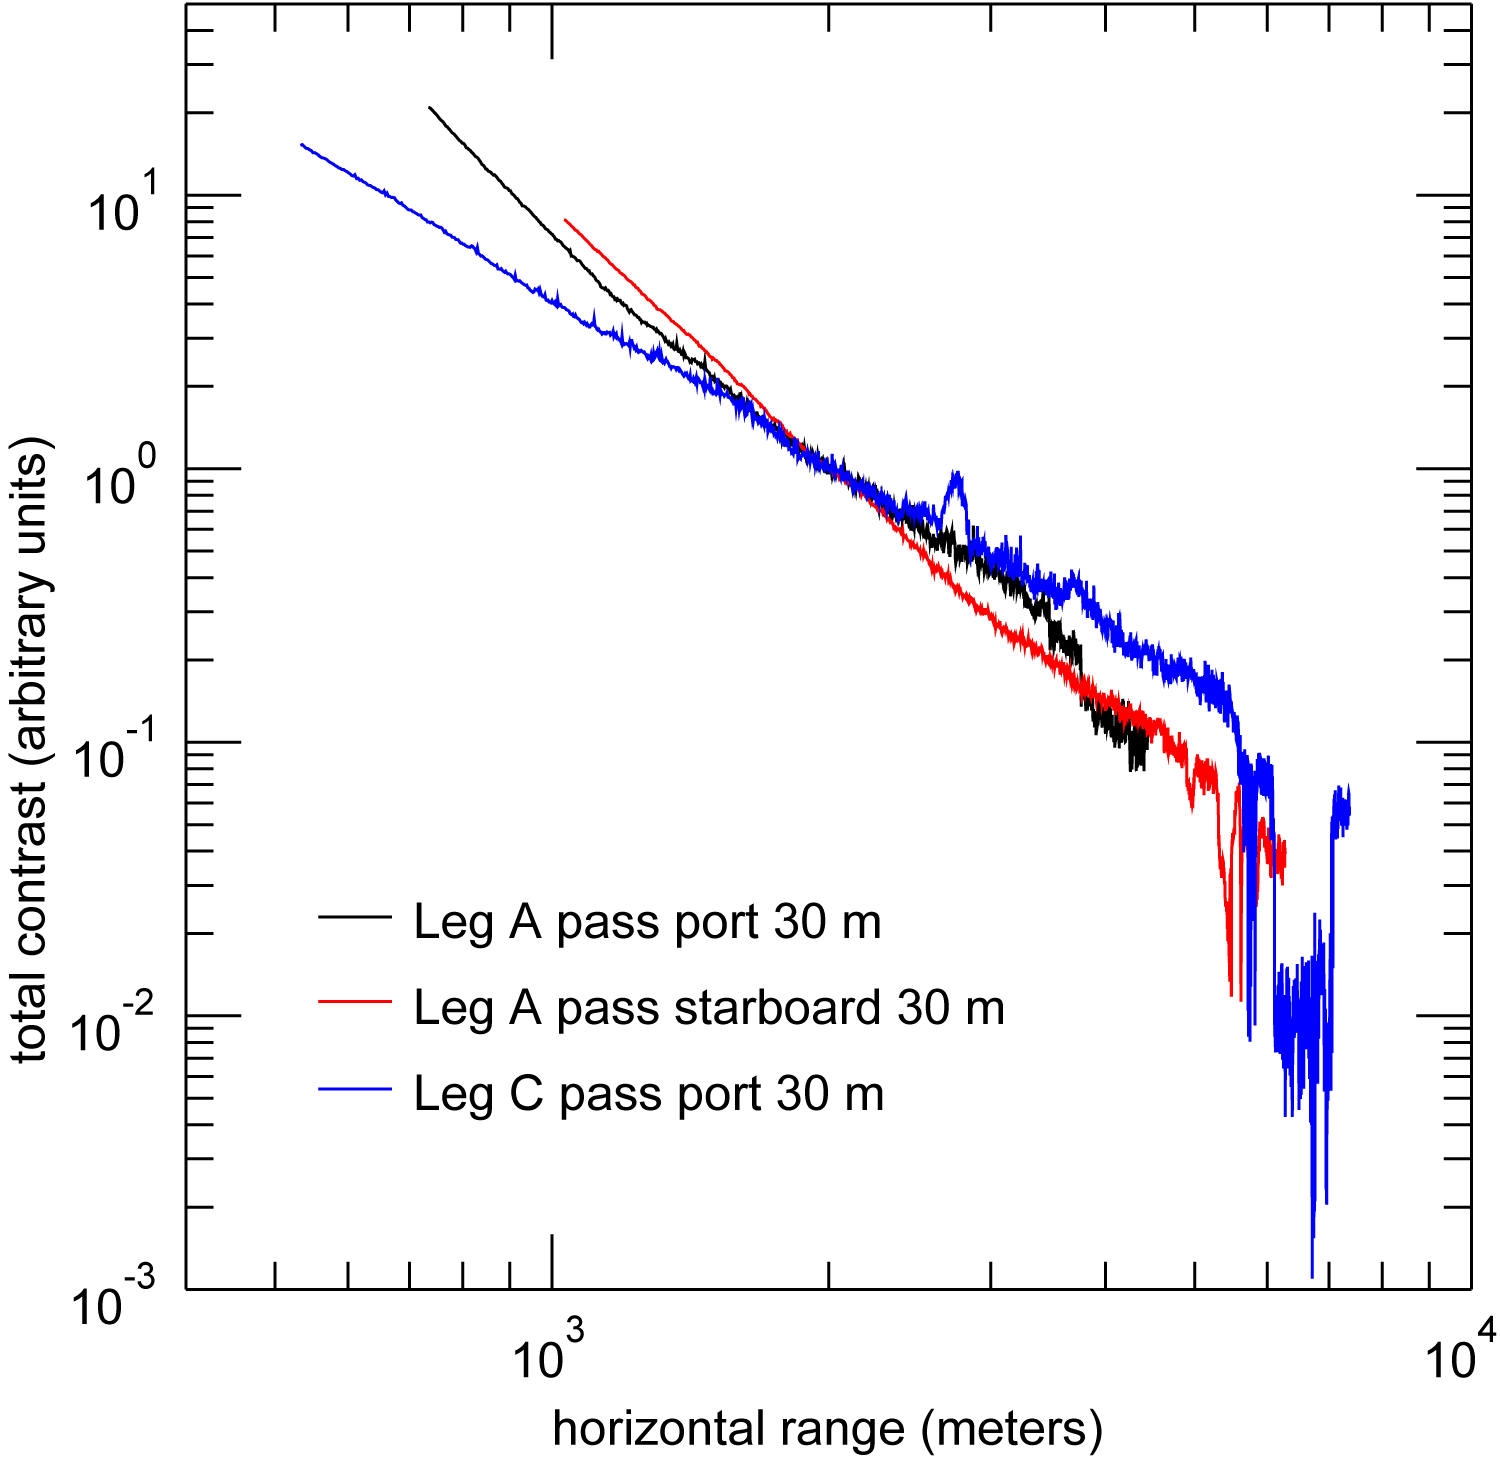
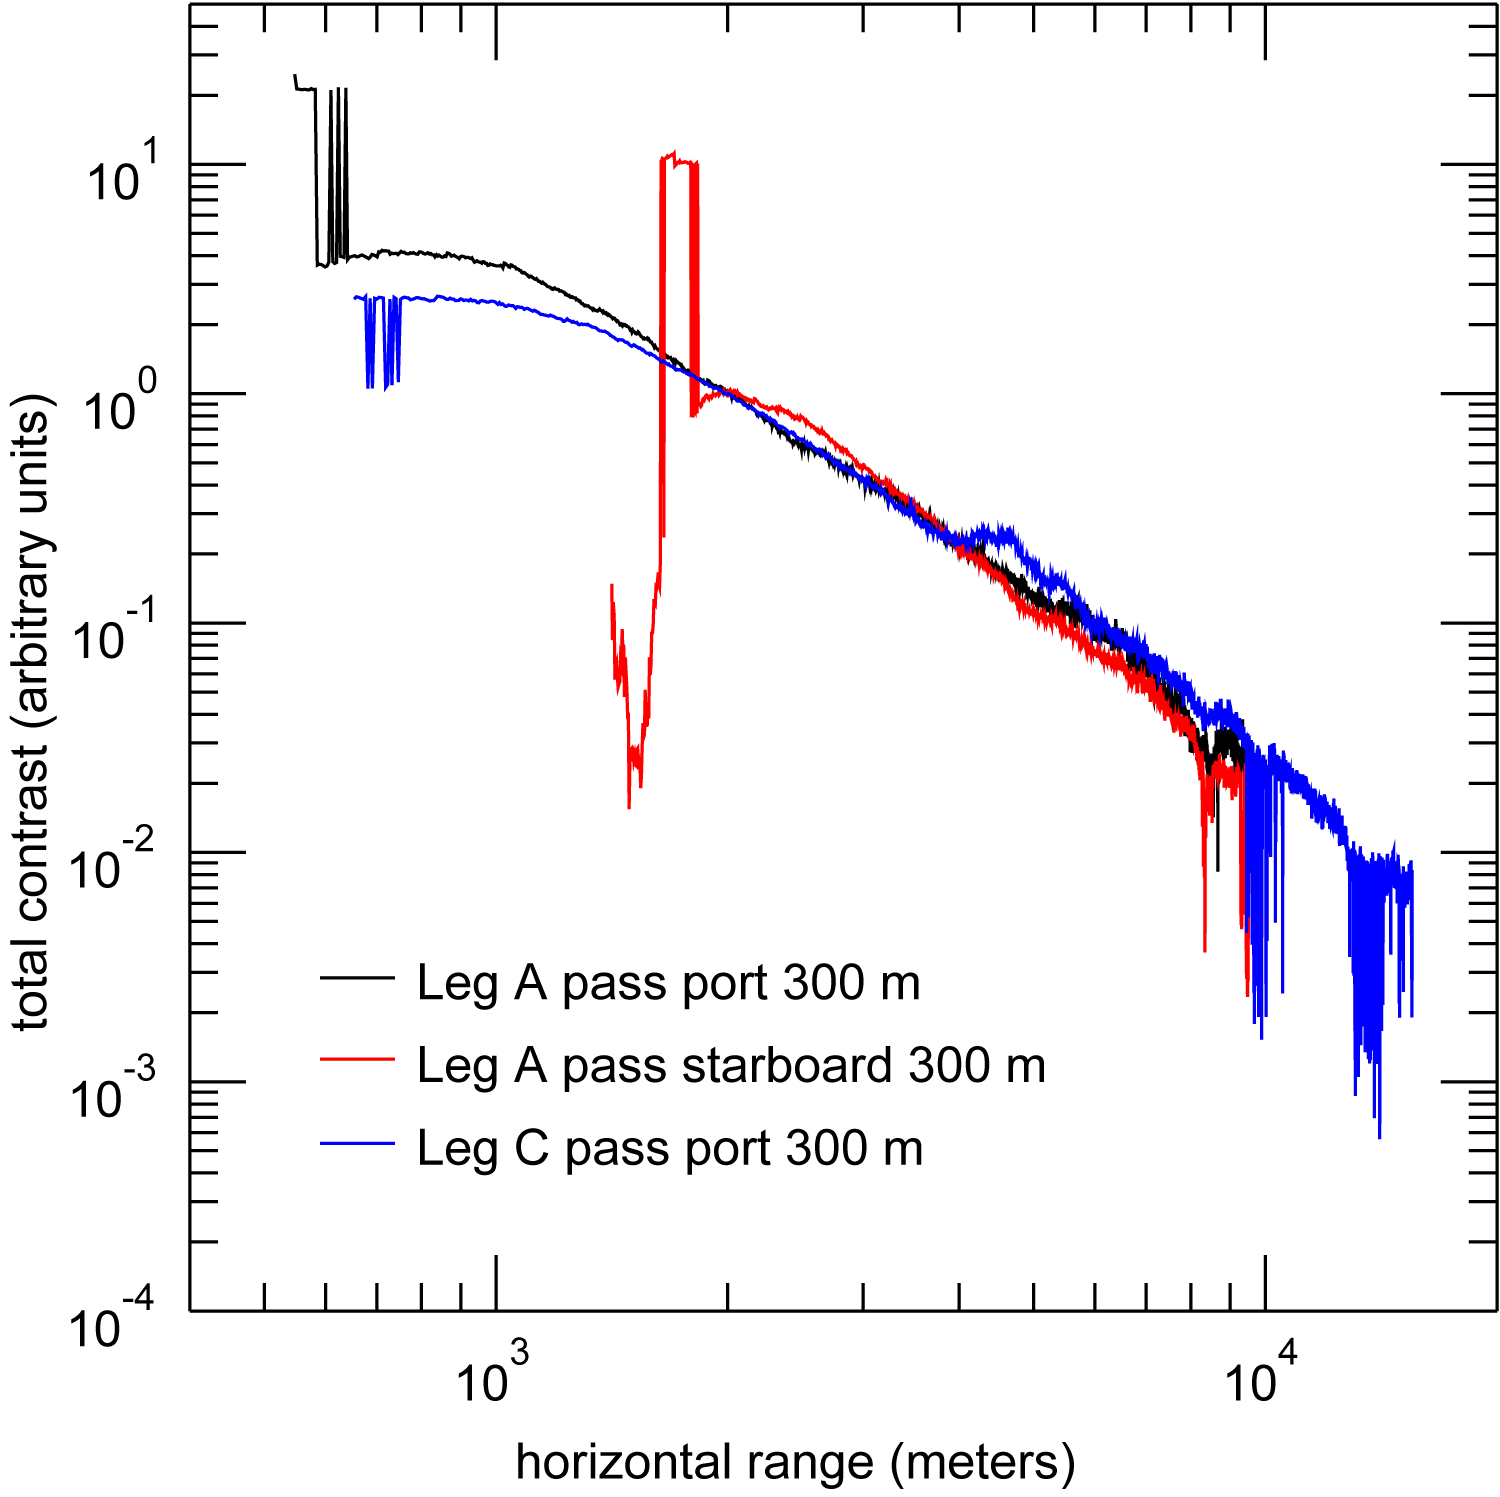
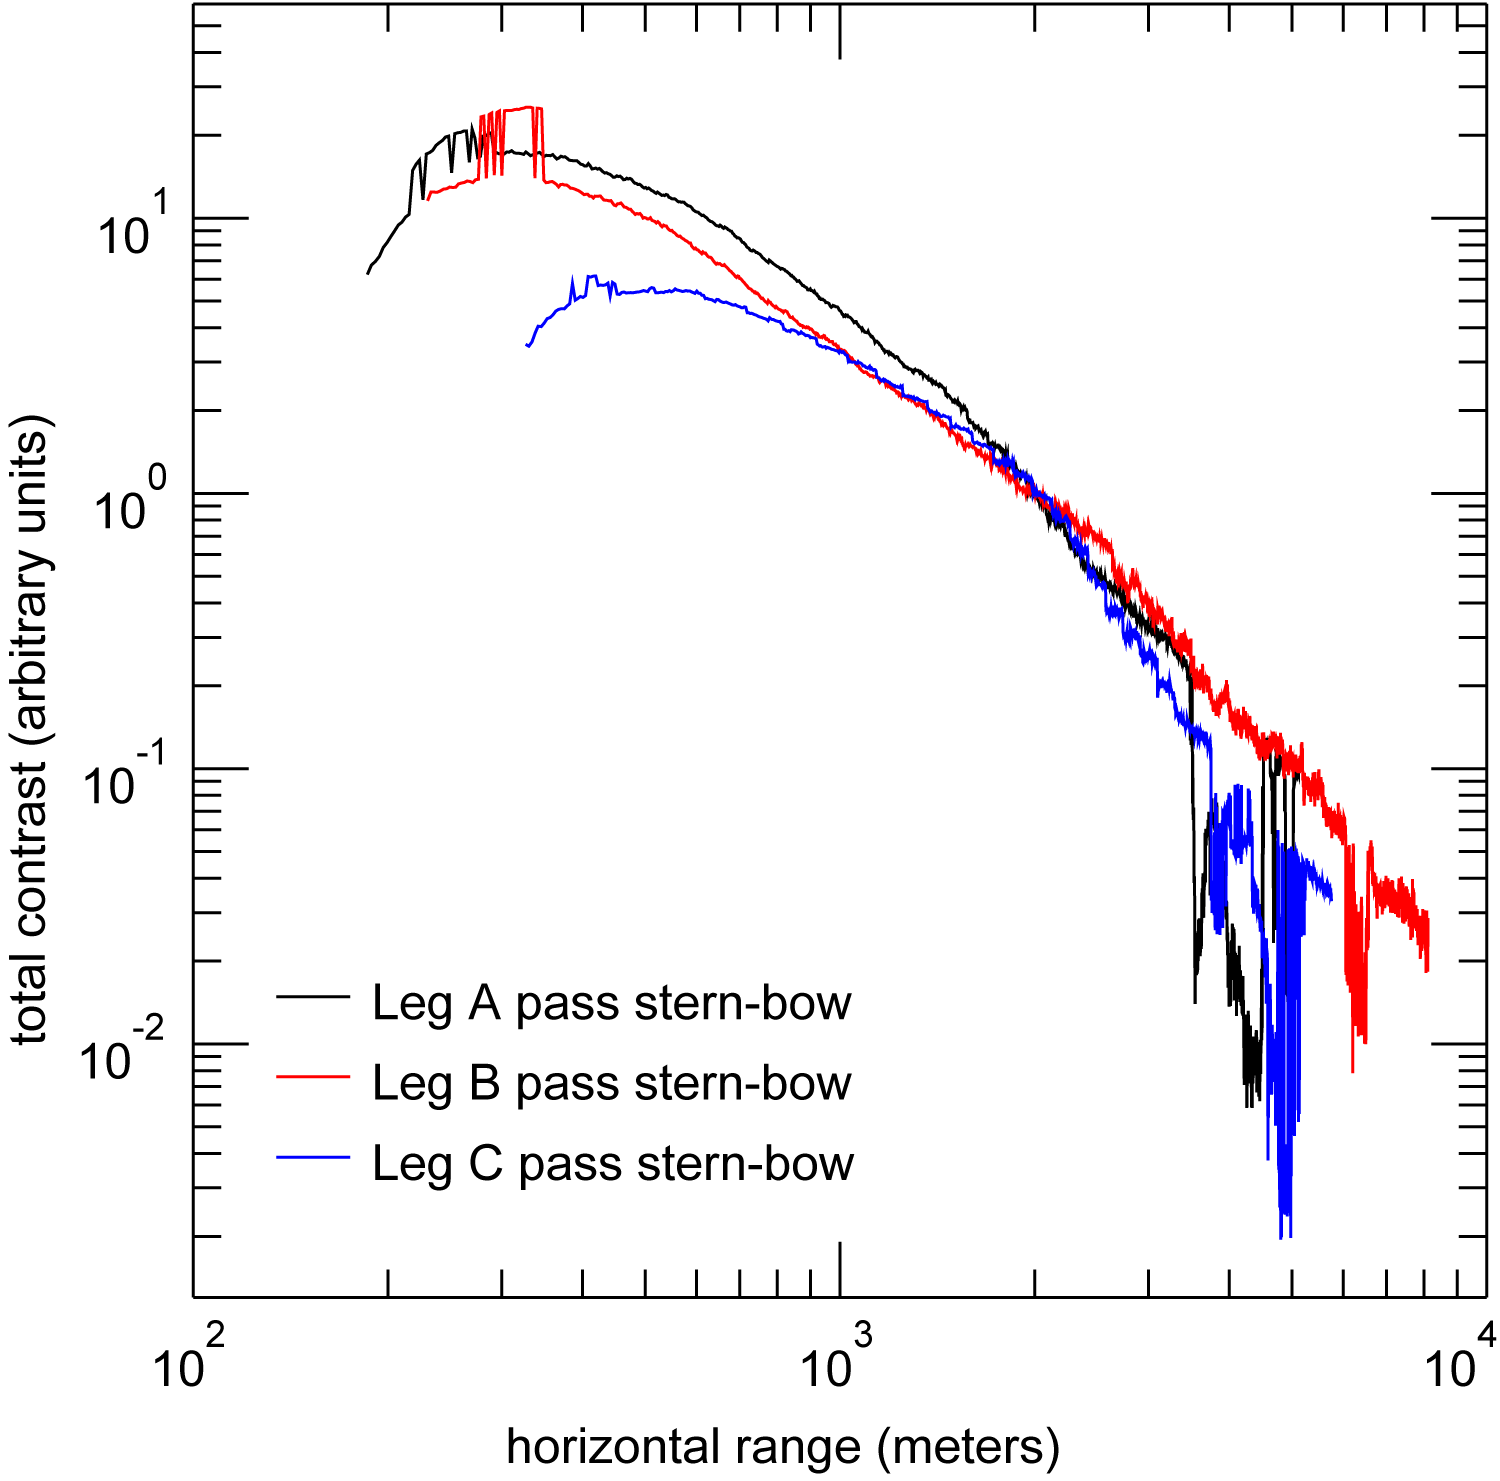
The variability in the total contrast signature between passes probably arises from the different backgrounds. As discussed earlier, the background profiles depend on the relative angle between the sun and the aircraft heading. This variability and indeed the differences due to the sun-ship configuration lead to some of the pass to pass differences in the contrasts. Errors in the computed horizontal range due to variability of the speed of the aircraft, though expected to be small, alter the precise scaling of the horizontal axis and therefore contrast decay rates in all the data.
Manual operation of the tracking function for the MX-20 sometimes resulted in not having the cross-hairs centered on Quest at long ranges. At near ranges, the fluctuations are due to a change in the sign of the contrast. The strong sea radiance at these steep viewing angles result in almost zero, pixel by pixel, ship contrast. While the contrast is small, the total contrast is large since there are many non-zero pixels in the relatively large ship region. The near and far range fluctuations are thus artifacts in the way the data was obtained and analyzed. Yet the general behavior of the total contrast with range is easily seen in Figures 10 through 12.
Conclusion
Our analysis of the image data from an operational military EO-IR surveillance system, the MX-20, is a proof of concept of the usefulness of such equipment for scientific research. We succeeded in extracting the background radiance through the aircraft approach and averaging the data from several altitudes to obtain meaningful sky-to-sea profiles over a wide range of elevation angles. Using simple image analysis methods, we extracted the total mid-wave IR contrast signature of research vessel CFAV Quest over a wide range of angles and sensor-ship separations.
Standard military sensors may be exploitable in furnishing valuable, quantitative data for rapid assessments. The trial described in this paper underlines the speedy acquisition of image data over a broad spectrum of parameters such as altitudes, distances and viewing angles that are difficult to obtain during dedicated scientific trials. From this trial, we have learned how to use the MX-20 system to obtain and process image data. Future trials will be aimed at collecting image data of Quest and other vessels over a variety of scenarios and with a focus on the wake. In these trials, we will image Quest from a head-on position as she systematically changes speed and thus wake intensity and structure.
We plan to extend our use of the MX-20 system by varying the field-of-view, controlling the gain, using external calibrators, and attempting to access the raw data instead of the digital video. Copyright of this manuscript is retained by the Government of Canada.
Acknowledgement
The authors would like to thank Major Robert Schwartz for securing the availability of an Aurora and 405 Squadron (Crew 1) Greenwood for flying over CFAV Quest and obtaining the IR imagery. The authors also thank Dr. David Vaitekunas for his careful reading of this manuscript.
References
[1] Lockheed Martin Canada Inc., “CP-140 Aurora Electro-Optics/Infrared System”, 1010603, Rev. 2, 2003.
[2] Daniel L. Hutt, DRDC-A Trial Plans for Q300 (October 2006), Q289B (September 2005), Q280 (February 2004) and Q276 (August 2003). DRDC-A Technical Notes.
[3] W.R. Davis Engineering Ltd., “Infrared signature instrumentation, measurement and modelling of CFAV Quest for trial Q280”, A330-001, REV 0, 2005, “Infrared signature instrumentation, measurement and modelling of CFAV Quest for trial Q276”, A320-001, REV 0, 2004.
[4] The Solar Position Algorithm calculator is available at the Measurement and Instrument Data Centre of the National Renewable Energy Laboratory web page:
[5] W.J. Kang, X.M. Ding, C.W. Cui and L. Ao, “Research on Extraction of Ship Target in Complex Sea-sky Background”, Journal of Physics: International Symposium on Instrumentation Science and Technology, Vol. 48, 2006, pp. 354.
[6] X. Zhang, M. Lewis, P. Bissett, B. Johnson and D. Kohler, “Optical Influence of Ship Wakes”, Applied Optics, Vol. 43, No. 15, 2004, pp. 3122.
[7] C.R. Zeisse, C.P. McGrath, K.M. Littfin and H.G. Hughes, “Infrared radiance of the wind-ruffled sea”, Journal of the Optical Society of America A, Vol. 16, No. 6, 1999, pp. 1439.
[8] D.E. Freund, R.J. Joseph, D.J. Donohue and K.T. Constantikes, “Numerical Computations of Rough Sea Surface Emissivity Using the Interaction Probability Density”, Journal of the Optical Society of America A, Vol. 14, No. 8, 1997, pp. 1836.
http://www.nrel.gov/midc/solpos/spa.html.