
Volume 10, Number 2, July 2007
The Vulnerability Of Laser-Warning Systems Against Guided Weapons Based On Low-Power Lasers—part IV
- 1 Department of Aerospace, Power & Sensors, Cranfield University at the Defence Academy of the United Kingdom, Shrivenham, SN6 8LA.
Abstract
The theory for a laser sensor model was presented in Part I of this four-part series, followed, in Part II, by the creation of a simulation employing MATLAB and Simulink. Part III detailed the verification of the laser sensor theory and simulation by laboratory based experimentation. This fourth and final part of the series outlines the results of extensive field trials of real laser systems in the UAE and compares these with those of the simulator. This paper then briefly looks at how to incorporate the effects of atmospheric turbulence within the simulator and finishes with a brief parametric study using the simulator.
Introduction
The value of any computer simulator rises significantly if its results can be validated using physical experimentation. Part III of this series showed that good correspondence was found between the theoretical and laboratory-based experimental results. Even greater value can be attributed to the simulation if its results can be further validated by comparison to real world systems in a full field trial. The results of such a trial are reported here.
An important factor affecting the performance of any laser-warning receiver is the level of atmospheric turbulence experienced as the laser beam propagates from the source to the receiver. This topic is briefly discussed here as well as how the turbulence effects are implemented in the model.
The paper concludes with a brief description of a parametric study to show how a full sensitivity analysis or optimisation of a particular system could easily be carried out.
Field trials
Several well-known companies were invited to participate in a competitive bid process for the sale of laser warning systems to the UAE Land Forces. This was to be as part of a protection system comprising a laser-warning system, control unit and countermeasure system to be incorporated on UAE tanks and other armoured fighting vehicles (AFVs).
Part of the bid process involved full performance trialling of the laser-warning systems over an almost two-year period. The field trials were conducted on a military training ground for all types of weathers conditions, including the harsh summer conditions in the UAE between May and August. Various laser systems were used to stimulate the laser-warning receivers, including: laser rangefinders, laser designators and laser-beamrider guidance systems.
For commercial reasons it is not possible to identify the four particular companies that took part and the laser-warning systems fielded, hence the results are annotated as company A, B, C, and D.
There are clearly many results achieved from such an extensive trial. For ease of display therefore, we simply present the maximum detection ranges achieved in the various weather conditions (as previously defined in Part II) for the four laser warning systems trialed, against a particular Nd:YAG laser rangefinder (λ=1.06µm). These results are given in Table 1. The analysis of the results showed that, as expected, the weather conditions substantially influenced the performance efficiency of the laser warning systems and the trends experienced in the field trials are mirrored by the simulator results.
To model accurately the commercial systems with the simulator would require precise values of the components used in the laser-warning receivers. The companies involved are understandably reticent to give such full details of all of the parameters in their systems. However, company A, the provider of the best performing system, was persuaded to give sufficient details such that the simulator could be run with only a few engineering assumptions having to be made.
When the simulator results and the company A results are compared, Table 2, a significant degree of agreement can be seen, giving further credibility to the simulator as a predictive tool. (It is thought that the errors in measuring the atmospheric conditions during the trials more than encompass any differences).
Atmospheric turbulence
Atmospheric turbulence can cause expansion, distortion, fluctuations in the angle of arrival (AoA) and fluctuations in the intensity of a laser beam as it propagates from its source to the receiver system. Atmospheric turbulence is caused by variations in temperature, humidity, and density of the air along the propagation path and these variations consequently alter the refractive index.
| Company | Detection Range (m) | ||||
|---|---|---|---|---|---|
| Good | Typ-1 | Typ-2 | Bad-1 | Bad-2 | |
| A | 4,500 | 4,100 | 3,300 | 2,100 | 1,950 |
| B | 4,300 | 4,000 | 3,200 | 2,000 | 1,900 |
| C | 3,900 | 3,800 | 2,950 | 1,950 | 1,890 |
| D | 3,800 | 3,500 | 2,500 | 1,830 | 1,700 |
| Detection Range (m) | |||||
|---|---|---|---|---|---|
| Good | Typ-1 | Typ-2 | Bad-1 | Bad-2 | |
| Company A | 4,500 | 4,100 | 3,300 | 2,100 | 1,950 |
| Simulator | 4,300 | 4,200 | 3,500 | 2,000 | 1,900 |
The study of the influence of turbulence on the transmission of laser radiation includes the so-called structural functions described by Kolmogorov. The medium spatial structural function is given by [1]:
where Dn(r) is the spatial structural function and r = r2–r1 is the distance between the researched points.
For locally isotropic and homogeneous turbulence it is fair to use the law of two thirds of Kolmogorov-Obukhov. This law states that the differences in indices and temperatures are proportional to the two-thirds power [1]:
where Сn2 is the refractive-index structure coefficient, which varies from 10–15m–2/3 for weak turbulence to 10–13m–2/3 for strong turbulence, l0 < r < L0, l0 = 1…2 mm—internal scale of turbulence; L0 = 5…10 m—external scale of turbulence [1,2].
One of the crucial factors that influences the functioning of the laser sensor is the fluctuations in the intensity of the arrival of the optical signal. For homogeneous turbulence in the atmosphere and weak fluctuations, the logarithm of dispersion of radiation intensity is evaluated by the expression [2]:
where σ02 is the logarithm of dispersion of intensity at weak fluctuations, k = 2π/λ is the wave number and R is the distance to the radiation source.
For strong fluctuations Tatarsky proposed the following [3]:
where σI2 represents the logarithm of dispersion of intensity at strong fluctuations. The RMS value is expressed as [1]:
where Ln(I) is the logarithm of the radiation intensity.
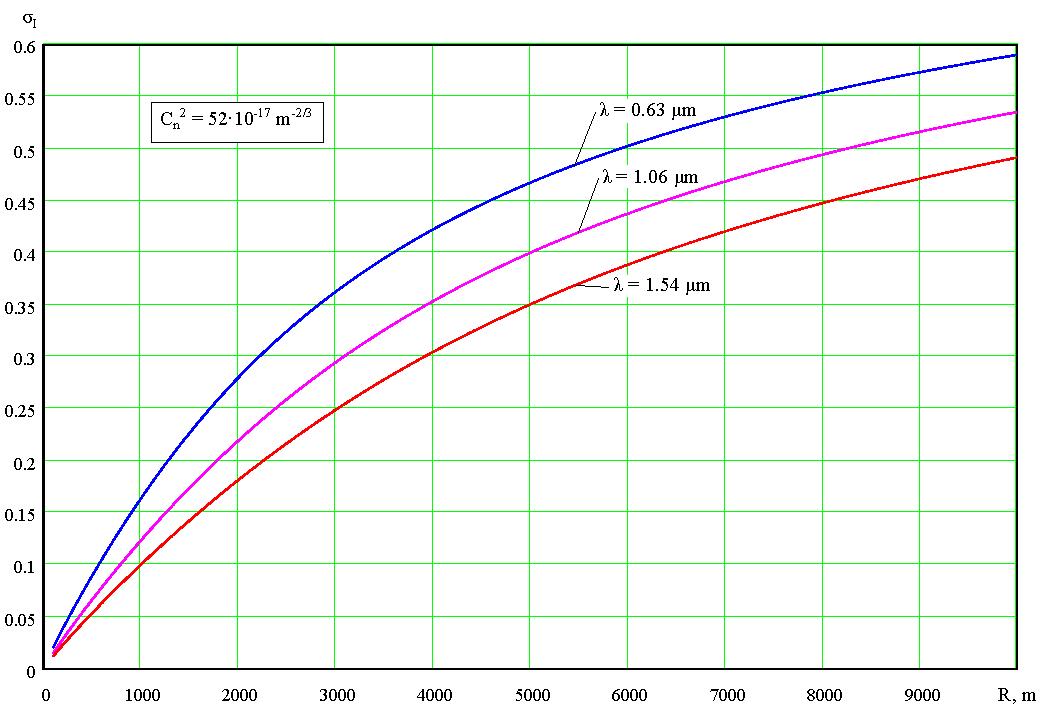
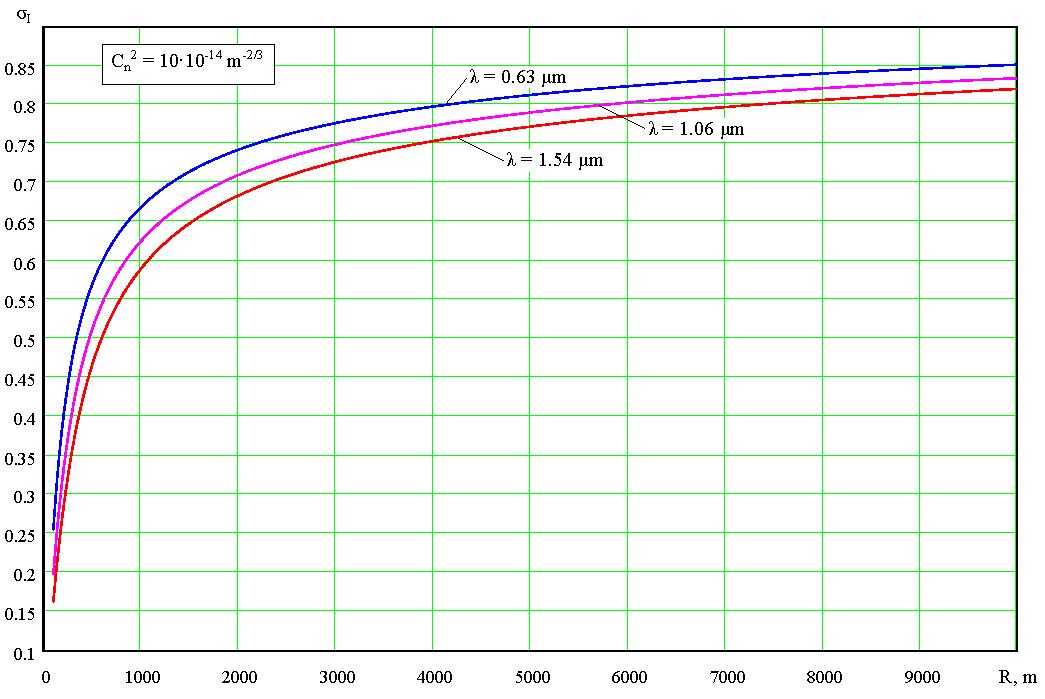
Some examples of these results are given for three laser wavelengths λ = 0.63, 1.06, and 1.54 µm. Figure 1 shows an example of weak turbulence and Figure 2 shows an example of strong turbulence. These curves show that the mean-square deviation of the logarithm of radiation intensity essentially grows with the increase in distance to the laser source and the level of turbulence and shows a weak dependence on wavelength.
Parametric study
The results of the laboratory experimentation and the field trials show that the simulator is quite good at representing real world performance. The simulator could therefore be used to accurately predict the laser aspects of beamriding missile systems and laser-warning receivers (LWRs).
This section briefly presents some of the results of a parametric study whose aim was to produce a sensitivity analysis matrix for a particular LWR.
Table 3 shows the expected increase in maximum detection range with increase in optical aperture. This is simply due to the increase in energy gathering capability.
Table 4 shows the expected increase in maximum detection range with increase in optical focal length. The increase in focal length results in a narrowing of the field of view and accordingly a decrease in background radiation level yielding an enhanced sensitivity in the receiving channel.
Table 5 shows the expected decrease in maximum detection range with increase in optical bandwidth of the receiving channel. The increase in optical bandwidth results in an increase in background radiation level yielding reduced sensitivity in the receiving channel. Obviously the wider the optical bandwidth coverage then the greater the spectral range a single system can cover and the more diverse laser threats a system can detect.
Table 6 shows the expected decrease in maximum detection range with increase in electrical bandwidth of the receiving channel. The increase in electrical bandwidth results in an increase in noise levels in the receiving channel. This bandwidth clearly should be optimised to the laser signal spectrum, something that is clearly difficult without a priori knowledge.
| Atmosphere condition | Optical system (mm) | ||
|---|---|---|---|
| Ø30 | Ø40 | Ø50 | |
| Good | 5,500 | 6,300 | 6,900 |
| Typical-1 | 5,300 | 6,000 | 6,700 |
| Typical-2 | 4,200 | 4,600 | 4,900 |
| Bad-1 | 2,200 | 2,300 | 2,500 |
| Bad-2 | 2,100 | 2,200 | 2,300 |
| Atmosphere condition | Optical system (mm) | ||
|---|---|---|---|
| f = 40 | f = 60 | f = 80 | |
| Good | 5,500 | 6,500 | 7,300 |
| Typical-1 | 5,300 | 6,300 | 7,000 |
| Typical-2 | 4,200 | 4,700 | 5,100 |
| Bad-1 | 2,200 | 2,300 | 2,400 |
| Bad-2 | 2,100 | 2,200 | 2,200 |
| Atmosphere condition | Optical bandwidth (nm) | ||
|---|---|---|---|
| Δλ = 40 | Δλ = 80 | Δλ = 120 | |
| Good | 8,500 | 7,400 | 6,900 |
| Typical-1 | 8,000 | 7,100 | 6,600 |
| Typical-2 | 5,500 | 5,100 | 4,800 |
| Bad-1 | 2,400 | 2,400 | 2,300 |
| Bad-2 | 2,200 | 2,200 | 2,200 |
| Atmosphere condition | Frequency band (MHz) | ||
|---|---|---|---|
| Δf = 30 | Δf = 65 | Δf = 100 | |
| Good | 5,600 | 4,700 | 4,200 |
| Typical-1 | 5,400 | 4,600 | 4,100 |
| Typical-2 | 4,200 | 3,700 | 3,400 |
| Bad-1 | 2,200 | 2,000 | 1,900 |
| Bad-2 | 2,100 | 1,900 | 1,800 |
The above examples (and many others) can lead to the population of a sensitivity matrix for a particular system and hence enable a designer to concentrate and focus in on the most effective areas for any improvements that might be considered or deemed essential for a system.
Conclusion
Laser-assisted weapons, such as laser-guided bombs, laser-guided missiles and laser-beamriding missiles pose a significant threat to military assets in the modern battlefield. Laser-beamriding missiles are particularly hard to detect because they use low power lasers. They are even harder to defeat because current countermeasures are not designed to work against this threat [4].
The aim of this work was to examine the vulnerability of laser warning systems to guided weapons, to build an evaluation tool for LWRs and seekers, and try to find suitable countermeasures for laser-beamriding missiles that use low-power lasers in their guidance systems. The project comes about partly because of some unexpected results obtained from extensive field trails carried out on various LWRs in the United Arab Emirates desert, where severe weather conditions may be experienced.
In order to approach the subject, a computer simulation model has been developed to enable the assessment of all phases of a laser warning receiver and missile seeker.
The mathematical theory for the model and its implementation has been extensively discussed. Each part of the model has been simulated using MATLAB, Simulink, and the LOWTRAN VII computer code. The outputs of the model demonstrate it is behaving as predicted. The model is flexible and general enough to encompass all expected variations and can easily be updated with new or different data files.
Comparison of the simulation with both laboratory-based experimental results and field-trial data from real systems shows good agreement, leading to a high degree of confidence in the predictive ability of the model.
This project will enable both the evaluation and design of any generic laser warning receiver or missile seeker and specific systems if various parameters are known. Moreover, this model can be used as a guide to the development of reliable countermeasures for laser-beamriding missiles
References
[1] R.G. Driggers, P. Cox, and T. Edwards, Introduction to Infrared and Electro-Optical Systems, Artech House, 1999.
[2] G.R. Osche, Optical Detection Theory for Laser Applications, Wiley, 2002.
[3] V.I. Tatarsky, Wave Propagation in a Turbulent Medium, New York: McGraw-Hill, 1961.
[4] D.H. Pollock, Countermeasures Systems, The Infrared & Electro-Optical Systems Handbook, Vol 7, SPIE Press, 1993.