
Volume 10, Number 2, July 2007
Simulation And Measurement Of Fragment Velocity In Exploding Shells
- 1 Loughborough University, Leicestershire LE11 3TU, United Kingdom.
- 2 Cranfield University, Shrivenham, Swindon SN6 8LA, United Kingdom.
- 3 Defence Science and Technology Agency, 1 Depot Road #18-05, Defence Technology Tower A, Singapore 109679.
Abstract
This paper presents simulations of initial velocity distribution of fragments for non-trivial shapes of casing in exploding shells, using a semi-empirical computational model. The key to the proposed approach is the use of transformation of a general geometrical shape to a hollow sphere followed by an application of Gurney principles in the transformed domain. The model is validated against an analytical model for a finite cylindrical charge bounded by a cylindrical shell and identical end-plates. A computation for 105-mm shell with steel casing and aluminium fuze illustrates aspects involved in reliable comparisons of fragmentation models against a standard trial data. Further, a simple and inexpensive experimental procedure based on a pin gauges measurement is described. Measurements obtained for short cylinders and an 81-mm mortar bomb are compared with numerical predictions. The described model responds to the need for an improved, fast assessment tool applicable to practical designs involving geometrically complex multi-material shells. The results highlight a requirement for quality experimental data obtained for complex shapes.
Introduction
The purpose of a fragmenting warhead is to generate multiple fragments with adequate mass and velocity to damage target(s) within its intended lethal zone. There is a need to predict the velocity of the fragments not only for assessing the potential effect of the munition, but also to allow an assessment of its hazard in a credible accident. Although advanced numerical methods are currently available for fragmentation prediction, these can be time-consuming to learn and require lengthy computation. However, the greatest difficulty in obtaining a reliable computation using advanced numerical models lies in their requirement to use a set of complex input parameters which in the case of exploding shells are not readily (if at all) available. A designer of fragmenting shells is ultimately interested in the impact of the fragment. In order to compute trajectories of a large number of fragments (tens of thousands for naturally fragmenting shells) an initial velocity distribution must be known.
In contrast, this study aims at developing a fast analytical method for predicting fragment initial velocity in axis-symmetrical warheads. This information can be used in the assessment of the overall lethality of fragmenting warheads, and for further semi-analytical analysis or as an input to an advanced numerical code.
Fragmentation model
Since the first equations for prediction of fragment velocity for a sphere and an infinitely long cylinder based on the empirical data were formulated by Gurney [1], a range of equations valid for other simplified shapes have been proposed, for example, in various references. [2,3] For more complex shapes the formulation of an analytical equation becomes increasingly difficult. Occasionally, methods approximating a real shape by an infinite cylinder are used for estimation, not withstanding the consequent introduction of approximation errors and ignoring kinetic energy loses in fuze and base regions. Some other reported techniques divide a warhead into a set of short cylindrical segments and use the Gurney equation for every segment in turn. Such approaches need to be used with care as they are limited by the recognition that the Gurney equation is only valid for long cylinders.
For the calculation of fragment velocity of each element, we used an approach that closely follows Jayaratnam [4] but is modified to account for a possible change in density for each segment of the casing. Firstly the shell shown in Figure 1a is transformed, using a form of simplified conformal mapping, into a hollow sphere shown in Figure 1b. During the transformation the following are preserved: high explosive charge mass, casing total mass, and the surface area of the interface between casing and high explosive. If the radius of the hollow is b, and the transformed thickness of the charge is d as indicated in Figure 1b, such that the radius of the sphere is d+b, then:
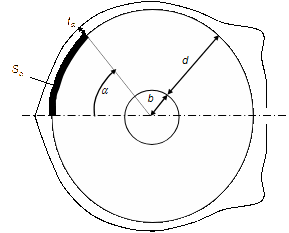
where: b is the radius of the hollow core, d the radius of the spherical charge minus the radius of the hollow core, S the total surface area of explosive in the warhead, C the mass of explosive, and ρC the density of explosive.
Each point of the inside of the casing (x,y) transforms to a point on the surface of the sphere represented by the angle α, given by:
where α is the angle subtended by point in sphere to centre of sphere with horizontal, and Sα the total surface area of explosive up to point (x,y).
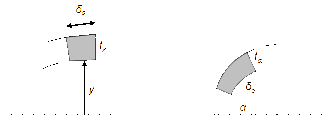
At each point the thickness of the shell tx transforms to tα. Posing a condition that the total mass of the ring element of the shell before transformation is equal to the total mass of the ring element in the transformed domain, the thickness at each point around the sphere, for natural fragmentation, can be obtained from:
where dS/dα is the rate of change of S with respect to α as shown in Figure 2.
The energy balance [1,5,6] of the Gurney equation requires that the energy available from the explosive is partitioned between the kinetic energy of the fragments and of the gaseous detonation products. Further assumptions made by Gurney are that the acceleration is instantaneous and that the energy loss through expansion of the case is negligible. Thus the energy balance can be written as follows:
C is the mass of explosive, E the energy of explosive per unit mass, Vg the velocity of gas, Vα the velocity of casing at angle alpha to the horizontal, dmC the mass of element of explosive gas, dmM the mass of casing element
The velocity of the gas is assumed to be a function of the distance of the element from the centre:
Note from Figure 2 that we can write (7) and (8):
After substitution of (6–8) into (5) and manipulation, the equation relating the integral of a function of the velocity and thickness at a point to the total energy can be written as in (9).
The unknown velocity Vα which is the velocity at any point defined by the angle α on spherical charge is derived by equating forces acting on either side of every element, placed at a distance r from the centre of the sphere as shown in Figure 3, and integrating them over the whole radius as in (10). and indicate accelerations corresponding to velocities vg and vα respectively.
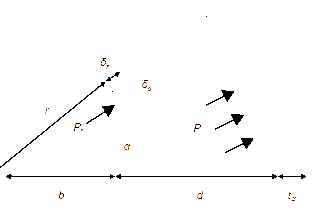
The pressure of the gas at the distance r can be expressed as:
where: PCJ is the Chapman-Jouget pressure (at detonation), f(t) a time function, and D a factor due to the detonation effects that influences the time function.
After substitution of (11) and the expression for gas velocity (6) into (10), letting r=b, integrating over time the following expression for Vα can be derived:
where the ratio of fragment velocity at α = 0 and at any point on spherical charge is given by (13) where: ρMO is the density of case material at α = 0 (that is, aluminium), ρM the density of case material at other α (that is, aluminium or steel), and t0 is the thickness of spherical charge at α = 0.
Note that there is no restriction in this approach on the density of the material used to define the total mass at each element of the casing, therefore in the above equation the density of casing ρM can vary according to input specifications. For example, ρM can represent density of aluminium for a typical fuze or of steel for a body of the shell.
Inserting (13) into (9) gives an expression for the velocity at the origin i.e. the velocity at α = 0 on the spherical charge:
where Z is defined in (14,15) and the angle χ indicates the place on a sphere where the material of the casing changes. By analogy, several types of material can be introduced.
There are various ways in which detonation effects can be introduced, here we use coefficients proposed by Jayaratnam [4]. They are a combined result of a physical analysis of a detonation wave behaviour, conclusions from the experimental work by Cook [7] and a series of comparisons with computations from runs of a hydrocode:
which is a factor due to detonation effects that alters the time function. D0 is Dα=0.
where: M is the total case weight or mass of casing, βα the angle of line from origin to point α, to the horizontal, and θα the angle of casing to horizontal.
| Computation No. | Length/ Diameter | Case /Explosive mass | Velocity | Difference | |
|---|---|---|---|---|---|
| Modified Gurney | Model | ||||
| 1 | 2.25 :1 | 3.68 | 1,239 | 1,200 | 3% |
| 2 | 1.3 :1 | 5.18 | 1,075 | 1,074 | 0% |
The approach summarised in this paper allows for more realistic modelling of a conventional warhead with steel body and aluminium fuze. It appears to be fast and well-suited to warheads of general shape and with walls of varying thickness.
Currently the directionality of fragments is accounted for mainly in computation of the fragment projection angle which is calculated based on the Taylor angle equation (8), linking detonation velocity, angle of the casing wall relative to the shell axis and fragment initial velocity. The fragment projection angle as shown in Figure 4 is:
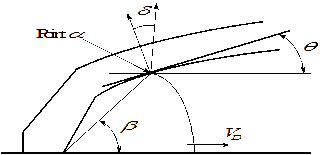
where VD is the velocity of detonation.
Model validation
Finite cylinder with end wall on both ends
The velocity computed by the model was compared with results obtained from a modified Gurney equation. Such equations are available for simple geometries and in this case a comparison involved a finite cylinder with end wall on both ends (Figure 5).
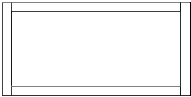
The relevant modified Gurney equation is derived in [3] and has the following form:
where C is the explosive mass, E the explosive energy per mass, ρE the density of endplate, ρS the density of cylindrical sleeve, tE the thickness of end plate, tS the thickness of cylindrical sleeve, VE the velocity of end plate, VS the velocity of cylindrical sleeve, ME the mass of one end plate, and MS the mass of cylindrical sleeve. The results were obtained for the following configurations:
Computation No. 1
Length/diameter Ratio = 2.25:1
Case mass, M = 1.48 kg
Case density = 7,092 kg/m3 mild steel
Explosive mass, C = 0.4 kg
Explosive density = 1,568 kg/m3 PE4
M/C = 3.7
Length = 0.144 m
Outer diameter = 0.064 m
Inner diameter = 0.05 m
End-wall thickness = 0.007 m
Initiation point = left end in the symmetry axis
Computation No. 2
Length/diameter Ratio = 1.3:1
Case mass, M = 2.28 kg
Case density = 8,105 kg/m3 mild steel
Explosive mass, C = 0.44 kg
Explosive density = 1,520 kg/m3 PE4
M/C = 5.18
Length = 0.108 m
Outer diameter = 0.082 m
Inner diameter = 0.064 m
End-wall thickness = 0.009 m
Initiation point = left end in the symmetry axis
The calculated velocities are given in Table 1 and are in excellent agreement. This is consistent with the assumptions made in the program that force is exerted against all the surface of the warhead, including any end wall. Therefore the model is best suited for the fully enclosed warhead casing. For comparison, the maximum predicted by the model velocity, obtained with a central initiation was used.
Open-ended finite cylinders and half mortar bomb
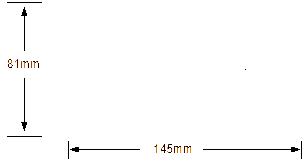
To aid further validation an experiment [11] was designed to gather information about the initial velocity of fragments. Two short cylinders and a half mortar bomb (filled with plastic explosive PE4 (which is essentially 88% RDX in a mouldable plastic binder), were fragmented. Trial 1 involved a 130-mm long, open ended cylinder with the 50-mm and 64-mm inner and outer diameters respectively. The open ended cylinder in Trial 2 was 90-mm long with the 64-mm and 82-mm inner and outer diameters. The geometry of the half mortar bomb used in the third trial is shown in Figure 6.
The initial fragment velocity was measured with a set of pin gauges, a voltage being recorded when the expanding case contacted each pin. The initial separation of case and pin, and the time of contact being known, the expansion velocity could be calculated. A typical oscilloscope trace is shown in Figure 7. The trace is noisy and the technique needs refinement but the relevant peaks may be analysed. The likely error in the position of the pins is 10%. [7,11].
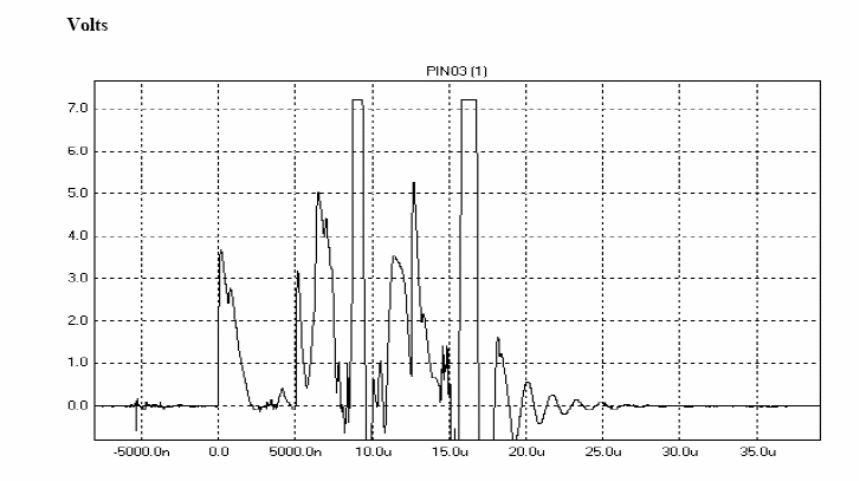
where the separation between the first and second pins is 4.8 mm, and between the first and third pins is 9.8 mm.
| Trial no. | Time of Peak in 1st Firing (s) | Velocity in 1st Firing (m/s) | ||||
|---|---|---|---|---|---|---|
| 1st Peak | 2nd Peak | 3rd Peak | 1st–2nd | 1st–3rd | Average | |
| 1 | 0 | 5.00E-06 | 8.60E-06 | 960 | 1140 | |
| 2 | 0 | 7.42E-06 | 1.44E-05 | 647 | 681 | 664 |
| 3 | 0 | 4.36E-06 | 7.95E-06 | 1,101 | 1,233 | 1,167 |
| Trial no. | Time of Peak in 2nd Firing | Velocity in 2nd Firing (m/s) | ||||
|---|---|---|---|---|---|---|
| 1st Peak | 2nd Peak | 3rd Peak | 1st–2nd | 1st–3rd | Average | |
| 1 | 1.88E-07 | 4.04E-06 | 9.06E-06 | 1240 | 1,105 | 1,173 |
| Trial No. | Length/ Diameter | Case /Explosive mass | Velocity | Difference | |
|---|---|---|---|---|---|
| Trial | Model | ||||
| 1 | 2:1 | 2.89 | 1,111 | 1,000 | 11% |
| 2 | 1:1 | 3.42 | 664 | 740 | 11% |
| Trial | Length/ Diameter | Case /Explosive mass | Velocity | Difference | |
|---|---|---|---|---|---|
| Trial | Model | ||||
| 3 Half 81-mm mortar | 1.36 :1 | 4.21: 1 | 1,167 | 1,086 | 7% |
Table 2 shows the times for the three peaks selected from the pin gauge record. The average velocity from the first and second firing of Trial 1 is 1,111 ms–1 and this is used to compare with the model’s prediction. The average velocities for Trial 2 and 3 are 664 ms–1 and 1,167 ms–1 respectively. It should be highlighted that the location of the peak is cluttered by noise in the measurement and this makes the interpretation subjective. The fragmentation model is designed for a fully enclosed warhead casing. Therefore, the open ends of the warhead are simulated using a thin wall of air. In the case of the half mortar, the location of the thin wall coincides with the limit of explosive.
The measured velocities are compared with the model prediction in Table 3. The results are calculated using the following cylinder properties:
Trial 1
Length/diameter Ratio = 2:1
Case mass, M = 1.156 kg
Case density = 7,092 kg/m3 mild steel
Explosive mass, C = 0.4 kg
Explosive density = 1,568 kg/m³ PE4
M/C = 2.89
Length = 0.13 m
Outer diameter = 0.064 m
Inner diameter = 0.05 m
Initiation point = left end on the symmetry axis
Trial 2
Length/diameter Ratio = 1:1
Case mass, M = 1.506 kg
Case density = 8,105 kg/m3 mild steel
Explosive mass, C = 0.44 kg
Explosive density = 1,520 kg/m³ PE4
M/C = 3.42
Length = 0.09 m
Outer diameter = 0.082 m
Inner diameter = 0.064 m
Initiation point = left end on the symmetry axis
The result shows a reasonable match between the model and the trial, with the difference at around 11%. (approximately 3.5% the difference between the firings). Similar results given in Table 4 were obtained for the half mortar. The following input data were used:
Length/diameter Ratio = 1.36:1
Case mass, M = 1.364 kg
Case density = 5,370 kg/m3 cast iron
Explosive mass, C = 0.324 kg
Explosive density = 1,434 kg/m3 PE4
M/C = 4.21
Length = 0.11 m
Outer diameter = 0.081 m max
Inner diameter = 0.064 m max
Initiation point = left end in the symmetry axis
The results show a difference of 7% in the maximum velocity. This could be due to an inaccuracy in the mortar profile, the presence of voids when filling the mortar as well as the inherent inaccuracy in the measurement. The comparisons of velocity profiles are not possible with this type of experimental data.
105-mm shell with steel case and aluminium fuze
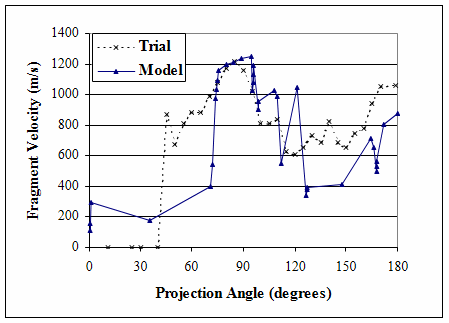
The velocity data from a 105-mm shell with steel case and aluminium fuze is extracted from the Joint Munitions Effectiveness Manual [9] to validate the velocity distribution as shown in Figure 8. This reference gives only partial information about the trial data, therefore Figure 8 may not represent a direct comparison. The graph indicates a good match at the nose of the fuze, the middle of the shell and in the base region. The differences at other locations are greater. There are several main sources of error. In the absence of detailed technical drawings the model used a simplified approximated geometry.
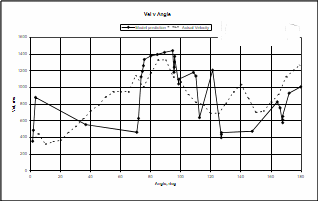
Moreover, since the method of analysis of the arena trial data used to derive initial velocities is not known, it is possible that the comparison suffers from misinterpretation of the projection angle and inaccuracies in estimation of the trajectory of fragments. In general, analysis of arena trial data assume idealised flight of the fragments from one point, while both experiment and the model indicate more complex physics, including a possibility of fragments’ paths crossing.
These type of error would be least pronounced in the middle of the shell. As a result one can note a characteristic for arena trial data sharp changes of velocity, in Figure 8, away from the middle of the shell. A sudden pick in velocity near base region indicates small amount of high speed fragments obtained at this range of the arena format angle. The decrease of the increment angle in arena format changes the character of the graph by smoothing it. Further calculations were conducted to predict the natural fragmentation of this shell according to the semi-empirical method described earlier by Szmelter et al [10]. That computation shows the resulting cumulative mass versus fragment mass graph to be in a very good agreement with the data from that trial.. The calculations for 105-mm shell were repeated assuming that both the case and the fuze were of steel and that the explosive was TNT. The results for velocities are presented in Figure 9, while the corresponding mass distribution is published in the earlier reference [10]. Both confirm previously discussed tendencies.
Conclusions
We have described and studied a numerical method for calculation of fragment velocities. The method is general in a sense that is applicable to warheads of general shape, with walls of varying thickness and with multi-material casing. We found that the method is consistent and can be used for predictions.
In general the validation of fragmentation models is limited by the availability of reliable experimental data. Therefore we have conducted the validation in three stages. Firstly, we compared the model with trials data in the open domain. Although many relevant trials have been conducted, there are often insufficient details of the experimental configuration and of the raw data to allow a satisfactory reanalysis. Further, we have found in other validations outside this present study that the averaging procedures commonly adopted for reporting the velocities and masses of fragments from such trials result in the additional loss of much information. Although we do not substantiate this in the present paper we believe that it is important to make the reader particularly aware of the errors introduced by the reduction of experimental data. Secondly, we made comparison with a modified Gurney equation. For the simple geometry of a finite cylinder with an end-wall at each end the proposed method gives a very close match with an analytical formula derived for this shape. In this case the maximum velocities were used for comparison. In the numerical method a distribution of velocity is obtained. The modified Gurney equation gives a single velocity which is assumed to be constant over the length of the cylinder. Thirdly and finally, we have conducted a serried of trials designed specifically to aid the validation of the model, although measurements were taken only at a single position on the case. These comparisons indicate an accuracy of approximately 10%, which is of the order of the likely errors in the experiment which are due principally to the error of positioning the pins. The experimental method for measuring the initial expansion of the cylinder is simple and effective, but needs refinement to reduce the noise on the trace.
The presented study highlights the need for more data of high quality for the validation of numerical fragmentation methods. Such data is seldom available in open literature. A thorough validation of the model showing that the model consistently reproduces trial data can be found in the restricted publication [12].
References
[1] R. Gurney, The Initial Velocities of Fragments from Bombs, Shells and Grenades, BRL Report No 405, Aberdeen Proving Ground, Maryland, ATI 36218, 1943.
[2] T.E. Sterne, A Note on the Initial Velocities of Fragments from Warheads, BRL Report No 648, US Army Ballistic Research Laboratory, Aberdeen Proving Ground, Maryland, 1947.
[3] Extension of Gurney Formulas, Document S5B-4, Honeywell Systems & Research Division, Feb 1965.
[4] DJ.J. Jayaratnam, The Design of High-explosive Fragmentation, PhD Thesis, Royal Military College of Science, Cranfield University, Nov 2001.
[5] E. Hirsch, “Improved Gurney Formulas for Exploding Cylinders and Spheres using ‘Hardcore’ Approximation”, Propellants, Explosives, Pyrotechnics, Vol. 11, pp. 81–84, 1986.
[6] W. Flis, “Gurney Formulas for Explosive Charges Surrounding Rigid Cores”, 16th International Symposium on Ballistics, 1996.
[7] N. Cook, The Science of High Explosives, Reinhold New York, 1958.
[8] P. Chou, J. Carleone, E. Hirsch, W. Flis, and R. Ciccarelli, “Improved Formulas for Velocity, Acceleration and Projection Angles of Explosively Driven Liners”, 6th International Symposium of Ballistics, 1974.
[9] Fragmentation Characteristics and Terminal Effect Data for Surface-to-surface Weapons (U), Joint Munition Effectiveness Manual 61S1-K-UK-3-4, Revision 1, 1 Jul 1982
[10] J. Szmelter and J.S. Yeo, “A Method for Predicting Natural Fragmentation of Warheads”, Journal of Battlefield Technology, Vol. 6, No. 2, July 2003.
[11] I. Tinsley, Naturally Fragmenting Warhead—An Empirical Method for Measuring Initial Fragment Velocity and an Analysis of Fragment Size, MSc Thesis, Royal Military College of Science, Cranfield University, Jul 2005.
[12] J. Szmelter et al, Validation of the Natural Fragmentation Methodology, Cranfield University RMCS Report DCMT/ESD/JS/1289/06.