
Volume 10, Number 1, March 2007
Human Skin And Hair Spectra Could Reduce Biometric Fraud
- 1 Department of Aerospace, Power & Sensors, Cranfield University at the Defence Academy of the United Kingdom, Shrivenham, SN6 8LA.
Abstract
Biometric techniques for positively verifying the identity of people have gained popularity in recent years. This may be attributed to improved technology and increased processing power leading to lower false positives, errors and an increase in sophistication of statistical and recognition algorithms. Initially, biometric systems generally operated in a single modality employing methods such as iris, retinal or fingerprint scans to identify an individual. To improve robustness, an emerging trend is to combine a number of biometric measures to produce multi-modal systems. Regardless of the method of imaging, a consistent problem is verification that human tissue, rather than prosthetics, video or other images are being used to stimulate the device.
Introduction
Biometric techniques for positively verifying the identity of people have gained popularity in recent years. This may be attributed to improved technology and increased processing power leading to lower false positives, errors and an increase in sophistication of statistical and recognition algorithms. Initially, biometric systems generally operated in a single modality employing methods such as iris, retinal or fingerprint scans to identify an individual. To improve robustness, an emerging trend is to combine a number of biometric measures to produce multi-modal systems. Regardless of the method of imaging, a consistent problem is verification that human tissue, rather than prosthetics, video or other images are being used to stimulate the device.
This work reports on introductory measurements of the spectra of human skin and hair that were conducted to establish further possible techniques for reducing biometric fraud or ‘spoofing’ in such systems.
Experimental
Reflectance spectra from the faces of sixteen volunteers were measured in situ using a Perkin-Elmer Lambda 9 spectrophotometer from 250 nm to 800 nm. Additionally spectra of twenty hair samples were obtained after being mounted on slides.
Measurements at UV and visible wavelengths were made using a 150-mm diameter integrating sphere, referenced to a high reflectance diffuse white standard (Labsphere, Inc. Spectralon). This integrating sphere did not operate at NIR wavelengths, so for separate measurements between 600 nm and 2,100 nm a specular reflectance jig was used with the same Spectralon block as standard and a reference beam attenuator to balance sample and reference beam intensity [1]. The use of the specular reflectance jig restricted access to the measurement aperture and thus measurement of skin from the back of hands was only possible between these values.
It should be noted that because of this, as the specular component of reflectivity for each sample increases, erroneously high results may occur. Human skin and hair samples measured in this study have essentially matte surfaces and minimal gloss. As relative characteristic were required for this initial study, the measurements were considered adequate.
Results
In situ skin spectra between 250 nm and 800 nm
Figure 1 shows diffuse reflectance spectra for the left cheek of fourteen subjects from 250 nm to 800 nm. The ethnicity of the cohort consisted of nine Caucasians, four Chinese, and a single person of Middle Eastern origin. A single person had cosmetic makeup applied.
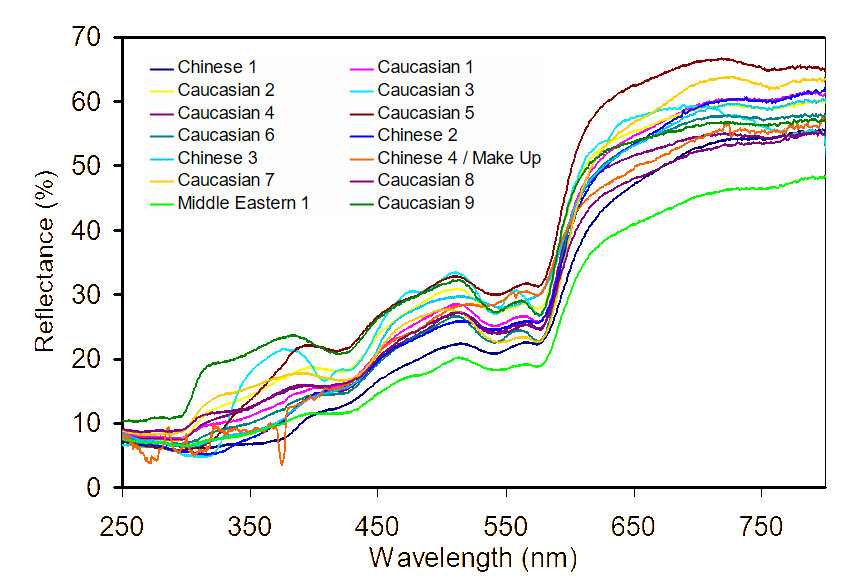
It may be seen from Figure 1 that the observed skin spectra show little variation with regards to general shape, indicating that it would be unlikely that people will ever be positively identified using such spectra. Some vertical scaling of the curves may be seen due to the natural variation in skin tone and measurement noise may be seen to increase slightly above 650 nm. It was noted that, as would be expected from Figure 1, Caucasian 5 had the lightest skin and Middle Eastern 1, the darkest.
Normalisation of the spectra with respect to the maximum value of each, to yield the relative reflectance, further highlights the similarity of the curves, as seen in Figure 2. With just a modicum of control on lighting conditions as may be expected at an open airport foyer, per say, it would not be possible to rely on obtaining absolute spectra for individuals without resorting to a more intrusive imaging modality with closely controlled lighting. The expectation that normalised curves may be obtained is more realistic. Lighting in an open airport foyer or other building forecourt will be affected by a myriad of variables including, time of day, crowd density, and weather. Under these circumstances operators would eventually become trained spectrophotometer operators which would defeat the mechanism for simple systems to detect biometric fraud.
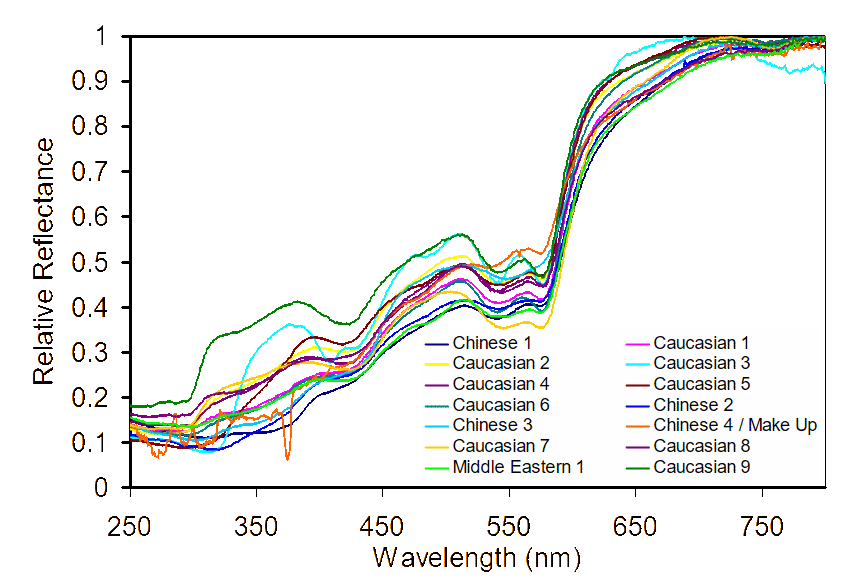
Figure 3 shows that there is more variation in the curves between 250 nm and 450 nm and this may be initially considered as a candidate for the identification of individuals. However, it is well known that skin damage due to ultraviolet light is prevalent in these regions and the variation may be attributed to this [2]. If unique characteristics were to be found in this region of the spectra it could not be guaranteed that they would not be altered due to skin damage.
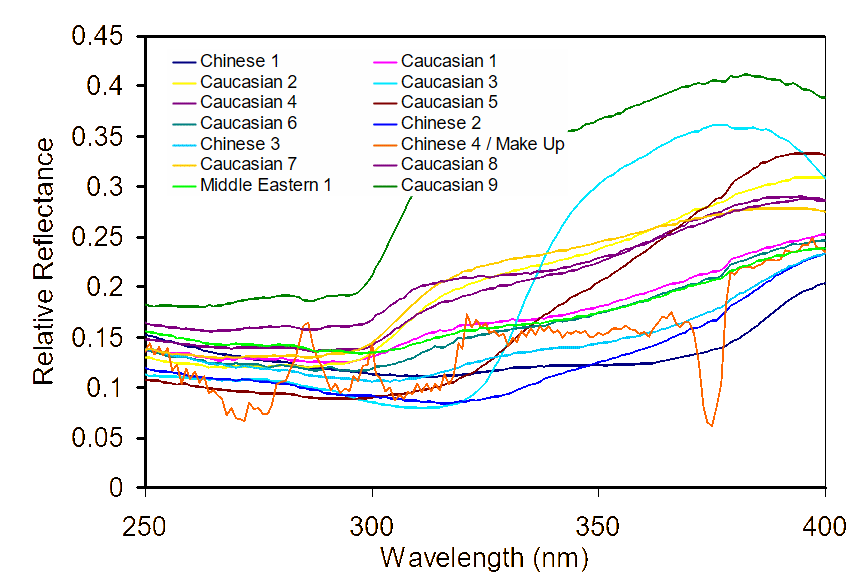
Figures 1, 2, and 3 quite clearly illustrate the continuous nature of the spectra of skin regardless of ethnicity or gender. This feature is particularly easy to distinguish from those of materials that are composed of a minimal number of chemicals and is relatively difficult to replicate. Cohort member ‘Chinese 4’ had cosmetic make up applied to the skin and this spectra is not only easy to distinguish from the rest of the sample group but also from the other Chinese participants as well. It is envisaged that it would be a relatively simple matter to implement any one of a number of algorithms available to calculate the maximum curvature [3] or local deviation of the spectra to evaluate if it exceeds a preset threshold. In the case of hyperspectral imaging this could then be used to indicate areas of the face that have makeup or other artificial colorants applied.
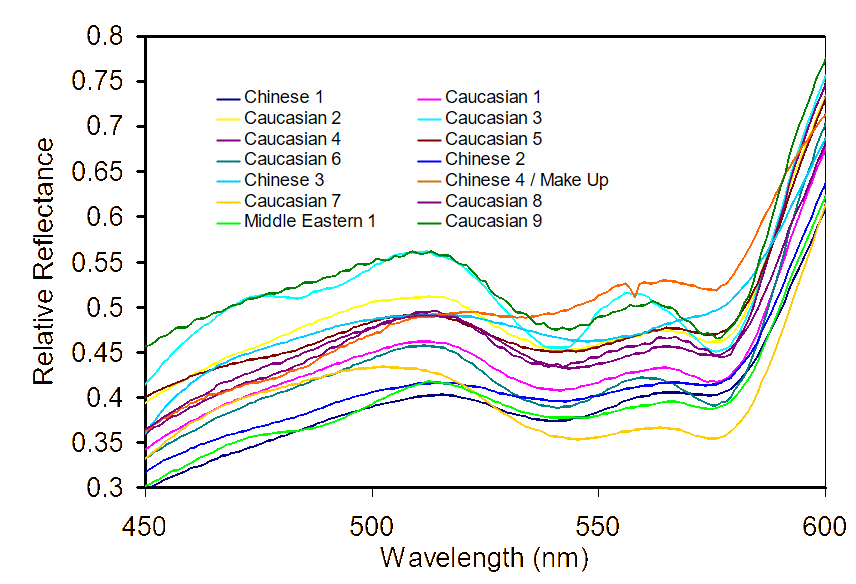
Figure 4 shows a characteristic and well documented ‘w’ shape found in the spectra of living human skin due to the presence of oxygenated haemoglobin [4]. It is anticipated that detection of this ‘w’ will provide a quick and simple method for determining if living flesh is being presented to a biometric device. It is anticipated therefore, that when combined with a measure for maximum curvature that it would be a relatively straight forward task to verify the presence of living flesh using non-contact methods [4].
Hair spectra between 250 nm and 850 nm
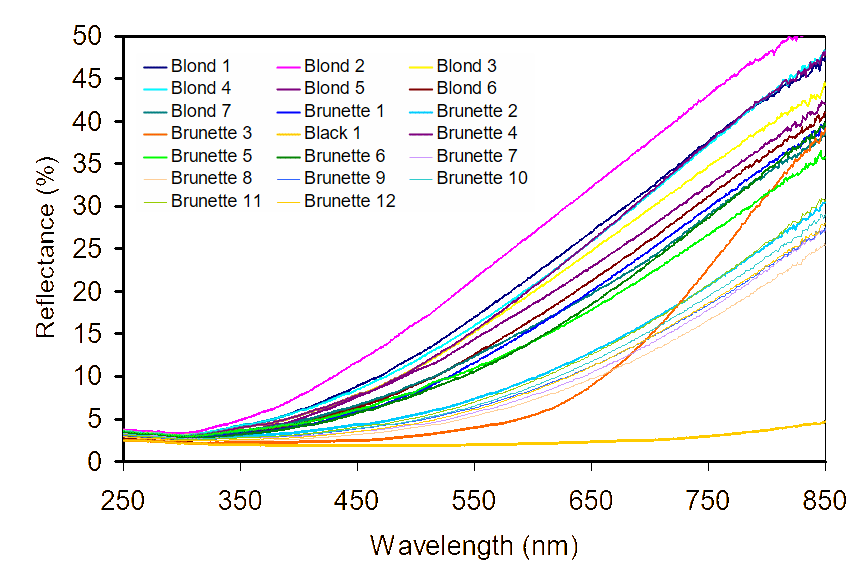
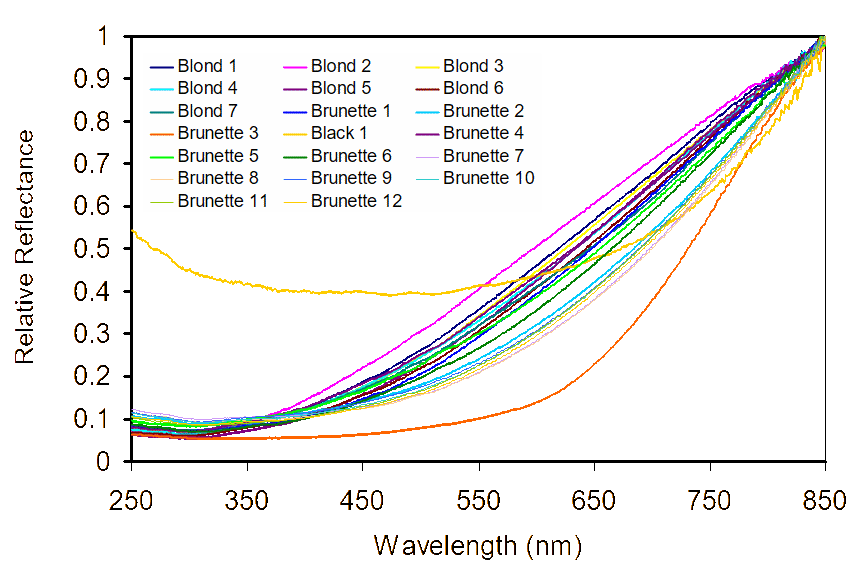
Figures 5 and 6 show the absolute and normalised results of the reflectance measurements performed on 20 hair samples from 250 nm to 850 nm. The samples were mounted on glass slides and attached to the measurement port of the integrating sphere accessory used. In much a similar manner to the skin measurements performed in this region of the spectra, no significant features of the hair samples were observed. It may be noted however that the curve for the black hair, shows a deviation after normalisation as shown in Figure 6. This may be attributed to the use of hair dye in this case, though due to the low reflectivity of the result, care should be taken with interpretation of the result.
Skin and hair spectra between 800 nm and 2,100 nm
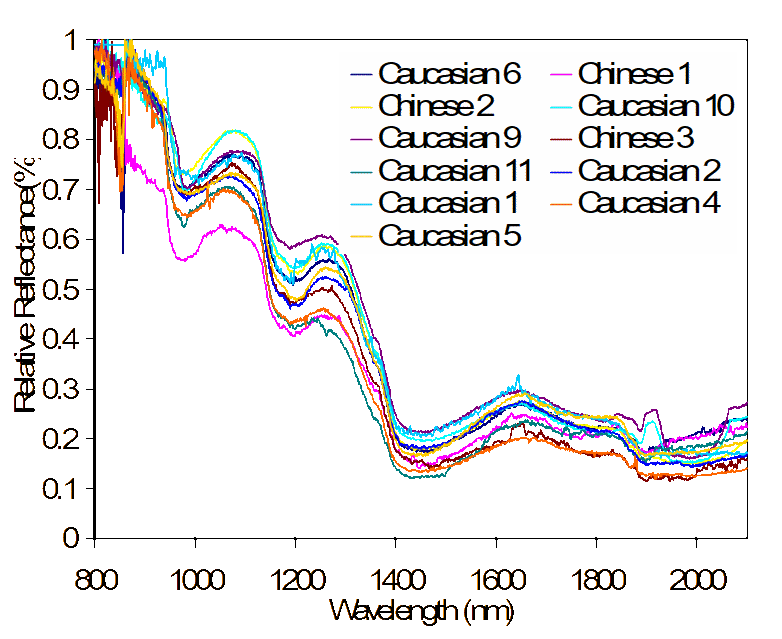
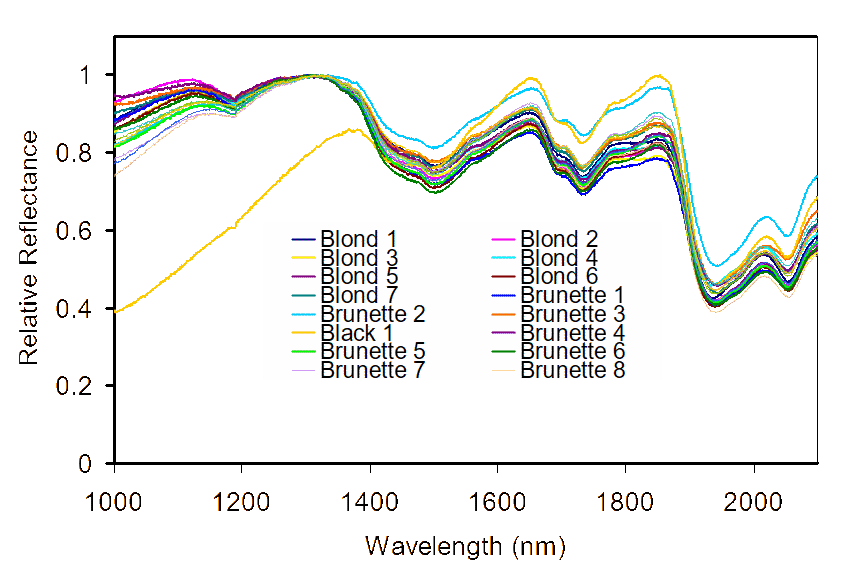
As previously mentioned, measurements at UV and visible wavelengths were made using a 150-mm diameter integrating sphere, referenced to a high-reflectance, diffuse-white standard. This integrating sphere did not operate at NIR wavelengths, so for separate measurements between 800 nm and 2,100 nm a specular reflectance jig was used. The use of the specular reflectance jig restricted access to the measurement aperture and thus measurement of skin from the back of hands was necessitated. As may be seen in Figure 7, the results are similar to those generated between 250 nm and 800 nm in so much as there are no distinctive characteristics which would enable identification. It may also be seen that there is increased measurement noise between 800 nm and 900 nm. Figure 8 illustrates similar results for hair spectra, though results between 800 nm and 1,000 nm have been omitted due to measurement noise. The deviation of the black hair from the expected result, due to the use of dye, can clearly be seen in this region of the spectrum, excluding the earlier mentioned errors due to low reflectivity.
Conclusions
Spectra have been measured for human skin and hair between 250 nm and 2,100 nm. Whilst these spectra do not exhibit any particular characteristics that may be exploited for biometric identification of individuals, a number of properties exist that may help to reduce or detect biometric fraud by confirming that living tissue is presented to biometric systems. Specifically it is thought that the departure of spectra from those normally exhibited by human skin induced by chemically based paints, makeup and plastics is relatively straightforward to detect. Further it is thought that by imaging the skin between approximately 500–600 nm hyper- or multi-spectrally, it will be possible to detect oxygenated haemoglobin reducing the incidence of photo- or gelatine-based fraud for video and fingerprinting systems.
References
[1] J.A. Coath and M.A. Richardson, “Electro-Optic, Multi-spectral Detection of Scatterable Landmines”, Proceedings IS&T’s 2003 PICS Conference, pp. 485–489, 2003.
[2] M. Ichihashi, M. Ueda, A. Budiyanto, T. Bito, M. Oka, M. Fukunaga, K. Tsuru, AND T. Horikawa, “UV-Induced Skin Damage”, Toxicology, 189, pp. 21–39, 2003.
[3] P. Parent and S.W. Zucker, “Trace Inference, Curvature Consistency, and Curve Detection”, IEEE Transactions on Pattern Analysis and Machine Intelligence, 2(8), pp. 823–839, 1989.
[4] N. Tsumura, N. Ojima, K. Sato, M.o Shiraishi, H.Shimizu, H. Nabeshima, S. Akazaki, K. Hori, and Y. Miyake, “Image-based Skin Color and Texture Analysis/Synthesis by Extracting Haemoglobin and Melanin Information in the Skin”, ACM Transactions on Graphics, 22(3), pp. 770–779, 2003.