
Volume 9, Number 3, November 2006
Genetic Algorithms Applied To Course-Of-Action Development Using The MANA Agent-Based Model
- 1 Both authors with Defence Technology Agency, Naval Base, Private Bag 32901, Devonport, Auckland, New Zealand.
Abstract
This paper describes a genetic algorithm (GA) tool added to the MANA agent-based model to assist with scenario development. Squads of agents are given chromosomes consisting of genes made up from various personality weightings in the MANA model; the emphasis is on evolving clever tactics and behaviour given the weapons and equipment squads already have. Concepts from evolutionary biology such as gene recombination and mutations are then applied to evolve fittest squads to optimally defeat an enemy in a given MANA scenario. We demonstrate the GA tool using two examples: a simple shooting battle between two massed forces, and a reconnaissance/counter-reconnaissance scenario in which a small Blue squad attempts to locate a high value target within enemy territory. Communications links in the MANA model are utilized for the information sharing, thus highlighting issues of network enabled operations. Generally, the genetic algorithm is seen to be a useful addition to the toolkit of military modelling techniques based on complexity theory.
Introduction
MANA (Map Aware Non-uniform Automata) is an agent-based distillation model developed by the Operations Analysis group at Defence Technology Agency in New Zealand [1,2]. It has been used by various military colleges and defence science establishments and has become one of the main modelling tools used at the bi-annual Project Albert workshops [3]. MANA has been used in a number of studies: the modelling of civil violence management [4], maritime surveillance [5], investigating modern warfare as a complex adaptive system [6], and a range of studies carried out at the Project Albert workshops [3]. One aspect of MANA which sets it apart from other agent-based models is its ability to model communications links between agents so that aspects of network centric warfare (NCW) may be studied [7].
The agents representing military entities in the MANA model are given a rule set which moves them on a battlefield grid according to their perceived environment and prescribed personality weightings. The environment may include terrain features and other enemy or friendly agents while personality weightings could be the tendency to run towards or way from enemy agents depending on how bold or cautious agents are defined to be for a particular scenario. Information about the environment can come from an agent’s own sensors or through communication links to other agents. A characteristic feature of agent-based models is that, although the one-to-one interaction between various agents and their environment may be quite simple, the combined effect of many agents interacting can lead to complicated group dynamics which is both unexpected and interesting. In this regard, agent-based models have the potential to represent the chaotic aspects of warfare quite well [8].
Simple agent-based models purposefully leave out all detailed physical attributes of the military entities being modelled if this is not expected to have any bearing on the study at hand. This allows scenarios to be run relatively fast and over many excursions in order to discover unique situations or tactics where friendly forces can achieve dominance over an enemy. Furthermore, by focusing on the effect of the personality weightings given to the agents, one may study the more intangible aspects of warfare. This is in contrast to conventional military modelling which might focus more on, say, studying the physical effects of weapons fire.
In this paper, we report on a new feature added to the MANA model to assist with scenario development: the genetic algorithm [9,10]. Genetic algorithms have recently found acceptance as a viable tool for solving a variety of problems such as designing electronic circuits [11,12], automated software development, and designing efficient communications networks. More generally, genetic algorithms can be used to solve problems requiring some type of optimization where a large number of parameters is involved and the mathematical structure of the fitness function is not well behaved or is unknown beforehand.
The genetic algorithm derives its inspiration from the way species are thought to evolve in nature. A species’ physical and behavioural characteristics are encoded by their genes. The ‘solution’ for a particular species corresponds to those individuals who are the fittest to survive in their environment. We endeavour to follow a similar strategy for designing military scenarios. Fortunately, the design of the MANA model readily allows us to add chromosomes to agents in order to devise an evolutionary scheme. Essentially, we use the agents’ personality weightings as the genes in our scheme. This then places emphasis on evolving clever squad tactics and behaviour for a given scenario. The genes in our scheme are integer valued, in contrast to the genes in evolutionary biology which are of binary nature.
In the following, we describe our genetic algorithm in more detail and give examples of its use. One example involves a straightforward shooting battle between two forces while the other example involves a reconnaissance scenario. These examples serve to highlight the effectiveness of the method. Indeed, research is still ongoing amongst the scientific community into the theoretical underpinnings of the genetic algorithm and understanding how the method works as well as it does [13–16]. We note that agent-based model EINSTein has also had a genetic algorithm added [17]. Also, Lohmeyer has previously investigated the use of a genetic algorithm coded in MATLAB to optimize MANA scenarios [18]. The genetic algorithm presented here is coded into the main MANA distribution and our scheme focuses on evolving clever behaviour and tactics through personality weightings with the military hardware already given.
The genetic algorithm
The scheme for our genetic algorithm is illustrated in Figure 1 and is fairly straightforward [19]. For scenarios involving several squads, the user has the option to select which squads are to be genetically evolved. Different squads can be selected to co-evolve together or, alternatively, squads can be evolved individually in turn while the behaviour of other squads is kept fixed. Co-evolving squads need not necessarily be of the same allegiance. Each selected squad is assigned a chromosome. The user chooses which MANA personality weightings are to comprise the genes which will make up the chromosome for a squad. At this stage, weapons and sensor characteristics cannot be selected as genes since our scheme focuses on evolving clever behaviour and tactics with the military hardware pre-defined for a scenario. The chosen genes define the master chromosome for a selected squad. A population of N chromosomes is then generated using the master chromosome as a template. Random gene values are initially assigned to the N chromosomes.
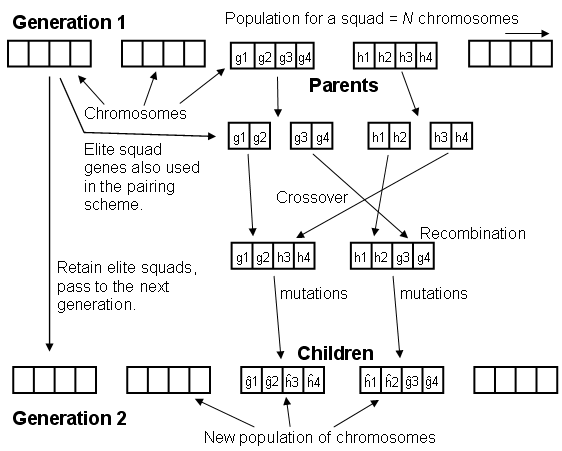
Personality weightings associated with the gene values of each chromosome in the population are assigned to the selected squad in turn. The squad is then placed into the scenario and its fitness is measured by how well it performs against the scenario’s enemy. The fitness is calculated from measures of effectiveness (MOEs) chosen by the user. This could be, for example, to maximize the number of enemies killed, minimize the time to reach a destination, or maximize the amount of territory seized.
Once fitness values associated with all N chromosomes have been established, a decision can be made about which chromosomes to keep in the population and which to throw away. In our scheme we retain the two fittest chromosomes and carry them unaltered to the next generation; the so-called elitist selection strategy. All remaining chromosomes are combined in a pair-wise fashion to generate new chromosomes for the population, as illustrated in Figure 1. Genes from the two fittest chromosomes are also mixed into this process. The pair-wise recombination is analogous to parents generating offspring in biology. Two chromosomes are fragmented; the fragments are swapped and then recombined to create two new chromosomes. The location along which the two chromosomes are fragmented is chosen randomly each time. In this way, it is hoped that good genes from separate chromosomes might fortuitously come together in a single chromosome to create a new elite squad. Once all chromosomes have been re-combined in this fashion, the new population of chromosomes is ready to be applied to the scenario. This process is repeated over subsequent generations, which gradually increases the squads’ fitness. Typically, after a few generations this results in a squad being evolved whose fitness in the scenario approaches the maximum theoretically possible according to the chosen MOEs.
We also have a facility to apply random mutations to the squads’ genes. In biology, the probability for mutations to occur is very low. Since biological genes are of binary nature, when a mutation does occur the gene value is changed by 100%. On the other hand, the genes in our scheme are integer valued so we have a choice about the degree to which their values might be allowed to change due to mutation. Mutations can be useful for helping the evolutionary scheme to attain new levels of fitness which are not available in the original gene pool. However, this can be a slow process occurring over many generations. Furthermore, if the mutation rate is set too high the evolutionary scheme may become unstable with good chromosomes being disrupted by the mutations. To date, our experience based on observation of our scenarios evolving has been that, provided the population size, N, is set large enough (typically 10–20), it will contain enough diversity to evolve an effective squad without the need for mutations. However, the use of mutations to help accelerate the evolutionary scheme is worth considering for future investigations.
Application: confrontation between two squads
The first demonstration scenario is illustrated in Figure 2. Here, a Blue force faces off against a Red force in a pitched battle with 20 agents on each side. The default case is a straightforward attrition-based battle where the odds are 50:50 as to which side wins. The genetic algorithm has then been applied to see if the Blue force can devise better tactics to defeat the Red force.
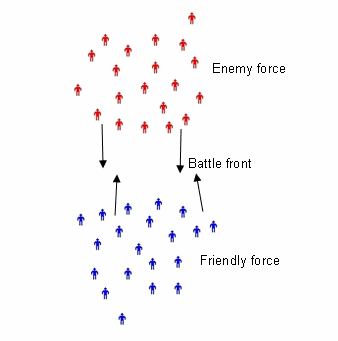
Genes selected for genetically evolving the Blue force are three personality weightings: movement towards enemies, movement towards friends, and movement towards waypoints. Given the simple nature of this scenario, it has been surmised that these three personality weightings will dominate the Blue force’s behaviour. The resulting 3-gene chromosome is illustrated in Figure 3.

The initial population size N was set to 10. Our experience has shown this to be more than adequate for smaller scenarios such as the one shown in Figure 2. To gauge the Blue force fitness, we have chosen an MOE to maximize Red casualties and minimize Blue casualties: MOE = (Red killed) – (Blue killed). Given 20 agents per side, the best possible outcome for Blue force would be to have MOE = 20.
With these parameters selected, the genetic algorithm is set in motion. The outcome is shown in Figure 4, revealing the tactics evolved by the Blue force to comprehensively defeat the Red force every time. The Blue force tactic is to retreat to the lower boundary of the battlefield and wait for the Red force to arrive. The Blue agents also group together for concentration of fire power. Since the Red force’s default behaviour involves always running towards Blue agents, they are inevitably killed off one by one as they approach. The Blue force tactics correspond to a realistic situation whereby defensive positions are taken up with foreknowledge of where the enemy is heading.
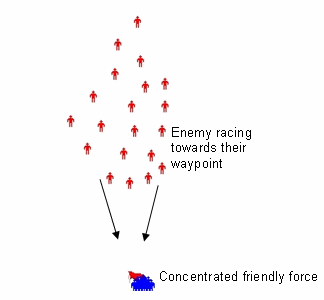
Gene values corresponding to the Blue force’s evolved strategy are WE ~ −30, WF ~ 60, and WW ~ −80. The strong negative weighting away from the Blue waypoint (located above the Red force in Figure 2) leads to the Blue force retreating to the lower boundary. The strong weighting towards friends leads to force concentration. There is also a negative weighting away from enemies. However, this movement weighting will have little effect on the Blue force’s behaviour once they have taken up a defensive position at the lower boundary.
The progress of the genetic algorithm in evolving Blue force tactics is shown by the MOE in Figure 5. This shows the fitness of the Blue squad increasing to an optimal value fairly rapidly and highlights the genetic algorithm’s effectiveness in arriving at a solution. (This is characteristic of the simple scenarios we have evolved to date.) Having found the fittest solution, the genetic algorithm settles into steady state with the MOE fluctuating near its maximum value. These fluctuations are due to the chaotic nature of the MANA model (and agent-based models in general), whereby each scenario excursion can yield a different result each time. Such fluctuations can have the danger that a good set of genes may, by chance, yield a poor result and be inadvertently dropped out of the gene pool. To avoid this happening our genetic algorithm allows access to the Multi-Run feature in MANA. This averages the MOEs over multiple runs and smoothes out the MOE from one generation to the next.
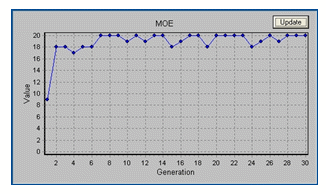
It is interesting to note that just before the fittest solution is reached (at generation number ~7), there is small epoch between generations 2 and 7 where a reasonable solution with MOE = 18 has been achieved. For finite systems, such epochs are expected to occur during a genetic algorithm’s approach to the fittest solution [20], with the epoch periods become longer and longer such that the fittest solution is approached asymptotically. Since our scenario is relatively simple, the solution contains just one epoch before the fittest solution is arrived at.
| Sensor range | Weapons range | |
|---|---|---|
| Blue force (Reconnaissance) | 3 km (30 cells) | 500m (5 cells) |
| Red force (Defence) | 1.5 km (15 cells) | 1.5 km (15 cells) |
| Agent SA (Direct sightings) | Squad SA (Intra-squad communications) |
|---|---|
| Next waypoint | Enemies |
| Friends | Range of influence to enemies |
| Squad friends | |
| Range of influence to squad friends |
Reconnaissance/counter−reconnaissance
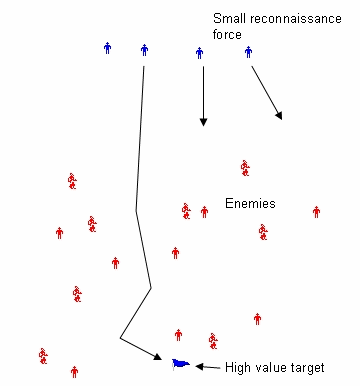
Figure 6 gives an example of a reconnaissance operation which better highlights the usefulness of the genetic algorithm as a course of action tool. In this scenario a small Blue force attempts to infiltrate enemy territory to acquire a high value target. This scenario has been used in a previous report appearing in [21]. The target is represented by a waypoint which at least one Blue agent must reach safely in a timely fashion. The scenario notionally represents a battlefield region of 40 km × 40 km. This has been set up on a grid of 400×400 cells so that each cell represents a distance of 100 m. All agents are given generic sensor and direct-fire weapons which are summarized in Table 1. It can be seen that the Red force has an advantage in weapons range which could, for example, correspond to heavy machine guns mounted on vehicles. The Blue force, being a light reconnaissance force, may only be carrying assault rifles with a typical accurate firing range of about 500 m. The Blue force has an advantage in sensor range, which is in line with them being a stealthy and vigilant reconnaissance force. On the other hand, the Red force sensor range out to 1.5 km is still very reasonable and, depending on the terrain, could correspond to good eyesight or the use of electro-optic sights on their weapons.
The Red force has been assigned a movement weighting of +20 towards enemies so they will chase Blue agents upon sighting them and hunt them down. The Blue agents have been given a negative movement weighting of –40, causing them to move away from enemy agents. This value acts as a reference against which other Blue agent movement weightings are pegged. For example, a movement weighting of >40 towards the waypoint corresponds to aggressive movement with minimal regard to enemies in their path. Conversely, a weighting of <40 corresponds to Blue agents moving towards the waypoint with more caution and avoiding enemies where possible.
Blue force tactics
Personality weightings selected as genes for evolving Blue force tactics are similar to the attrition-based scenario above and are chosen on the basis of what will be useful for the scenario. For example, a movement weighting towards fellow friendly agents is included so that Blue agents can decide whether to disperse or move together. Similar movement weightings are also selected from the squad situational awareness (SA) settings [22]. These represent intra-squad communications and can allow the Blue agents to share information regarding enemy sightings. We also invoke the range of influence for some personality weightings as evolvable parameters. A summary of personality weightings used in the evolutionary scheme is given in Table 2.
Personality weightings in Table 2 are selected as genes for the ‘Enemy Contact’ state as well as the agents’ ‘Default’ state in MANA. This provides additional flexibility for Blue agents to evolve different tactics when confronted by enemies. All up, the Blue force has 12 genes in each chromosome from which to evolve optimal tactics.
The fitness function is chosen as a combination of minimizing squad casualties and minimizing the time to reach the waypoint. Furthermore, the scenario has been given a maximum duration of 2 000 time steps. Hence, if all Blue agents are killed (with none reaching the waypoint) a penalty of 2 000 time steps is assigned to the MOE. This number is somewhat arbitrary but provides a reference point from which to compare MOEs amongst different scenarios.
To gauge the effectiveness of evolved Blue force tactics, a reference scenario has been arranged whereby the Blue agents simply rush towards the waypoint with no regard for their safety. This is achieved by setting the movement weighting towards the waypoint to the maximum value of 100. All other personality weightings, apart from WE = −40, are set to zero. The resulting MOE is given in the first row of Table 3. The average casualty rate is quite high at ~3 casualties, due to aggressive Blue agents blindly running into Red enemy agents and being shot. Also, the average time taken to reach the waypoint of 1 230 time steps is well above the theoretical minimum of 400 (the length of the battlefield). This is due to the cases when all Blue agents are killed, with none reaching the waypoint, and 2 000 time steps being recorded for the MOE.
Results of evolving Blue force tactics are given in the second row of Table 3. This represents a significant improvement over the reference case. Average Blue casualties are reduced to less than 1 agent and the average time taken to reach the waypoint is reduced to ~670 time steps. Not surprisingly, the ‘Enemy Contact’ state parameters become most relevant for the Blue force behaviour since they correspond to active Blue force tactics while in enemy territory and sighting enemy agents. The Blue force agents also make use of intra-squad communications via squad SA personality weightings when enemy agents are detected. In this case, an additional repulsion weighting of –24 is applied (on top of the –40 personality weighting for direct contacts) causing the Blue agents to temporarily back off. A negative movement weighting away from friendly agents upon enemy contact has also evolved so that Blue agents become more dispersed. This avoids having Blue agents being seen together at one location by the enemy and all shot at once. Finally, for no enemy contact an intermediate weighting towards the waypoint of ~40 has evolved. The Blue agents will therefore approach the waypoint with some caution. This weighting is such that it is readily over-ridden by repulsive movement weightings associated with the ‘Enemy Contact’ state.
When observing this scenario play out, the advantage of the evolved strategy is quite apparent. Upon reaching the enemy occupied area, the Blue agents spread out and manage to easily slip through gaps in the Red force positions. If any enemy agents happen to be blocking a path to the waypoint, the Blue agent concerned will hover and wait for a gap to appear or attempt to find an alternative path through to the waypoint. The evolved Blue force tactics for this scenario can be summarized as follows:
- Approach the waypoint with some caution and temporarily retreat if enemies are spotted.
- Spread out and allow each agent to find its own way through enemy territory. This increases the chances of at least one agent finding its way to the waypoint and avoids all agents being shot at one location.
- Intra-squad communications are important for sharing information regarding the location of enemies.
| Blue Casualties | Time taken | |
|---|---|---|
| Default scenario | 2.84 ± 0.14 | 1230 ± 80 |
| Evolved Blue force | 0.91 ± 0.11 | 665 ± 45 |
| Evolved Red force | 0.81 ± 0.11 | 1195 ± 80 |
Red force tactics
For interest, we have also applied the genetic algorithm to counter-evolve Red force tactics in order to keep the Blue force away from the waypoint. Genes selected to evolve the Red force are similar to those chosen for the Blue force in Table 2. The main exception is that Red agents must not be given a movement weighting towards the waypoint since, in principle, they have no fore-knowledge that the Blue agents are seeking this target. Results from evolving Red force tactics are given in the third row of Table 3. The tactics evolved by the Red force are to disperse themselves evenly throughout their territory and remain stationary. This blocks most paths towards the waypoint. Blue agents may occasionally still find a path through gaps in the Red force. However, by remaining stationary, Red force has the best chance of blocking most paths. If instead Red agents were to start moving about, Blue agents can simply wait for a gap to open up and then sneak through. From Table 3, it can be seen that this Red force tactic has significantly increased the average time taken for Blue agents to reach the waypoint. On the other hand, Blue casualties have not increased accordingly since the Blue force still adopts its tactic of avoiding enemy agents where possible. Red force tactics can be summarized as follows:
- Disperse evenly throughout the area of concern.
- Remain stationary so that Blue agents cannot sneak through gaps that might inadvertently open up from moving about.
Of interest is the method by which the genetic algorithm has found to keep the Red agents stationary. A positive movement weighting towards squad friends, as seen under the squad SA map, has been evolved. However, the corresponding range of influence has evolved a value sufficiently small that the Red agents can see only themselves in their squad SA map. Hence, they are weighted towards remaining at their current location. It is intriguing that the genetic algorithm has been able to find such a method to force the Red agents to remain stationary when they were not explicitly given genes to evolve their movement speed.
Summary
We have extended the usefulness of the MANA agent-based model by adding a genetic algorithm to assist with scenario development. The genetic algorithm works very well and usually arrives at some sensible solution to defeat the scenario’s enemy. The GA tool often brings up unexpected solutions that may not have been intuitively obvious at the outset. Even when the nature of the solution can be anticipated, the GA tool can be very helpful with setting up scenarios. Instead of spending several hours tinkering with parameter values, the GA tool can rapidly yield ‘ball park’ values from which to further develop the scenario. Our GA tool usually converges to a solution within approximately 10–20 generations. For smaller scenarios, such as the ones illustrated in this report, a population size of N ~ 10 was found to be more than adequate. For larger scenarios with multiple squads involved and many genes selected for large chromosomes, we have found N ~ 20 to be quite adequate for bringing up viable solutions. The user has the flexibility to adjust N based on their knowledge and experience of what should work given the GA scheme in Figure 1. Furthermore, since our GA scheme uses the MANA model as its engine, individual scenarios tend to run quite fast. Scenarios associated with each chromosome in the population can be observed playing out firsthand while the evolutionary scheme unfolds. One can then identify whether more than one viable solution is emerging from the population of chromosomes or if nothing is appearing and the evolutionary scheme may need to be restarted with different parameter values.
As an example, we applied the genetic algorithm to devising tactics for a small reconnaissance force to sneak through enemy territory and acquire a high value target. A main ‘lesson learnt’ was that the reconnaissance force should be dispersed and use communications links to share information regarding the enemy’s whereabouts. Until now, we have not included characteristics of the military hardware as evolvable parameters since it was anticipated that this would simply lead to an arms race with the sensors and weapons characteristics continually increased. The emphasis is more on evolving clever tactics and behaviour with the equipment already given. With this approach, the GA tool could, for example, help to assess new tactics available if a force becomes networked under the new NCW paradigm.
References
[1] M.K. Lauren and R.T. Stephen, “Map-aware Non-uniform Automata (MANA) a New Zealand Approach to Scenario Modelling”, Journal of Battlefield Technology, Vol. 5, No. 1, 2002.
[2] D.P. Galligan, M.A. Anderson, and M.K. Lauren, MANA (Map Aware Non-Uniform Automata) Version 3 Users Manual, DTA Technical Note 2004/6, April 2005.
[3] Information on the Project Albert workshops can be found at http://www.projectalbert.org/
[4] S.Y. Yiu, A.W. Gill, and P.Shi, “Using Agent Based Distillations to Model Civil Violence Management”, Journal of Battlefield Technology, Vol. 6, No. 1, 2003.
[5] D.P. Galligan, “Operational Aspects of Imaging Radar Systems in Maritime Reconnaissance Aircraft”, Journal of Battlefield Technology, Vol. 6, No. 3, 2003.
[6] M.K. Lauren, ‘Fractal Methods Applied to Describe Cellular Automaton Combat Models’, Fractals, Vol. 9, No. 2, p. 177, 2001.
[7] D.P. Galligan, “Modelling Shared Situational Awareness Using the MANA Model”, Journal of Battlefield Technology, Vol. 7, No. 3, 2004.
[8] A. Ilachinski, Artificial War: Multiagent-Based Simulation of Combat, World Scientific Publishing, 2004.
[9] M. Mitchell, An Introduction to Genetic Algorithms, MIT Press, Cambridge, Massachusetts, USA, 1996.
[10] D.E. Goldberg, Genetic Algorithms in Search, Optimization and Machine Learning, Addison-Wesley, Reading, Massachusetts, USA, 1989.
[11] Duncan Graham-Rowe, “Radio Emerges From the Electronic Soup”, New Scientist, p. 31, 31 August 2002.
[12] J.R. Koza, M.A. Keane, and M.J. Streeter, “Routine High-Return Human-Competitive Evolvable Hardware”, in R.S. Zebulum, D. Gwaltney, G. Hornby, D. Keymeulen, J. Lohn and A. Stoica, (editors), Proceedings of the 2004 NASA/DoD Conference on Evolvable Hardware, Los Alamitos, CA: IEEE Computer Society Press, pp. 3–17, 2004.
[13] S. Forrest and M. Mitchell, “Relative Building-Block Fitness and the Building-Block Hypothesis”, in D. Whitley (ed.) Foundations of Genetic Algorithms 2, Morgan Kaufmann, San Mateo, CA, 1993.
[14] E. van Nimwegen and J.P. Crutchfield, “Optimizing Epochal Evolutionary Search: Population-Size Dependent Theory”, Machine Learning, Vol. 45, p77-114, 2001.
[15] T. Jansen, K.A. De Jong, and I. Wegener, “On the Choice of the Offspring Population Size in Evolutionary Algorithms”, Evolutionary Computation, Vol. 13, No. 4, p. 413–440, 2005.
[16] J. Hu, E. Goodman, K. Seo, Z. Fan, R. Rosenberg, “The Hierarchical Fair Competition (HFC) Framework for Sustainable Evolutionary Algorithms”, Evolutionary Computation, Vol. 13, No. 2, pp. 241–277, 2005.
[17] Reference [8], Chapter 7.
[18] D. Lohmeyer, Optimal Selection of Parameters for Simulated Wargames, MSc Thesis, Division of Information Technology, Engineering and the Environment School of Mathematics, University of South Australia, 2002.
[19] For an introduction to genetic algorithms on the internet see: M. Obitko, An Introduction to Genetic Algorithms with Java Applets, http://cs.felk.cvut.cz/~xobitko/ga/, 1998.
[20] E. van Nimwegen, J.P. Crutchfield, and M. Mitchell, “Finite Populations Induce Metastability in Evolutionary Search”, Physics Letters A, Vol. 229, No. 2, pp. 144–150, 1997.
[21] M.K. Lauren and D.L. Baigent, “Exploring the Value of Sensors to a Recce Unit Using Agent-based Models”, Journal of Battlefield Technology, Vol. 4, No. 1, 2001.
[22] The MANA manual (reference [2]) provides further explanation of concepts such as the Squad Situational Awareness Map.