
Volume 8, Number 1, March 2005
An Exploratory Study Of The Army-as-a-System Core Skills
- 1 Defence Science and Technology Organisation, PO Box 1500, Edinburgh SA, 5111.
Abstract
Long-term planning for the army is inherently difficult due to the uncertain nature of future warfighting. Force structures have much potential for change in the ten- to twenty-year timeframe. Because of this uncertainty, investigation within the long-term timeframe must be undertaken using a generic approach, using ‘conceptual forces’ instead of structuring them around present paradigms.
Introduction
Long-term planning for the army is inherently difficult due to the uncertain nature of future warfighting. Force structures have much potential for change in the ten- to twenty-year timeframe. Because of this uncertainty, investigation within the long-term timeframe must be undertaken using a generic approach, using ‘conceptual forces’ instead of structuring them around present paradigms.
This approach can be facilitated by analysing the army at a sufficiently generic level such that uncertainties with respect to time are mitigated. In this study the capabilities of an army are broken down into a set of basic skills. Understanding the interplay and relationships between these skills can give insights into determining possible future directions. Similar work to this has been undertaken previously using a top-down approach [1,2]. The skill basis chosen for this study was taken from the definitions provided by the Army-as-a-System (AAAS) study [3,4], which defines a set of seven generic core skills that can describe a force’s capabilities.
To explore this space, tools are required that possess a sufficient level of abstraction as to avoid being too prescriptive in terms of the systems they describe. In this study, the class of tools known as Agent Based Distillations (ABDs) was chosen. ABDs tend to concentrate on the behavioural aspects of a force, abstracting technical details, and have been used extensively for this purpose [5–7].
Using one such ABD, Map Aware Non-uniform Automata (MANA) [8], a set of simple tactics was built and related to the AAAS. These tactics were then combined and played off against each other in an attempt to find emergent features of the system. Using these features it was then possible to draw insights into the complex relationship between basic skills.
To start with, we discuss the ABD tool chosen for this analysis, and then describe development of the various scenarios created in this study, including base tactics, combinations of base tactics and playoffs between tactics. Then we present and discuss the results of playing off the combinations of the skills against one another. We conclude with some of the insights derived from this study along with discussion of the future directions for research in this area.
Tools and models for analysing AAAS core skills
Army-as-a-System core skills
The AAAS core skills have been well defined in previous publications [3, 4]. The AAAS core skills attempt to ‘capture the essence of military operations’ by defining broad skills that remain relevant regardless of how a force may be structured, now or in the future. In addition, they are intended to be sufficiently generic to adequately describe a force at any particular level of interest. The AAAS construct is built on the concept that combinations of seven distinct core skills adequately describe a force structure through its capacity to perform functions and/or deliver effects. These core skills are: Engagement (ENG), Information Collection (IC), Communications (COM), Decision Making (DM), Sustainment (SUS), Movement (MOV) and Protection (PRO).
It is possible to use these core skills to rate any force’s effectiveness in each area. In general, various force structures have strengths and weaknesses in each area. For example, paratroopers may have relative strengths in Information Collection and Movement but be relatively weaker in other areas such as Engagement. On the other hand, an armoured formation may be stronger in Engagement but weak in Sustainment due to fuel needs. In addition, the relative strength of two competing forces can be easily analysed by comparing the capabilities in each core skill and identifying how that would impact on the other core skills. For instance, improving a force’s protection capability would impact on the relative engagement capability of an enemy combatant.
MANA configuration
All scenarios created for the study were branched off an initial default scenario, which is in turn branched off the default scenario MANA provides. The default MANA scenario places a single entity of both red and blue at the centre top and centre bottom of a 200-km × 200-km terrain box, respectively. Each entity has a waypoint leading towards its opponent’s position, so that they will meet in the middle of the terrain map.
From this, the following changes were made to create the default scenario for this study:
- The number of entities was increased to 50 for each side.
- The probability for kill of all entities at all ranges was set to 0.1.
- The firing range for all entities was set to 15.
- The sensor range for all entities was set to 20.
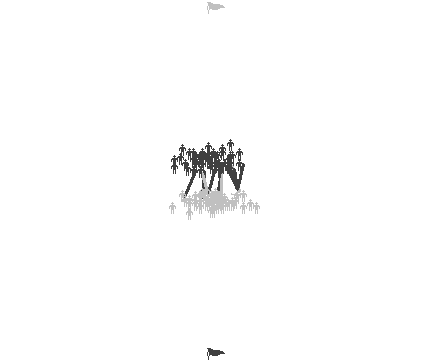
The first two variations are to ensure that the scenario lasts long enough for the effects of implemented tactics to take place, while the second two ensure that agents will see each other before they are within firing range, giving tactics a small amount of time to take action before battle begins. All scenarios end when any entity reaches its waypoint. Figure 1 shows the default scenario in action, at the point where the two forces meet.
Development of tactics
The basis for this study was constructed using a set of 11 ‘base tactics’. Each of these provides a force with a simple tactic to implement, such as an envelopment manoeuvre, having the units find cover when shot at and clustering of forces. Therefore, core skill proficiencies are not specifically coded into MANA, but instead are represented through tactics. Examples of some of the 11 base tactics are:
- Combat Advantage. Agents only advance toward the enemy if they have a local numerical advantage over their enemy.
- Stealthier when shooting. To represent concealed weapons systems, agents become stealthier for five time steps after firing.
- Retreat to friends when shot at. When shot at, a member of the force moves towards friends and away from enemies for five time steps.
Each tactic was weighted in relation to the seven AAAS core skills based on which of these skills the tactic represented an increased proficiency in. This weight is a number between 0 and 1 for each core skill. The sum of the weights must be equal to 1. Therefore, if a tactic is deemed to increase force proficiency in only a single area, the weight for that skill must be 1.
These weightings represent the areas a force is deemed to be proficient in when using the particular tactic. For example, a force using the Stealthier when shooting tactic was deemed to be more proficient at Engagement and Protection, with no specific proficiencies in any of the other categories. This is not to mean that a force using this tactic has no capability in these other areas, instead it means their proficiency in the other core skills is equivalent to a baseline force. This weighting system is how the tactics developed are mapped back to the AAAS core skills.
For the most part, tactics that generally only provide linear improvements in force effectiveness were avoided. For example, improving a force by simply increasing the effectiveness of its body armour tends to have predictable effects consistent with the Lanchester equations.
The choice and development of tactics focused on improving a forces conduct on the battlefield, rather than the salient features of the force. In creating the tactics, care was taken to keep them fairly simple. This formed a conflict with the other desire to avoid ‘linear’ tactics, as tactics that form potentially non-linear outcomes are inherently more complex. Therefore tactics had to be chosen from a fairly narrow band of possibilities. These restrictions made creating the base tactics the most challenging aspect of the study.
Finally, the core skills of Sustainment and Communications were avoided due to complexity issues. Implementing Sustainment required more complex force structures than the ones to be used in this study. It would be possible to implement Communications into the structure used, but it would have required special attention to implement from a modelling point of view, which we were not prepared to provide. We note, however, that the tactics identified appear largely to be communications and sustainment-neutral.
From this basis more complex forces were constructed. This was achieved by combining various permutations of base tactics. Using these combinations against a default red force, results were generated and compared with base tactics results to determine the performance improvements gained by combining various tactics and hence, core skills.
To gain further insights, tactics or combinations of tactics were given to both sides and played against each other. Two types of playoffs were used, the case where the red force was given a single base tactic (2v1 playoffs), and the case where the red force was given a combined tactic (2v2 playoffs). These two types of playoffs add steps in the levels of complexity explored in this study. Finally, all the scenarios developed were run again on an alternate terrain that had ‘blockage’ introduced. This blockage consisted of several squares on the landscape that block line of sight, movement and firing.
These playoff scenarios add an extra dimension to the analysis being performed. Instead of being tested against default opponents, skill combinations can be weighed up against each other, potentially showing optimal skill sets to use against various opponents. For each of these scenarios, the performance can be measured due to the knowledge of the performance of the tactics that make up the scenario.
| Tactic | Blue Casualties | Red Casualties | Casualty Difference |
|---|---|---|---|
| A | 38 | 44 | 6 |
| B | 26 | 35 | 9 |
Analysis methods
Three aspects of this study made analysis of results more difficult than usual. Firstly, the study is, in terms of the amount of data produced, very large. Several hundred scenarios were played out, each providing information about the relationships between various combinations of core skills, making unaided analysis difficult. Secondly, the analysis was relative in nature. Rather than looking at scenario results from the standpoint of who is winning, we were interested in how tactics were performing in relation to their expected performance. Finally, due to the exploratory nature of this study, mathematically intensive methods were avoided.
Basic performance measurement
The objective of this study was to identify synergies between core skills, instead of simple scenario performance. Therefore, traditional methods such as loss-exchange ratio (LER) become inadequate, as they only analyse individual scenario performance and not relative performance against expectations, as was required. Therefore an alternative measure was developed to meet this need.
Despite the move away from traditional methods, we still required a simple basis to build the relative measurements upon. This basis for performance measurement was decided to be casualty difference (blue casualties subtracted from red casualties), which is deliberately the simplest method available. We can then predict expected casualty difference of more complicated scenarios using the casualty difference of the component tactics that form the scenario. This expected casualty difference was deemed to be the addition of the casualty difference of the component tactics. An example is presented below, with two imaginary base tactics, called A and B.
When played alone against a default red force, the tactics produce the results seen in the above table. Therefore, the expected casualty difference of a force which uses both A and B (call this combined tactic AB) would be (6+9=15). This combined tactic is then also played against a default red force. The casualty difference measured from that scenario has the expected casualty difference subtracted from it to form a measure of synergy of tactics A and B. Therefore, if this AB produces a casualty difference of 17 against a default red force, then the performance of AB becomes (17–15=2).
When playing tactics off against one another, the expectation system works in a similar way, except that tactics given to the red side have the opposite effect on the expected casualty difference of a scenario. Note that when using combined tactics in playoffs, we use the actual casualty difference of the combined tactic in the calculation, instead of the expected casualty difference. By use of an example, we can introduce a third base tactic, called C, whose casualty difference is 5. If we then create a scenario where tactic AB faces C, then expected casualty difference from this scenario becomes (17–5=12). If the actual casualty difference is 8, then we measure the performance of AB against C as (8–12= –4), meaning that C is performing better then expected against AB. We note that in this example, while AB still won the battle, the system rates it badly on the basis that AB was expected to perform better than it did.
These linear methods provided a useable scale for measuring synergies between core skills. However, in some instances they proved to be problematic, particularly when results tended toward the extreme ends of the measurement scale, where forces became so effective that further improvement produced lower payoff results. Also, it is important to note that this method is a measure of synergy, not of particular tactic effectiveness.
Countering graph
To better understand the nature of the countering within the scenarios, a visualisation tool called a Countering Graph was developed. This graph displays the performance of various skill combinations against each other, based on scenario results. The following points explain the graphs in detail.
- Each box is a skill set, represented through a tactic that can be applied to a force in a scenario. The weightings applied to the tactic are displayed within the box.
- Each arrow represents a scenario where the two tactics at the ends of the arrow are played against each other. The “winner” of the battle according to the previously described ratings system points to its opponent. The thickness and colour of the line represent the heaviness of the defeat, though the colours of the lines are somewhat hard to depict in greyscale.
- In order to make the graph cleaner, scenarios with minimal impacts (where results conformed to expectations) were omitted. Each box has text below it noting how many scenarios were culled.
- Line thickness is normalised between 0 and the maximum value within the Countering Graph, which is defined by the heaviest defeat found within the scenario set this Countering Graph represents.
As an example we will analyse one of the lines seen in the example in Figure 2. In one scenario, a tactic with the skill set of (ENG 0.35, DM 0.5, PRO 0.15) faced a tactic with the skill set of (IC 0.1, DM 0.25, MOV 0.65). Based on previous results, the expected casualty difference was 0.13 in favour of the former skill set. Once played in MANA, the actual observed casualty difference was 6.18. Therefore, the performance of the first skill set against the second was (6.18–0.13=6.05), in favour of the former skill set. Therefore, on the graph, we draw a line of moderate thickness between these two skill sets (moderate because the largest defeat within this scenario set is 19.89), with the arrow pointing towards the skill set that performed worse than expected, that being (IC 0.1, DM 0.25, MOV 0.65).
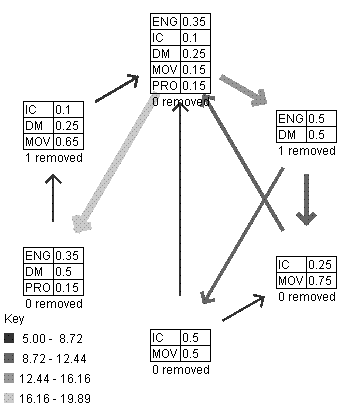
Countering Graphs enabled fast visual inspection of the relationships that exist between the core skills. Figure 2 displays selected results from a particular set of scenarios, where combined tactics are played against each other. This particular graph was of interest as it displayed a cyclic relationship between some sets of core skills.
| ENG | IC | DM | MOV | |
|---|---|---|---|---|
| PRO | 3.15 | –0.29 | 4.40 | –0.16 |
| MOV | –4.62 | 5.48 | –1.18 | |
| DM | 2.89 | 4.29 | ||
| IC | –2.10 |
| ENG | IC | DM | MOV | |
|---|---|---|---|---|
| PRO | 1.58 | –1.70 | –0.51 | –7.33 |
| MOV | –1.54 | –15.58 | –23.46 | |
| DM | 0.23 | –5.00 | ||
| IC | –0.74 |
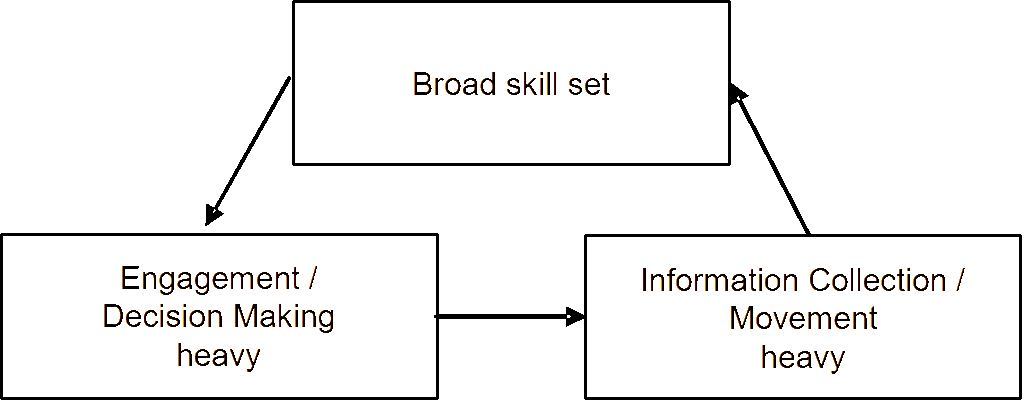
The loop seen in Figure 2 can be condensed down to a simple loop between combinations proficient in Engagement/ Decision Making as superior to those proficient in
Information Collection/Movement that in turn, are superior to a Broad Skill Set, which appears superior to the first combination. This relationship is shown in Figure 3.
There is room here for further investigation into this phenomenon, to determine whether or not it is merely an aberration. This could be in the form of more simulation-based analysis, either through an abstract simulation, higher resolution wargame or a parallel historical study.
Combination matrix
Another analysis method developed was the Combination Matrix. For each combined tactic, pairs of core skills were extracted and rated according to how the tactic performed. The formula used is again simplistic. The combinational strength of a particular pair of core skills is expressed as:
where Ws1 and Ws2 are the weights of a particular skill in the tactic (noting that skills have a weight between 0 and 1 for their presence in a particular tactic), R is the performance of the tactic as measured by the ratings system and n is the number of skills that are more proficient than normal in the tactic. This formula represents how well a core skill combination has performed (the higher the better).
For example, if a tactic comprised three core skills, (for example, MOV 0.5, ENG 0.3, PRO 0.2) and its performance was measured at +5.0, the combinational strength of Movement and Engagement is then:
For Movement and Protection:
And finally for Engagement and Protection:
Note the sum of the values in Equations (2), (3) and (4) add up to the rating provided as input. This is the effect of the (n–1) value, since each skill weight appears (n–1) times.
This breakdown is performed for each scenario in a set of runs, and the results are placed into the appropriate cell of the matrix. Each new value is added onto the total previously present in the cell. The values in Table 2 and Table 3 are the aggregation of 24 scenarios.
The combination matrix enables analysis of any synergies or antagonisms core skills are displaying with each other. The results are presented in table format and Table 2 shows the Combination Matrix computed from playing various combined tactics against a default opponent.
From this table, we see that Decision Making tends to combine rather well with the other core skills, with Movement as the exception. We can also see that Engagement and Movement do not combine well together, but Information Collection and Movement do.
The most interesting result seen from the Combination Matrix technique came when the combined tactics were played in an urban environment. The results from these scenarios generated the Combination Matrix seen in Table 3.
We see that unlike Table 2, movement in Table 3 combines quite badly with most other tactics, figuring in the three worst performing skill combinations (IC/MOV, DM/MOV, PRO/MOV). This is consistent with the theory of urban terrain breaking up a force’s cohesion and organisation. Also, engagement and protection remain relatively unchanged with the introduction of blockage, suggesting that well armed, well protected forces may fare better than others in urban terrain.
Results from these tables must be taken with a certain grain of salt. The process is highly susceptible to contamination from outliers. Despite this, insights such as these may be useful in corroborating other evidence found throughout the study and demonstrating anecdotal evidence.
Discussion
Insights and observations
This study has employed MANA to provide insight to relative worth of AAAS core skills by creating, combining and playing off a range of military tactics. The analysis was based on the assumption that particular core skills were key determinants on a forces ability to perform certain tactics. Hence, the effectiveness of individual or combined tactics against other tactics was used to understand the interplay between AAAS core skills. After performing an extensive study across a large number of scenarios, many insights have emerged. Some examples are provided here.
Engagement and Protection, both by themselves and in combination with each other, provide no significant positive or negative high-payoff on a force. This trend is present throughout the study, including when blockage is introduced. This is traceable back to the AAAS, which surmises that most of the more obvious improvements in Engagement and Protection (weapon lethality, armour protection levels) provide only incremental improvements to a force.
Tactics proficient in Decision Making tend to have a mitigating effect on battles. These tactics do not often suffer catastrophic losses. This is in contradiction to the noted unpredictability of Movement and Decision Making in combination. It appears that while Decision Making in large amounts helps forces not lose battles, in insufficient quantities its effectiveness decreases markedly. Interestingly, forces proficient in Decision Making fighting against each other can have unpredictable results, suggesting the effectiveness of Decision Making is heavily dependent on the context with which it is used.
A cyclic countering effect, or “rock-paper-scissors” effect was noted in the 2v2 playoffs, whereby a broad skill set was defeating Engagement/Decision Making, which defeated Information Collection/Movement, which in turn defeated the broad skill set. This effect was not present in the blockage scenarios, mostly due to the broad skill set attaining a linear performance structure in these scenarios.
Future directions
This research program is relatively new. The study presented here only scratches the surface of what can be analysed. Certainly, the areas of Communications and Sustainment were not looked at in this study, as these core skills require more complex forces than the ones we used for this study. In theory it is possible for MANA to provide the ability to simulate these skills, however, scenarios would have to be more tailored towards bringing these core skills to bear.
This requirement to increase complexity parallels our desire to explore more complex forces. The first iteration of increasing the complexity of the forces should be adding agents possessing long range burst weapons. With a structure such as this, Communications can be brought into play easily. In addition, there are many more possibilities for tactics to be employed to make use of these weapons. Another force structure to look at would be the introduction of small numbers of soldiers possessing superior abilities. This structure could also be used to explore the relative merits of mass, technology, organized structure and military tactics across various contexts.
Enhancements can be made to the analysis methods used. The methods used in this study such as the Countering Graph and Combination Matrix need verification outside of this study. Further work needs to be undertaken focussing on the distribution of results from the replications of the scenarios, especially with respect to drawing parallels to Lanchester models. Also, if more complex force structures are introduced as is suggested above, the analysis methods must also increase in complexity.
The Counter Graphs displayed in this study were all computed after all scenarios were completed. In future, Counter Graphs could be used interactively to guide the user on where to proceed in the problem space. In a study such as this where the number of possible combinations of tactics can reach the thousands, such a tool could greatly speed up the investigation process, showing areas of possible interest and areas where more scenarios need to be played to solidify analysis.
Future studies could also take another approach to the core skills/tactics mapping, where core skills become enablers to various available tactics; so as forces reach thresholds of competency in certain core skills, they gain abilities consistent with these core skills. This method would enable direct manipulation of core skills, allowing for a true parametric study to be conducted. It may also be possible to incorporate human dimensions into these enablers, such as morale, fear and aggression.
Finally, this area of work can be extended to include Game Theory, where the results from studies such as this are used to populate a payoff matrix for choosing strategies.
References
[1] D. Rowland, L. Speight and M. Keys, “Manoeuvre Warfare: Some Conditions Associated with Success at the Operational Level”, Military Operations Research, Vol. 2, No. 3, pp. 5–16, 1996.
[2] L. Speight, D. Rowland, M. Keys, “Manoeuvre Warfare: Force Balance in Relation to Other Factors and to Operational Success”, Military Operations Research, Vol. 3, No. 3, pp. 31–46, 1997.
[3] N. Curtis and P. Dortmans, The Army as a System: A Holistic Description for Technology Requirements and Analysis of Perturbations, DSTO-TR-1537, Defence Science and Technology Organisation, 2003.
[4] N. Curtis and P. Dortmans, “A Dynamic Conceptual Model to Explore Technology-Based Perturbations to a Complex System: the Land Force”, Asia Pacific Journal of Operational Research, (to be published), in print.
[5] M. Lauren, et al, Modelling Precision Manoeuvre using MANA, DTA Report 185, Defence Technology Agency, New Zealand, 2002.
[6] R. Luscombe, H. Mitchard and A. Gill, “Using Agent Based Distillations to Model Human Intangibles for Dismounted Infantry Combat”, Land Warfare Conference 2002, pp. 163–174, 2002.
[7] S. Boswell, N. Curtis, P. Dortmans and N. Tri, “A Parametric Investigation of the Factors that lead to Success in Conflict: Potential Future Warfighting Concepts”, Land Warfare Conference 2003, pp. 369–381, 2003.
[8] D. Galligan, M. Anderson and M. Lauren, MANA Users Manual, Defence Technology Agency, New Zealand, 2004.