
Volume 7, Number 3, November 2004
Blast Loading and Clearing on Tall Buildings
- 1 Engineering Systems Department, Cranfield University, Royal Military College of Science, Swindon, Wiltshire, SN6 8LA, United Kingdom.
- 2 Airfield Engineer, Royal Australian Air Force, Defence Establishment Fairbairn, Canberra, ACT, 2600, Australia.
Abstract
The impulse delivered to the surface of a building by a blast wave travelling perpendicular to the building surface is not usually the fully reflected impulse produced on an infinite surface. Instead, it is lessened by “clearing” as expansion waves propagate inwards from the regions of lower pressure at the building’s edges. The actual time-varying load delivered to any point on the building surface can be approximated by an instantaneous rise to the reflected (or oblique reflected) pressure followed by a positive phase foreshortened by the arrival of the expansion wave. The assumption in this clearing model is that building surface dimensions are similar, ensuring that reflected pressures are achieved across the whole surface parallel to the blast wavefront. For a tall building whose height is considerably greater than its width, expansion waves originating from the sides of the building will propagate inwards and reduce the (oblique) reflected pressure as the blast wave progresses up the building. This paper illustrates the phenomenon of clearing on tall buildings, identifying the key factors that govern the process. Results of numerical simulations are presented, supported by small-scale experiments in which a broad range of important parameters, such as stand-off and building width, were investigated.
Introduction
When a solitary building is loaded by a blast wave generated by a high explosive charge detonated at a relatively large distance from the building and travelling in a direction perpendicular to the front face of the building, the blast wave will have very little curvature. It can be considered to be a plane wave and the whole surface of the building will be subjected to an almost instantaneous rise to the peak reflected overpressure, pr. This “far field” loading is illustrated in Figure 1. If the same building is loaded by a blast wave originating from a much closer detonation, some of the face of the building will be loaded obliquely, and the peak pressure at any given point will be prα, the oblique reflected pressure, which is a function of the incident pressure and the angle of incidence, α. This “near field” loading is illustrated in Figure 2. In both figures, the angle α (measured from the horizontal to the top of the building) is the angle between the ground and the dashed line.
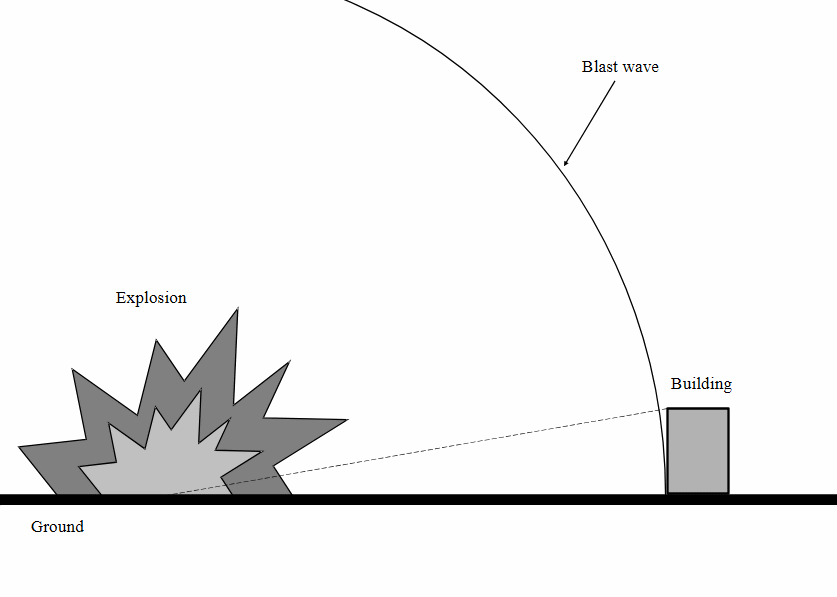
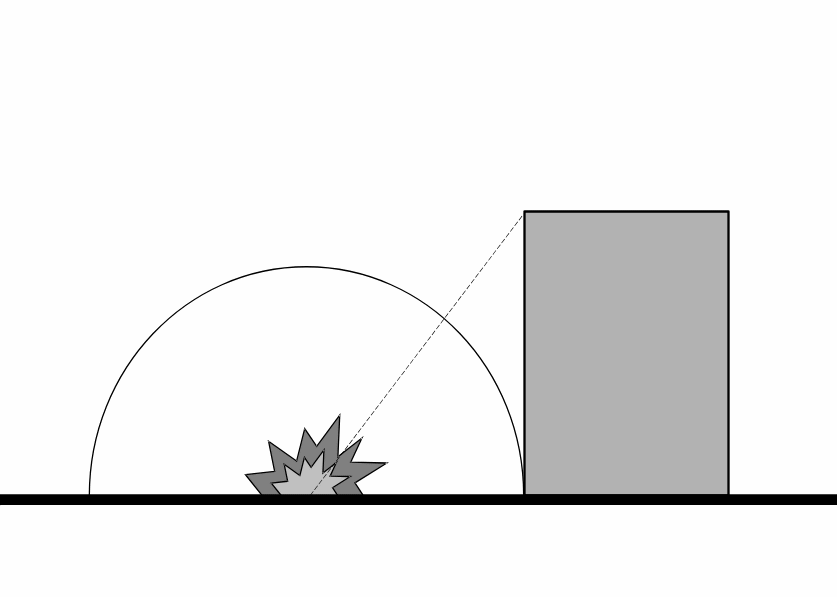
The key features of this scenario are that the buildings are finite and the dimensions (width and height) of the front of the building (facing the blast) are broadly similar. In other words, the dimensions of the building are sufficiently small that the wave does not decay completely before it reaches the edges, and the dimensions are sufficiently similar that expansion waves (producing clearing) occurring at the edges do not progress significantly before the whole of the surface is loaded by the incident wave. This ensures that reflected (or oblique reflected) pressures are achieved across the whole of the face of the building. This process is described as “normal” clearing and can be found in the references below.
A reasonable approximation of the impulse exerted on the surface of a finite building can be calculated from knowledge of the reflected pressure, positive phase duration and the time taken for the expansion waves to traverse the building surface, which is usually expressed as a “clearing time”, tc. Several methods for normal clearing are based on the use of this information, including Glasstone and Dolan [1], TM5-1300 [2] and ConWep [3].
The problem with the methods described in References [1] and [2] is that they rely on the far-field, plane-wave scenario of Figure 1 and only use one value of pr and tc to calculate the average impulse. ConWep [3] calculates many values of prα and so can also treat the near-field problem of Figure 2, although it still only uses a single value of clearing time. Similarly, the extensive range of “clearing factors” developed by Rose and Smith [4] is only valid for buildings with a limited range of height-to-width ratios.
The process of blast wave clearing on tall (or semi-infinite) buildings is not as straightforward as for clearing on finite buildings. When the incident wave first impinges at the base of a tall building, reflected pressure, pr, will be developed. As the wave propagates outwards and upwards, across the face of the building, oblique reflected pressures, prα, are developed. When the wave reaches the sides of the building, expansion waves will propagate back inwards from the edges, reducing the positive phase duration of the reflected wave. This, as described previously, is normal clearing. The new factor that requires consideration, and which separates clearing on tall buildings from clearing on finite buildings, is that, because the buildings are tall, the blast wave takes more time to traverse the building vertically than it takes for the expansion waves to reach the centreline of the building. The result is that the expansion waves reach the head of the (compressive) blast wave and erode the peak pressure so that the full value of prα is no longer developed as the wave propagates up the building.
To summarise, there are three possible situations (and hence loading regimes) arising from the face-on, symmetrical blast loading of tall buildings:
- Peak pressure pr or prα is developed across the whole surface and the expansions from the edges do not have a significant effect before the end of the positive phase of the wave. In this case no clearing occurs.
- Peak pressure is developed and the expansion waves arrive before the end of the positive phase, causing a foreshortening of the positive phase and a reduction in impulse. This is normal clearing.
- Expansion waves propagate through the whole of the positive phase and reduce the peak pressure such that the full value of prα no longer develops. The resulting waves have a reduced positive phase and significantly lower impulse. This only occurs on tall buildings or other semi-infinite structures.
Because of this last loading situation, existing procedures (such as described in References [1–4]) are unsuited to the establishment of loads on very tall buildings, and a different approach is required. This paper describes a numerical investigation, supported by a programme of small-scale physical experiments, which has sought to demonstrate the phenomenon of blast wave clearing on tall buildings and to identify the factors of importance in controlling the process.
Matrix of numerical experiments
A series of numerical simulations was conducted using the blast computation code Air3d [5]. These simulations used an effectively infinitely tall building and varied the scaled building width and scaled charge stand-off in a systematic way, as described below.
A hemispherical TNT charge of 1-kg mass was used in all the simulations. The scaled stand-off distances, Z=R/W1/3, were 0.5, 2.0, and 8.0 m/kg1/3, where R (m) is the horizontal distance from the charge to the front of the building and W is the charge mass (kg of TNT). The scaled building widths w/W1/3 were 0.5, 1.0 and 2.0 m/kg1/3, where w (m) is the building width. These ranges of scaled dimensions were selected to represent most cases of practical interest.
In each of the simulations, a large grid of measuring points was established so that the variation of pressure and impulse could be evaluated across the whole of the front face of the building. These measuring points extended to a scaled height h/W1/3=5.0 m/kg1/3 up the building, where h (m) is the distance measured up the face of the building from the ground, and the buildings themselves extended to the top of the computational domain boundary at 6.0 m/kg1/3. One further analysis was conducted at each scaled stand-off distance. This contained an infinitely large building (approximated by the domain boundary). Again, an array of monitoring points, arranged vertically along the centreline of the building, provided information for comparison with the remaining buildings of finite width. There were 12 simulations in the matrix of numerical experiments, and the three-dimensional scaled cell size was 25.0×10⁻³ m/kg1/3, corresponding to an actual cell size of 25 mm.
Results
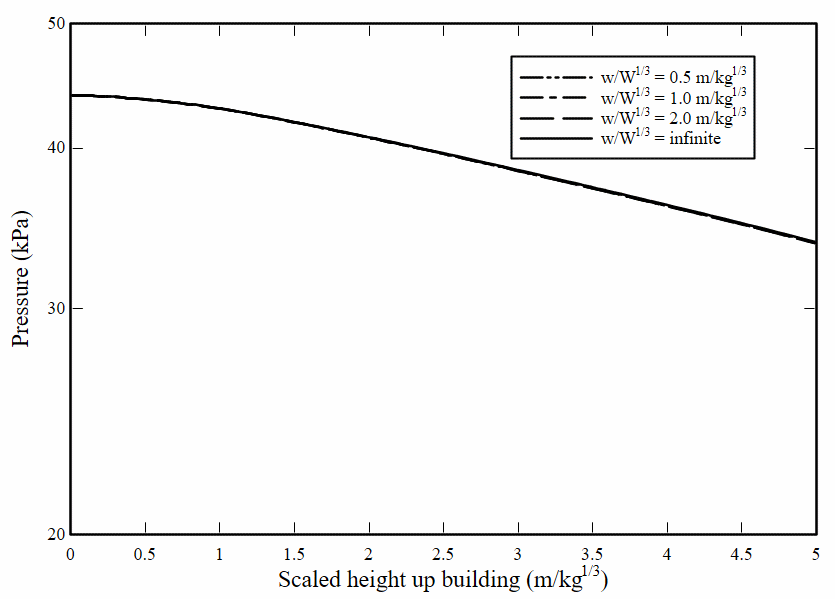
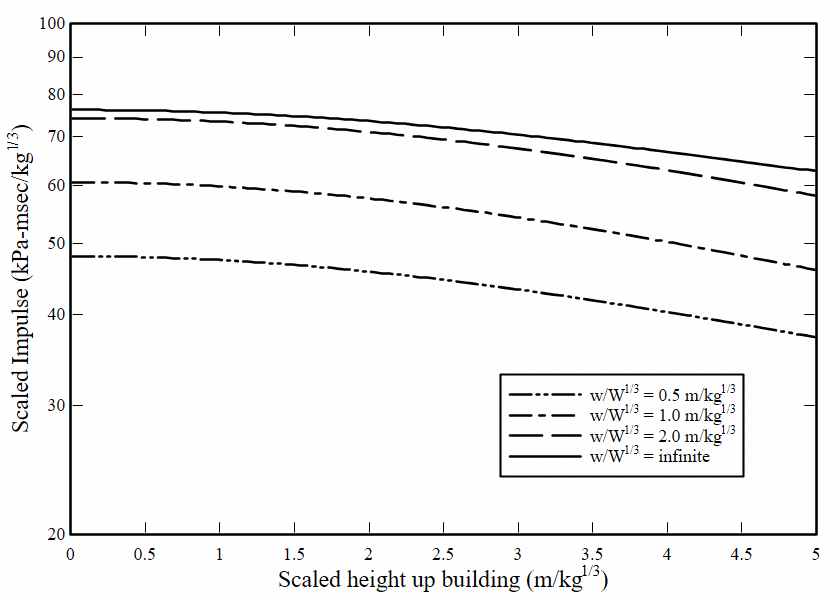
The main results from the series of numerical simulations are illustrated by Figures 3 to 8. These figures show peak pressure and peak scaled positive impulse data plotted against scaled height up the centreline of the buildings at each of the scaled stand-off distances investigated. Each figure contains data for the three scaled building widths, w/W1/3, as well as for the infinitely wide building. Therefore, the peak pressures represented by the infinite curves are pr or prα, and the impulses are the full values ir or irα, depending on the angle of incidence. The infinite curves provide a useful comparison, because deviation from these curves by the data from the buildings of finite width graphically illustrates the extent of clearing and the erosion of peak pressure.
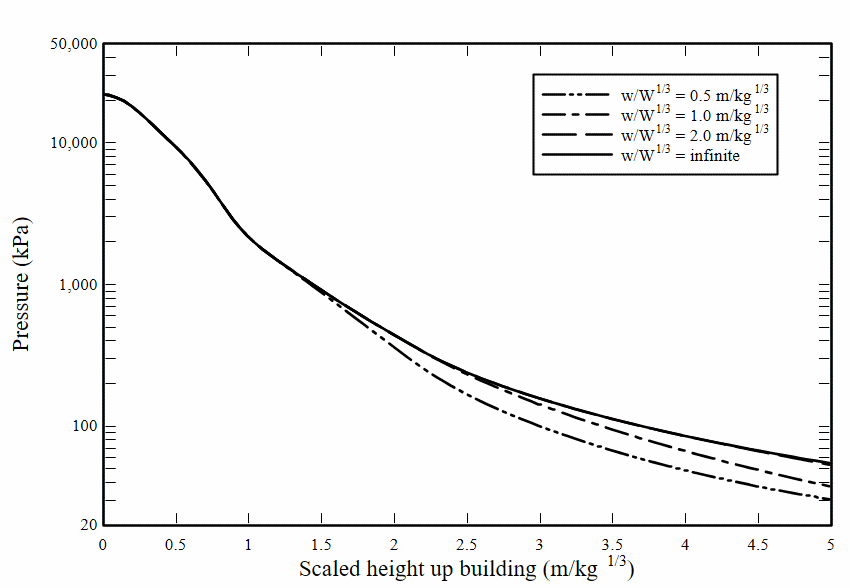
Each of the curves comprises data from a large number of points, and because the variation of pressure and impulse is assumed to be continuous, the points are joined by short straight lines to produce the smooth curves in Figures 3 to 8. There are a number of key points illustrated by the figures:
- In each of the peak pressure graphs (Figures 3, 5 and 7) there is a region where all four curves are coincident. As the scaled stand-off increases the length of this region increases until at Z = 8.0 m/kg1/3 (Figure 7) the incident wave is sufficiently plane that the whole of the surface is loaded almost simultaneously and all the pressure curves are coincident at the full scaled height considered (5.0 m/kg1/3), and pr or prα is developed everywhere on the centreline of the buildings. Therefore, Figure 7 is the limiting case where normal clearing can be said to have occurred. The importance of the part of the Figures 3 and 5, where peak pressures are below pr or prα is that the pressure has been eroded by the arrival of the expansion waves at the centreline of the building. It is this situation which never occurs in normal clearing.
- Figures 3 and 4 show pressure and impulse data for Z = 0.5 m/kg1/3, the smallest stand-off considered. It is clear from Figure 4 that clearing has started to occur on the w/W1/3=0.5 m/kg1/3 building at a scaled height of about 0.8 m/kg1/3, and it is clear from Figure 3 that, for this building, the expansion wave reaches the head of the compressive blast wave at the centreline at a scaled height of about 1.4 m/kg1/3. This is where the curve deviates
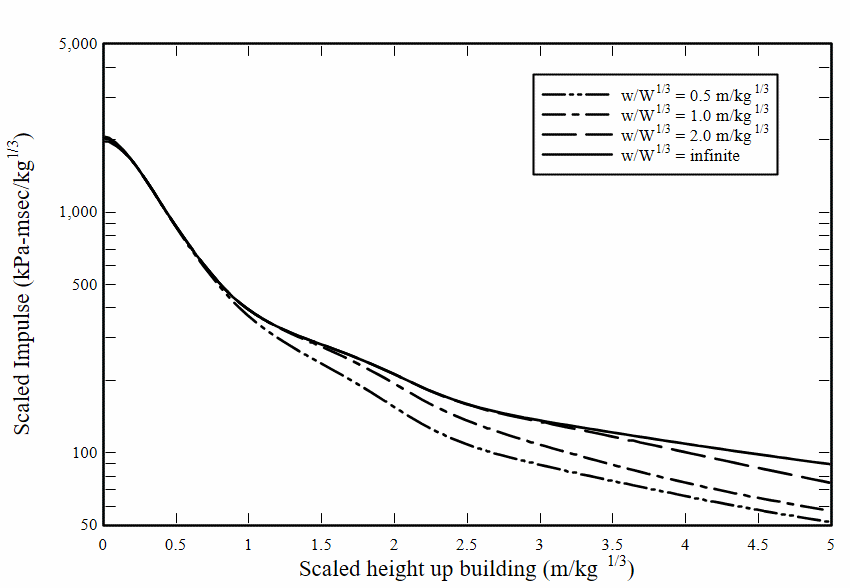
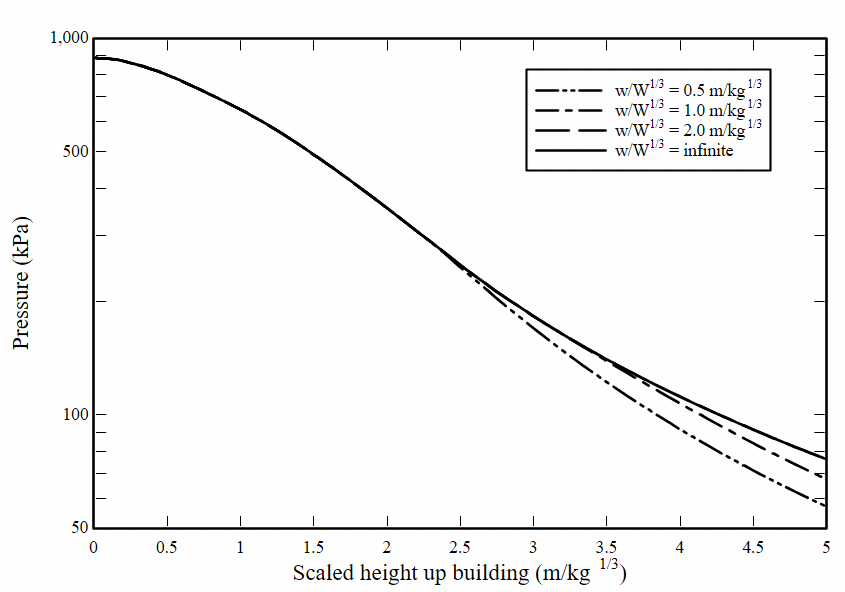
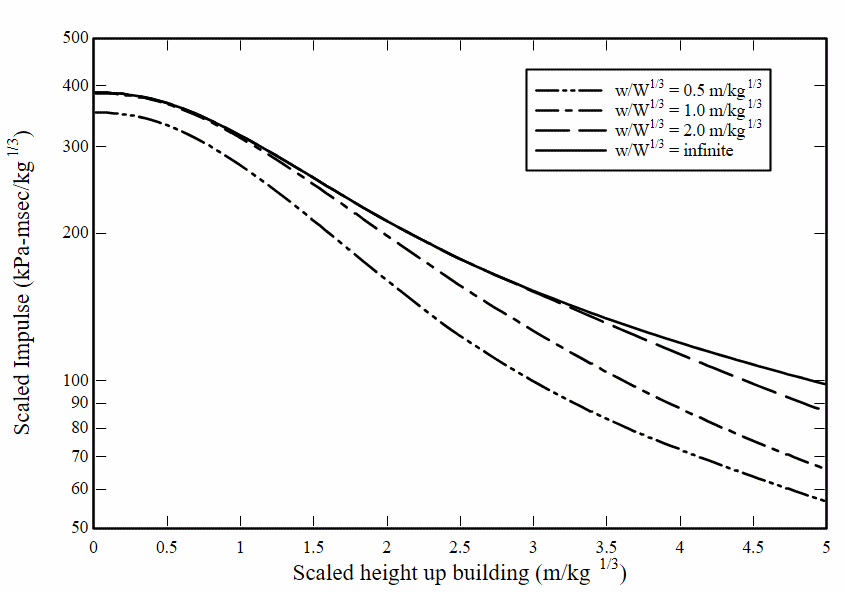
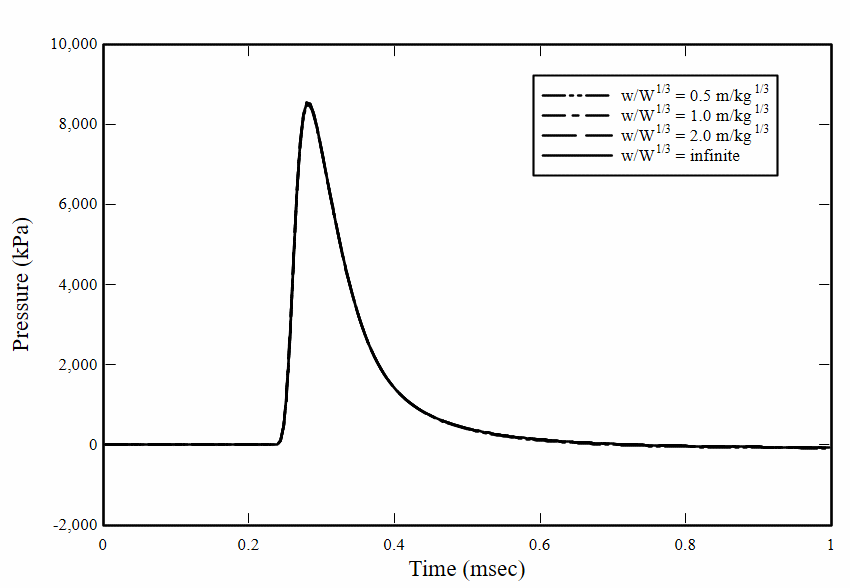
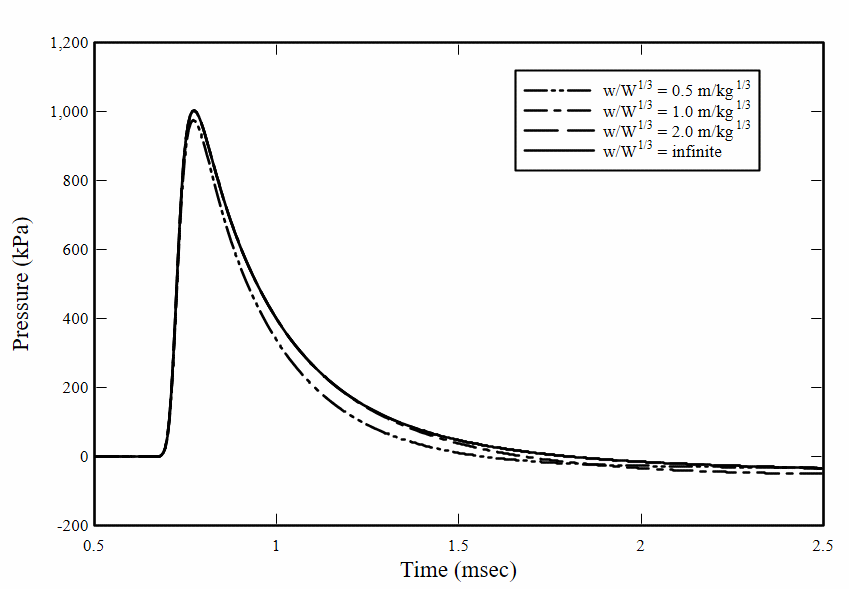
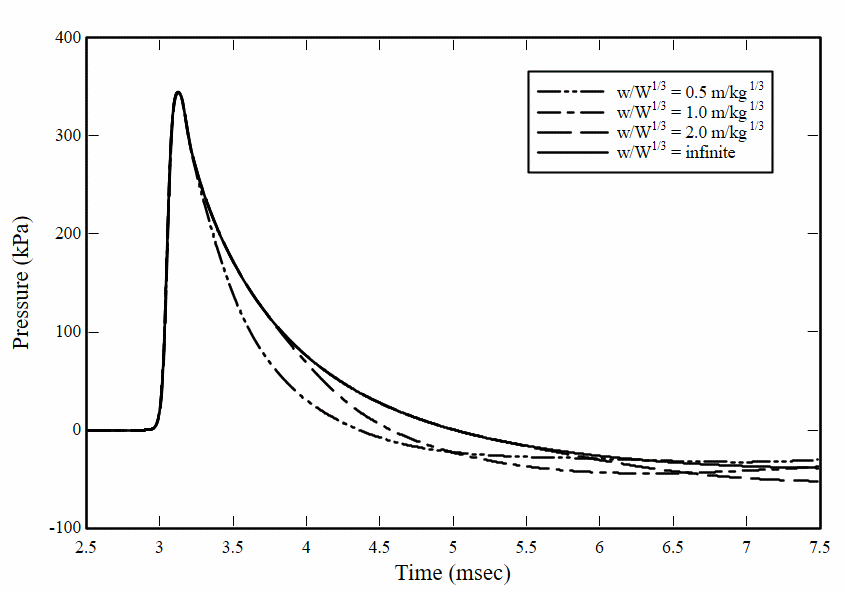
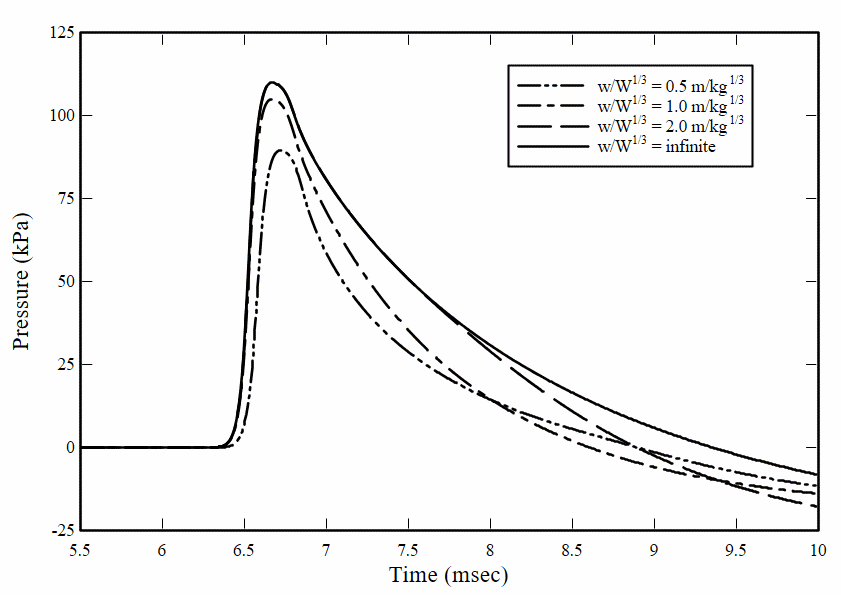
- from the infinite-width curve. Therefore, below a scaled height of about 0.8 m/kg1/3, no clearing occurs at the centreline of the w/W1/3=0.5 m/kg1/3 building. Between 0.8 m/kg1/3 and 1.4 m/kg1/3 normal clearing occurs, and beyond 1.4 m/kg1/3 both impulse and pressure are eroded. These points are illustrated in Figures 9 to 11 which show pressure-time histories at scaled heights of 0.5, 1.4 and 4.0 m/kg1/3 up the centreline of the building, for each of the scaled building widths. It will be observed that in Figure 9 the curves are coincident, because no expansions have arrived, and no clearing has occurred. In Figure 10, at scaled height of 1.4 m/kg1/3, it can be seen that the peak pressures are still essentially the same, but clearing is evident on the curve for w/W1/3=0.5 m/kg1/3. Finally, in Figure 11, pressures and positive phase durations have been eroded for w/W1/3=0.5 and 1.0 m/kg1/3, but the peak pressure is still retained at the centreline for w/W1/3=2.0 m/kg1/3.
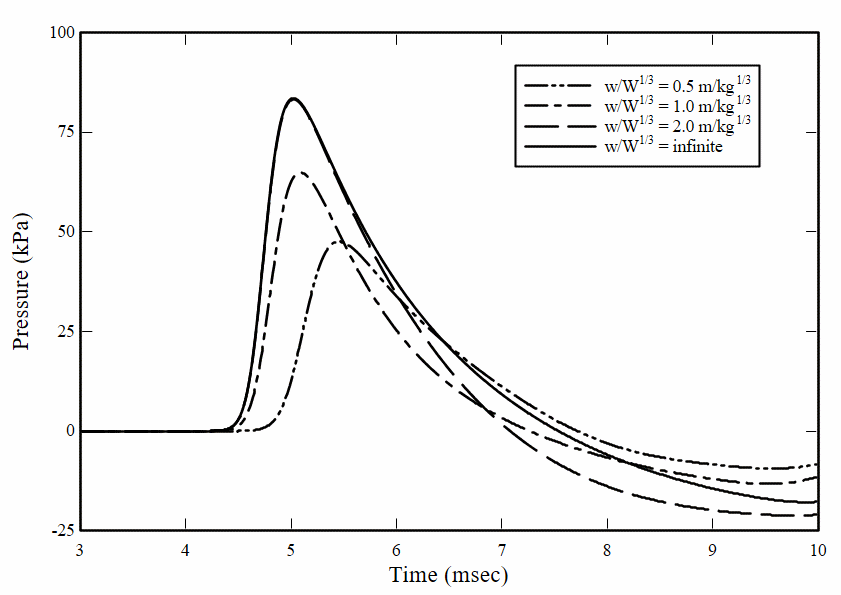
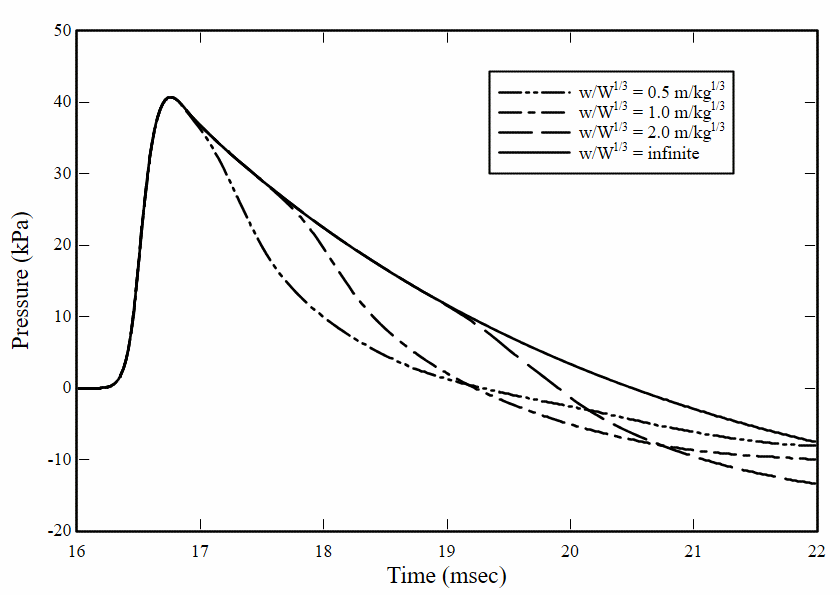
- It can be seen from Figure 6, for Z=2.0 m/kg1/3, that the curve for w/W1/3=0.5 m/kg1/3 is separate from the infinite width curve over the whole building height considered. This indicates that clearing has occurred everywhere on the building front for w/W1/3=0.5 m/kg1/3. There is no longer a region where no clearing occurs, and this can be seen from the two sets of pressure-time histories shown in Figures 12 and 13 for h/W1/3=2.0 m/kg1/3 and h/W1/3=4.0 m/kg1/3, respectively. The data in Figure 12 was extracted at a height where the peak pressures are the same, regardless of scaled width, which is similar to Figure 10. Figure 13, however, contains data from a scaled height beyond where all the curves for finite building widths have separated. The curves for the remaining two scaled building widths, w/W1/3=1.0 m/kg1/3 and 2.0 m/kg1/3, depart from the infinite-width curve higher up the building, at h/W1/3≈1.5 m/kg1/3 and h/W1/3≈3.0 m/kg1/3, respectively, as the expansion waves take longer to traverse the wider buildings.
- Finally, it can be observed in Figure 7 that all the pressure curves are coincident, as the angle of incidence is relatively small everywhere on the building when the scaled charge stand-off Z=8.0 m/kg1/3. Figure 8 shows that clearing has affected all the finite-width buildings, and this is illustrated in Figure 14 by the pressure-time data at scaled height 2.0 m/kg1/3. This figure demonstrates the kind of normal clearing found in the literature, and the same pattern as Figure 14 would be repeated if pressure-time data were extracted at any scaled height (up to the maximum considered).
Small-scale experiments: comparison with air3d and CONWEP
A short series of small-scale experiments was performed to confirm that use of the blast computation tool Air3d [5] was appropriate for the investigation of the clearing process and to demonstrate the potential conservatism of conventional methods such as in ConWep [3].
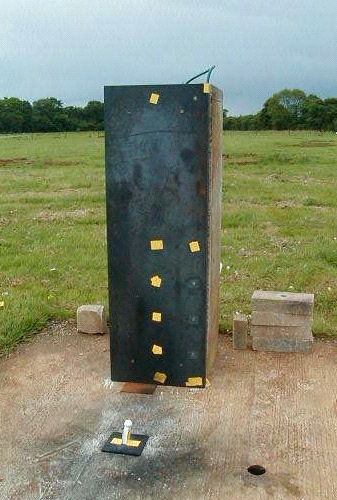
The experiments used a large concrete block with base dimensions 610×610 mm and height 1 830 mm to model a solitary tall building. A steel plate, 6-mm thick, designed to cover the entire face of the block and held at a distance of 50mm from the concrete surface, contained mounts for pressure transducers and provided protection for cabling. The charges comprised 50g PE4, which, assuming a TNT equivalence of 1.32 and a charge mass equivalent to 1.4g TNT for the L2A1 detonator, gives an equivalent TNT charge of 67.4g. The charges were spherical and mounted on a small, light-weight polystyrene block prior to detonation; the centre of the charge was 120mm above the ground.
Pressure transducers were distributed in two vertical arrays at heights 50, 225, 450, 675, 900 and 1 750 mm up the centreline of the structure and close to one edge. These heights were selected (based on preliminary Air3d [5] calculations) to allow a broad spread of peak pressures to be measured at short charge stand-off distances. The charge stand-off distances were 500 mm, 750 mm, 1 000 mm and 1 500 mm. The experimental arrangement is shown in Figure 15.
Recording equipment comprised Kistler 603B and 6031 piezoelectric quartz pressure transducers, a Kistler 7017B multi-channel charge amplifier and a Nicolet 420 Pro Digital Storage Oscilloscope.
Because the experiments were performed before the main matrix of numerical simulations was complete and because the choice of target structure design was subject to some constraints, the target was a little too wide to demonstrate all three loading regimes. The result of this deficiency was that oblique reflected pressures were not reduced by the process described above in any of the experiments. Therefore, only the regimes where no clearing occurs at the centreline and where normal clearing occurs, can be demonstrated by the experiments.
Results from numerical simulation of the test matrix were in broad agreement with the experimental data, and to demonstrate this, two representative examples of pressure-time histories, extracted from the test matrix, are shown in Figures 16 and 17. These are from the centreline transducer located at a height 1 750 mm above the ground, for charge stand-offs 500 mm and 1 500 mm respectively. The results of Air3d [5] simulations using a three-dimensional cell size of 10 mm are also superimposed on these figures.
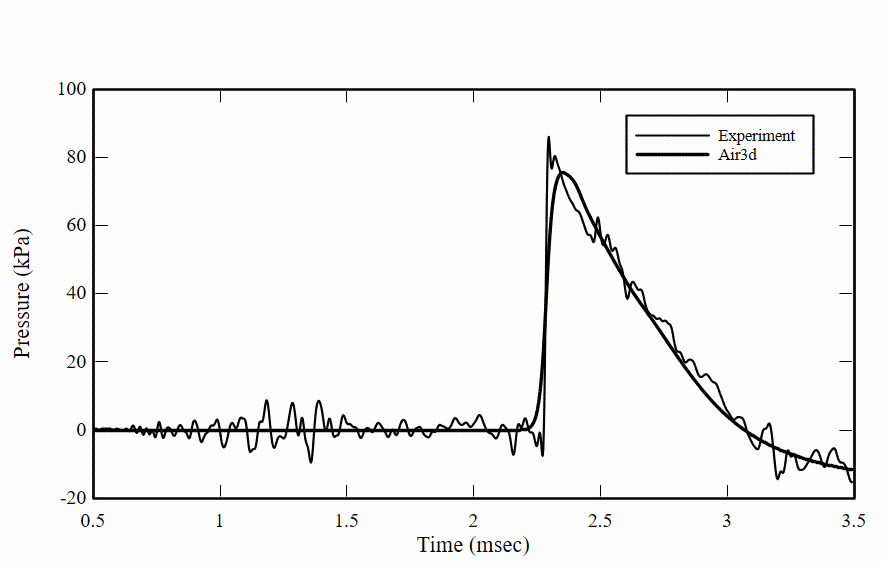
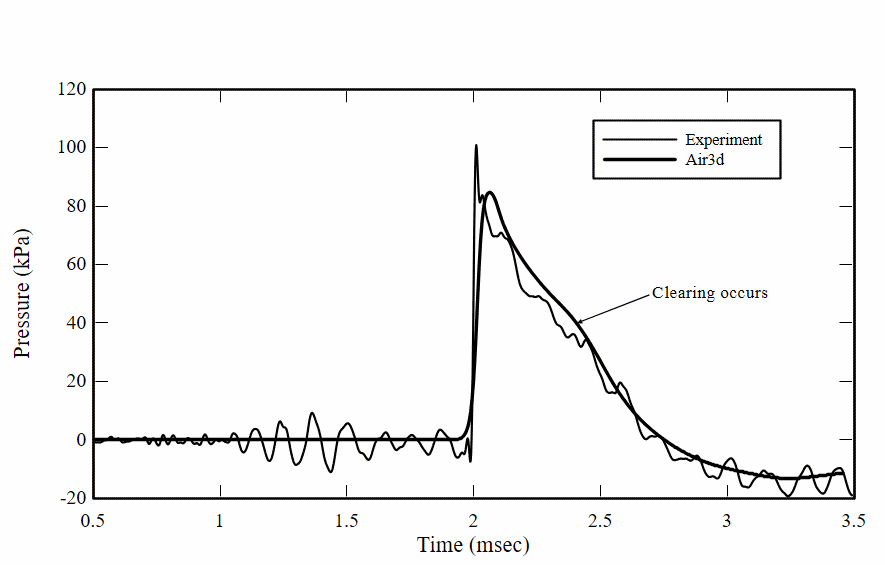
It can be observed in Figures 16 and 17 that there are strong oscillations superimposed on the experimental pressure records. These were caused by motion of the thick steel plate which was insufficiently damped. Because of these oscillations, the experimental pressure records have been filtered, using a simple linear filter, to remove much of the unwanted noise. They do, however, still exhibit oscillations, a feature which will tend to increase the peak pressure somewhat.
In Figure 16 no clearing is evident; in Figure 17 normal clearing is indicated at the arrival of the expansion. The oblique reflected pressures and impulses extracted from these two examples, together with comparable data from ConWep [3], are contained in Table 1.
It would be expected that the values of peak pressure from each of the methods would be similar. The experimental values could be expected to be slightly high (for the reason mentioned above), the Air3d [5] values could be expected to be slightly low (because of the coarseness of the computational grid) but the ConWep [3] values should be very reliable, as they are based on well-established data. These trends are observed in the results.
The impulses from all three sources should, in principle, be the same, because the factors, noted above, should not affect the impulse to a significant extent. It can be observed, however, that, compared with the experimental and Air3d [5] values, the ConWep [3] impulses are noticeably higher, and it could be expected that in the regime where oblique reflected pressure is reduced the ConWep [3] values might be extremely over-conservative.
The above discussion clearly demonstrates that the blast load—in terms of peak pressure and positive impulse—experienced at a location on a tall building is affected by the scaled stand-off, the scaled width of the building and the scaled height of the location considered. Potential benefit from this information could be realised if, for example, the glazing, or other façade material, of a building were to be designed for blast-resistance. The conventional methods [1]—[4], described previously, might provide loads which could lead to an over-conservative design, and in the case of a very slender building (in scaled width terms) the design load could be significantly in error at higher regions of the building. This inappropriate use of existing methods could have considerable implications for the cost of the resulting building.
Conclusions
It has been demonstrated that the distribution of blast loads on symmetrically loaded tall buildings is different from the distribution of loads on buildings whose dimensions are broadly similar. This difference can be attributed to the fact that expansion waves propagating inwards from the edge of tall buildings reach the centreline before every part of the building has been loaded. The resulting decrease in peak pressure, to a value below the expected value, prα, implies that existing methods for calculating the load on buildings of roughly cuboid geometry might not be accurate and could give rise to over-conservative results.
It should be recognised that the information provided by this study is not complete. A more complete matrix of scaled parameters could provide practical information that was even more useful to investigators and designers, such as the height at which the onset of pressure reduction occurs.
The data could also be improved in terms of computational resolution. Simple comparison of the peak pressure data in this paper with ConWep [3], reveal that analyses presented here could be usefully recalculated using finer meshes. However, despite this short-coming, the differences in the clearing processes that occur on tall buildings compared with those whose breadth and height are similar have been demonstrated. The result indicates that application of existing methods could result in the overdesign of façade elements.
| Stand-off R = 500 mm | Stand-off R = 1 500 mm | |||
|---|---|---|---|---|
| Pressure (kPa) | Impulse (kPa-msec) | Pressure (kPa) | Impulse (kPa-msec) | |
| Experiment | 86.0 | 30.8 | 100.9 | 27.4 |
| Air3d | 75.4 | 29.2 | 84.6 | 30.6 |
| ConWep | 81.3 | 34.3 | 93.7 | 36.2 |
References
[1] S. Glasstone, and P. Dolan, The Effects of Nuclear Weapons, United States Department of Defense and United States Department of Energy, 1977.
[2] Design of Structures to Resist the Effects of Accidental Explosions, United States Department of the Army Technical Manual TM 5-1300, 1991.
[3] D. Hyde, ConWep—Conventional Weapons Effects, Department of the Army, Waterways Experiment Station, US Army Corps of Engineers, PO Box 631, Vicksburg, Mississippi 39180-0631, 1992.
[4] T. Rose and P. Smith, “An Approach to the Problem of Blast Wave Clearing on Finite Structures Using Empirical Procedures Based on Numerical Simulations”, 16th International Symposium on Military Aspects of Blast and Shock, Oxford, UK, 2000.
[5] T. Rose, An Approach to the Evaluation of Blast Loads on Finite and Semi-infinite Structures, PhD Thesis, Engineering Systems Department, Cranfield University, 2001.
FLTLT Terry McLennan is currently an Airfield Engineer with the Royal Australian Air Force in Canberra with responsibility for conducting conventional weapons effectiveness assessments and providing advice on protective structures. He is a graduate of No 17 MSc WES. Email: Terry.McLennan@defence.gov.au,Tel:02.61276113