
Volume 7, Number 2, July 2004
Modelling the Performance of an Airborne Forward-Looking Infrared System in the Australian Environment
Abstract
Prediction of the operational performance of a forward-looking infrared (FLIR) system requires a computer model accounting for the principal variables affecting classification range. The range performance is degraded by many factors, including sensor resolution, atmospheric attenuation, platform vibration and visual display information. The Tenix FLIR_P Performance Model was developed to estimate the classification range of an electro-optic sensor, and provides comparative performance estimates for different system configurations and operational conditions. Results are presented for classification range prediction and its variation with absolute humidity in the 3-5 m infrared band as used in some airborne thermal imaging systems.
Introduction
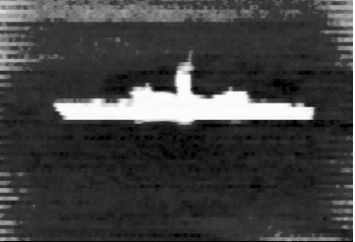
One measure of system performance for an airborne electro-optical sensor is the classification range (that is, the maximum range for target recognition). The forward looking infrared (FLIR) sensor mounted on the upgraded S-70B-2 maritime helicopter is affected by such variables as the field-of-view, infrared atmospheric transmittance, object size and intensity, and line-of-site (LOS) stabilisation. Figure 1 shows an example of a FLIR image of a ship taken from a low-flying helicopter. Contrast has been enhanced by dynamic range expansion resulting from increasing the range in the grey-level histogram. In the S-70B-2 helicopter the FLIR system is located under the nose cone and controlled from within the cockpit.
Prediction of classification range from computer modelling enables cost-effective comparisons of various system configurations and, in particular, the assessment of visual display size, viewing distance, vibration or jitter, atmospheric conditions and observer/eye optical performance variations [1-3].
FLIR performance model
A single field trial is a spot measurement taken under a unique set of conditions. The question arises as to how typical and how reproducible are the results from a single field trial? Transmittance can vary hourly and daily. In a sea trial, parallel lines-of-sight separated by only a few hundred metres can be subject to different meteorological conditions [2]. Computer modelling can be used to explore a matrix of scenarios and test the operational envelope, with perhaps many hundreds of different experiments. Modelling is very cost-effective compared with flight trials and supports comparative performance studies to evaluate system design changes. It can be used to estimate performance under a range of conditions and facilitates “what if?” analysis. The computer model used should conform to internationally accepted methodology or performance frameworks, such as the US Defence FLIR92 standard [2].
The main applications of the Tenix FLIR_P Model are (a) prediction of classification range of a FLIR system or thermal imager and (b) provision of performance comparisons for a variety of system configurations and environmental conditions. It is consistent with FLIR92 and NVTHERM framework used by US Defense Department [3].
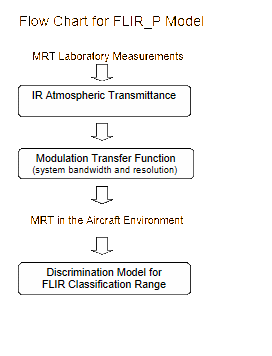
The Tenix FLIR_P Model first converts laboratory MRT measurements (minimum resolvable temperature difference between object and background) to MRT in the aircraft environment and then computes FLIR classification range (Figure 2). The MRT values in the aircraft environment have been ‘degraded’ by atmospheric and system variables, such as the effect of atmospheric absorption and scattering on IR transmittance.
The spatial frequency attenuation for the system and its discrete components are modelled by the modulation transfer function (MTF), which correlates with the level of information available on the visual display [4–6]. It measures signal bandwidth and resolution loss due to FLIR system components and platform vibration.
Once the MRT laboratory measurements have been converted to MRT values for the aircraft environment (using the MTF), the FLIR classification range is calculated by the third component of the FLIR_P Model, which is based on use of target resolution parameters analogous to the original Johnson criteria [8]. This approach specifies target discrimination by increasing levels of target resolution (see p. 387 in [2] and pp. 11–14 in [3]):
- Detection—for presence of object.
- Recognition—for class of object (for example, a ship).
- Identification—for type of object within the class (for example, RN Type 42 Destroyer).
The discrimination criterion is the minimum number of cycles across the critical dimension of the target for identification. For example, this may be equivalent to eight cycles across the standard Air Force four-bar resolution chart for just noticeable discrimination (JND). Further details can be found in the literature [1–4]. The approach used is applicable to raster-based television and thermal imaging systems.
The software consists of compiled Visual Basic procedures with an Excel spreadsheet interface. The model is fully self-contained, has code that is modular and portable, and generic syntax is used for subroutines (to allow for conversion to Matlab or C/C++ languages, if desired).
Atmospheric transmittance
The FLIR_P model currently uses the LOWTRAN model as the source of atmospheric propagation data. This model has been used widely in the past as a predictor of infrared transmittance [2]. Our modelling at Tenix has involved analysis of airborne FLIR systems at mainly low and medium altitudes. The advantages of LOWTRAN are that it can provide good mean-field approximations (for standard scenarios), it can be integrated with existing modelling software, and the fidelity is suitable for computer simulations. A disadvantage is that specific trending of isolated parameters requires further mathematical analysis.
The atmospheric module used in the FLIR_P Model, at the time of writing (and subject to a planned upgrade), is based on an atlas of atmospheric data [4] analysed and stored as a look-up table of equation coefficients in Visual Basic. The estimated transmittance is derived from a large matrix of experimental conditions computed from LOWTRAN5.
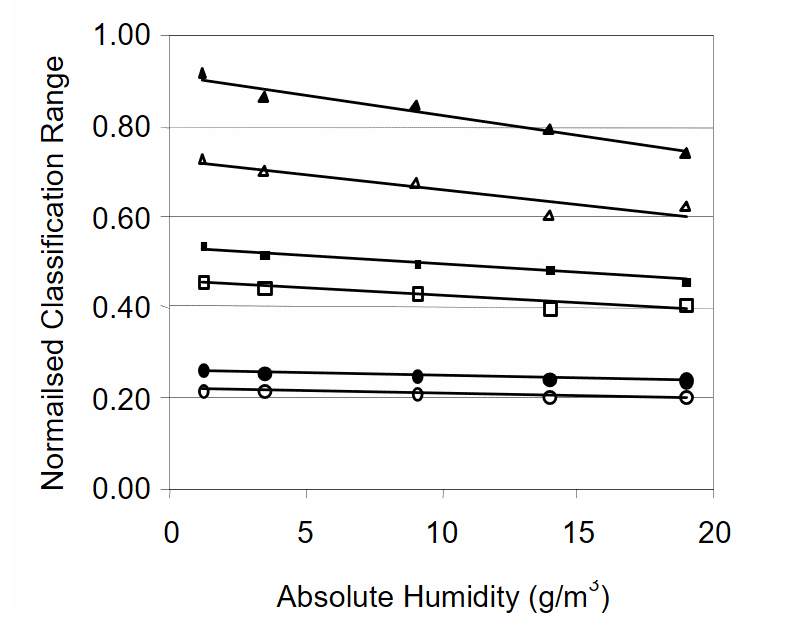
Comparison of LOWTRAN5 with LOWTRAN7 (the latest version) for low to medium altitudes, reveals errors of about 8% with a correlation coefficient of 0.997. Experiments show that, under most operational conditions, both versions yield very similar IR transmittance results. The LOWTRAN5 data allows the IR transmittance to be computed in a single subroutine in real-time from input data (Figure 3).
Effect of absolute humidity
In the maritime environment, the 3–5 micron wavelength band is frequently used for detection. In this window, CO2 is the dominant absorber. In the case of the alternative 8–12 micron band often used with land-based thermal imagers, the dominant absorber is H2O.
Absolute humidity is a variable with significant influence on infrared transmittance and absorption, and is a function of both relative humidity and temperature. Variations in temperature and humidity can be due to:
- Seasonal effects (such as, summer or winter).
- Land or sea location (aerosol composition).
- Altitude (such as turbulence).
- Time of day (such as, morning or evening).
- Wind direction (such as, from sea or land).
The 3-5 micron band is normally selected for use in maritime and tropical environments because of the higher levels of water vapour (H2O) present in the atmosphere. The corollary to this is that this detection window is much less affected by changes in absolute humidity (which is the objective measure of water vapour content). Range performance is approximately related to absolute humidity (inverse linear), for a given aerosol type and concentration [2]. Table 1 shows representative values of the possible extremes in absolute humidity around Australia.
Absolute humidity in winter falls in the range 8–14 g/m3 compared with 11–22 g/m3 in mid-summer. The maximum regional absolute humidity is about 22 g/m3 in January (Darwin). Figure 3 shows the variation of normalised classification range with absolute humidity for low to medium altitudes and for a variety of target objects. In Figure 3, LOWTRAN5 results for standard atmospheric models, representing environments ranging from sub-arctic to tropical, were used to compute classification ranges.
The results in Figure 3 reveal only relatively small changes in FLIR classification range for variations in absolute humidity typical of regional coastal locations around Australia.
System frequency response
The MTF is the spatial frequency response of the imaging system, as defined in optical physics and linear systems theory [4,5]
.

The MTF represents the spatial frequency bandwidth passed by the system and is a strong determinant of the FLIR classification range because it has a direct influence on the visual discrimination of information on display [6,7]. The FLIR_P software package allows for the introduction of additional MTF models and provides comparative performance estimates for different system configurations and operational conditions.
In Figure 4, results are shown for the relative effects of various system elements on the total system MTF. The figure shows that the signal degradation due to the monitor in the cockpit is not significant at low spatial frequencies and, in general, monitor bandwidth and resolution is not a problem.
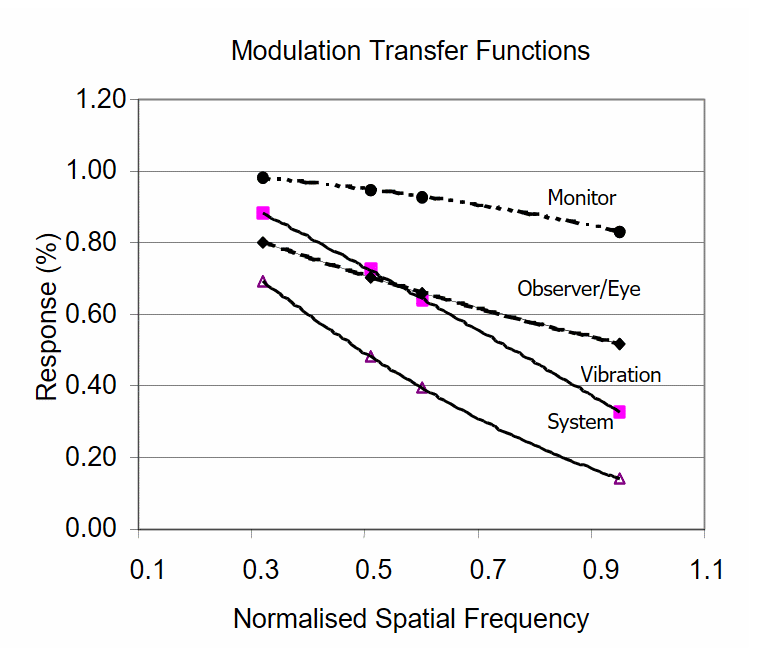
At high spatial frequencies, the effect of platform vibration is an important component of the total system response. This effect is perceived as blurring of fine detail in the visual display and has more impact on recognition rather than detection. The effect of platform vibration has also been studied elsewhere [8], and its importance revealed through various experiments in visual discrimination [3].
Discussion and summary
The FLIR_P Model is a diagnostic tool developed for the assessment of the factors and components that contribute to FLIR system performance under different operational conditions.
Classification range of an airborne FLIR system is very dependent on the IR atmospheric propagation and the system spatial frequency response. In the case of the 3–5 micron band, where CO2 is the dominant absorber, changes in absolute humidity due to climate have little impact on the classification range. Although, in this case, the classification range varies only slightly with absolute humidity, it can still be quantified, as shown by Figure 3.
The system spatial frequency response is represented by the MTF and the principal components affecting FLIR classification range are the observer/display interaction and platform vibration (Figure 4). MTF curves facilitate performance comparisons under a range of conditions, including different levels of jitter, different monitor sizes and specifications, and changing viewing distances (important factors in the case of cockpit layout design).
Acknowledgements
The author is indebted to Mr Paul Henderson and Mr Orhan Soylemez from the Tenix Defence Aerospace Division for advice and information. Mr Don Dryley, also of the Aerospace Division, provided enlightening discussions on the effect of atmospheric absorption on the IR transmittance.
References
[1] G. Holst, Testing and Evaluation of Infrared Imaging Systems, SPIE, Bellingham, WA (USA), 1998.
[2] G. Holst, Electro-Optical Imaging System Performance, SPIE, Bellingham, WA (USA), 2000.
[3] L. Biberman, (ed), Electro-Optical Imaging: System Performance and Modelling, SPIE, Bellingham, WA (USA), 2000.
[4] D. Shumaker, J. Wood and C. Thacker, FLIR Performance Handbook, DCS Corporation, Alexandria, Virginia, 1988.
[5] K. Benke and B. McKellar, “Modulation Transfer Function of Photographic Emulsion: The Small-Angle Approximation in Radiative Transfer Theory”, Applied Optics, Vol. 29, pp. 151–156, 1990.
[6] K.K. Benke, D. Cox and D.R. Skinner, “A Study of the Effect of Image Quality on Texture Energy Measures”, Measurement Science and Technology”, Vol. 5, pp. 400–407, 1994.
[7] J. Johnson, “Analysis of Image Forming Systems”, Proc. of the Image Intensifier Symposium, US Army Engineering Research Development Laboratories, Fort Belvoir, Viginia, pp. 249–273, October 1958.
[8] O. Hadar, M. Fisher, and N. Kopeika, “Numerical Calculation of Image Motion and Vibration Modulation Transfer Function”, SPIE Vol. 1482: Acquisition, Tracking and Pointing, pp. 79–91, 1991.