
Volume 7, Number 1, March 2004
A Brief Investigation into the Effect on Suspension Motions of High Unsprung Mass
- 1 Both authors are with: Engineering Systems Department, Royal Military College of Science, Shrivenham, Swindon, Wiltshire, SN6 8LA, United Kingdom.
Abstract
Many military vehicles are being developed which use a hybrid electric drive system. Of these, a number utilise drive motors mounted within some or all of the road wheels. Of necessity these wheel-motor assemblies are somewhat heavier than the similar, existing, conventional road wheels. This extra mass has implications for both the ride within the vehicle and the design of the suspension-wheel-motor system. This paper looks at the implications of the extra mass within the wheel assembly as it increases the unsprung mass of the vehicle. Linear and non-linear single-wheel station models have been developed in order to quantify the effects of the modified design. A range of sprung-to-unsprung mass ratios have been analysed using the models. The behaviour of the vehicle at a range of speeds and different obstacles has been simulated. The results show the predicted accelerations and vibration dose value (VDV) vary with both speed and sprung-to-unsprung mass ratio. The behaviour of the suspensions for the random ride and step impact conditions show that the ride quality and acceleration levels deteriorate with vehicle speed. For the pothole simulation, however, the higher unsprung mass conditions show an improvement in some aspects as speeds increase, because the wheel effectively ‘skips over’ the pothole and the resultant impact is reduced.
Nomenclature
| A | System matrix |
|---|---|
| A | Terrain roughness |
| B | Input matrix |
| C | Output matrix |
| c | Damping coefficient |
| D | Transmission matrix |
| k | Stiffness |
| n | Terrain index |
| R | Radius |
| S | Power spectral density |
| u | Input vector |
| x | State vector |
| y | Output vector |
| µ | Unsprung-to-sprung mass ratio (MR) |
| ω | Frequency |
| ψ | Spatial frequency |
| ζ | Damping ratio |
| Subscript | |
| e | Element |
| g | Ground |
| i | Inner |
| o | Outer |
| opt | Optimum (damping) |
| s | Sprung mass |
| u | Unsprung mass |
Introduction
There is much current development work on hybrid electric systems for a range of military vehicles. Whilst it is far from clear which form of system is going to dominate the eventual market, if any, many of these development vehicles are being driven using electric motors mounted within the wheels. The placement of the drive motors in the wheels has a number of advantages:
- freeing up the centre of the vehicle (particularly low down in the vehicle), reducing the height of the payload and improving the packaging efficiency of the vehicle;
- allowing individual wheel control, which can enable capabilities such as skid or dual steering (a combination of skid and Ackerman steering); and
- allowing a number of different suspension options that would be difficult to implement using conventional drive due to the driveshafts required to connect the wheels to the driveline.
The disadvantages can be summarized as:
- The placement of drive motors in the hub/wheel assembly adds significantly to the unsprung mass. This has implications for the ride of the vehicle and hence the vibration ‘dose’ experienced by the crew.
- The connections required to the motor include the wiring and cooling required. Due to the electrical power demand and the heat generated by the motor these connections are not insignificant.
- The long-term durability effect of the high levels of vibration seen at the wheel (unsprung mass) is an area that will require careful engineering.
- For military application, the vulnerability of the motors and the potential signature implications are still under investigation.
This paper is part of an investigation into the effects of additional unsprung mass on the suspension of armoured fighting vehicles (AFV). The accelerations (ride) of the vehicle body, the unsprung mass accelerations and suspension travel are considered.
Single wheel station linear model
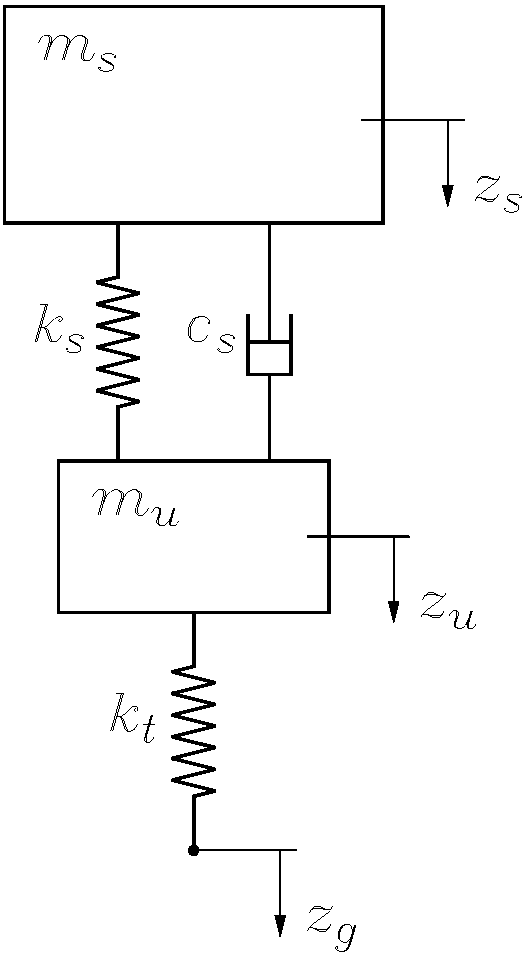
A linear model of a Single Wheel Station (SWS) has been developed and is investigated in this section. The model contains two degrees of freedom, which are the motions of the sprung mass (vehicle body) zs and unsprung mass (wheel or axle) zu. The input to the model is the amplitude of the terrain zg and the outputs are the accelerations of the sprung and unsprung masses and the suspension working space.
The main assumptions made in the model are;
- all components are linear;
- the tyre remains in contact with the ground; and
- the ground does not deform.
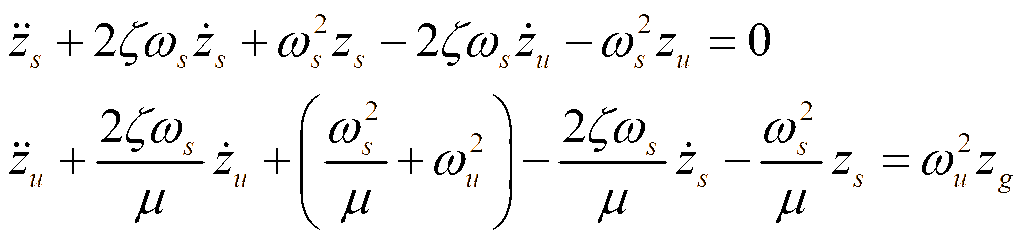
A diagram showing the single wheel station is shown in Figure 1. In this diagram the sprung and unsprung masses are ms and mu, the suspension stiffness and damping are ks and cs, the tyre stiffness is ku. The equations of motion for the suspension system can be written as:
where:

In this form the bounce and wheel hop frequencies are ωs and ωu, the damping ratio ζ and the Mass Ratio (MR) µ. These frequencies and damping ratio are not the natural frequencies and damping ratio of the suspension system but approximations to them.
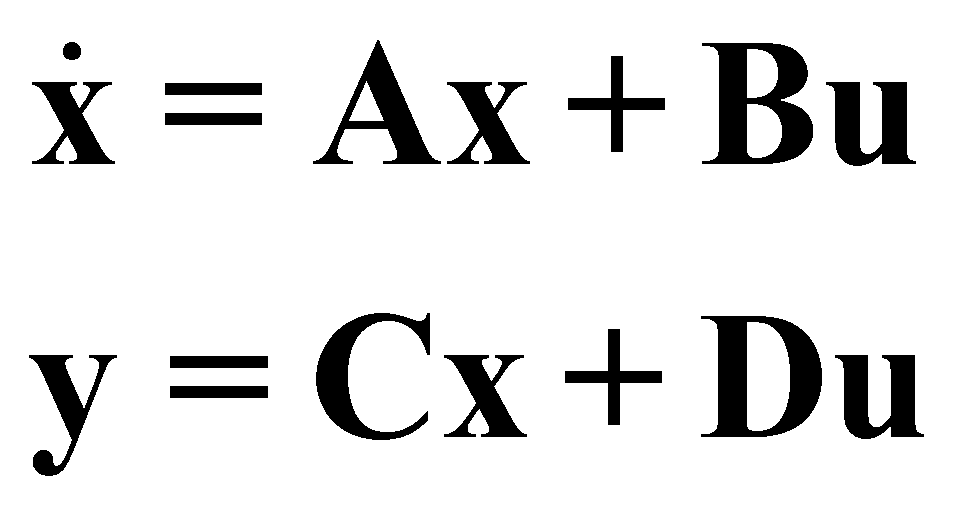
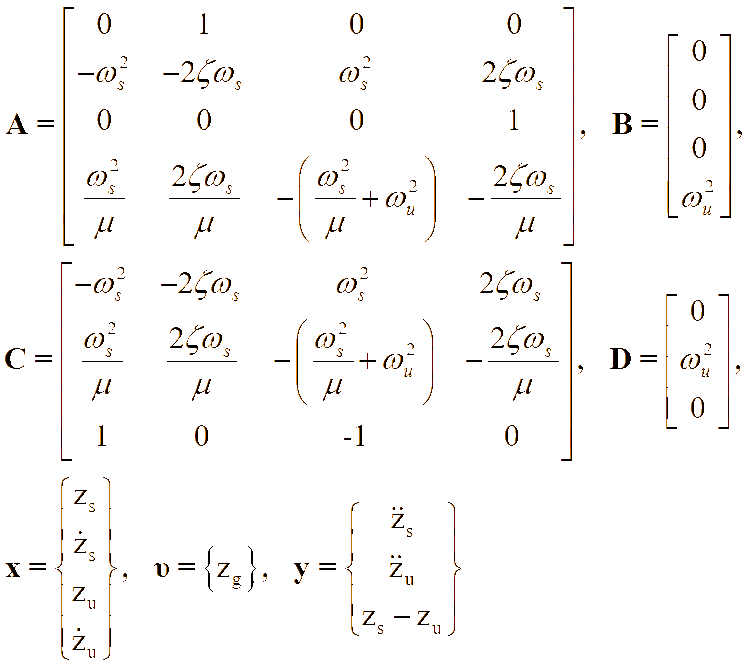
The equations of motion from the system in Equation (1) can be written in state space form to give:
where:
The parameter values selected for the model are based on those given by Trich et al and Krautner [1,2] and measurements of representative systems based at the Royal Military College of Science (RMCS) and are given in Table 1. The damping ratio for the suspension system was selected using the method given by Genta [3], where:

Thus the optimum damping ratio is not dependent upon either the sprung or unsprung masses.
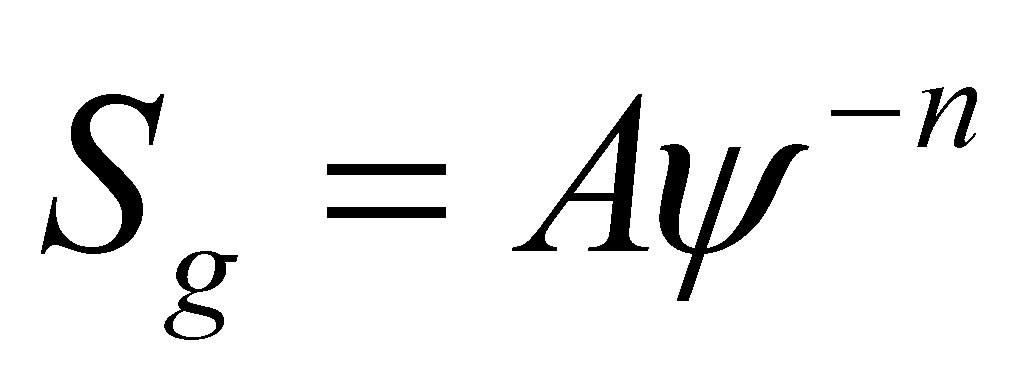
To investigate the random ride characteristics of the SWS the following spectral density was assumed for the terrain:
where:
The value for n being the average for a variety of off-road conditions. This is used widely for analysis at RMCS. The method used to determine the responses is based on Wong [4] and the frequency-dependent weighting used is given in ISO2361 [5] for vertical acceleration.
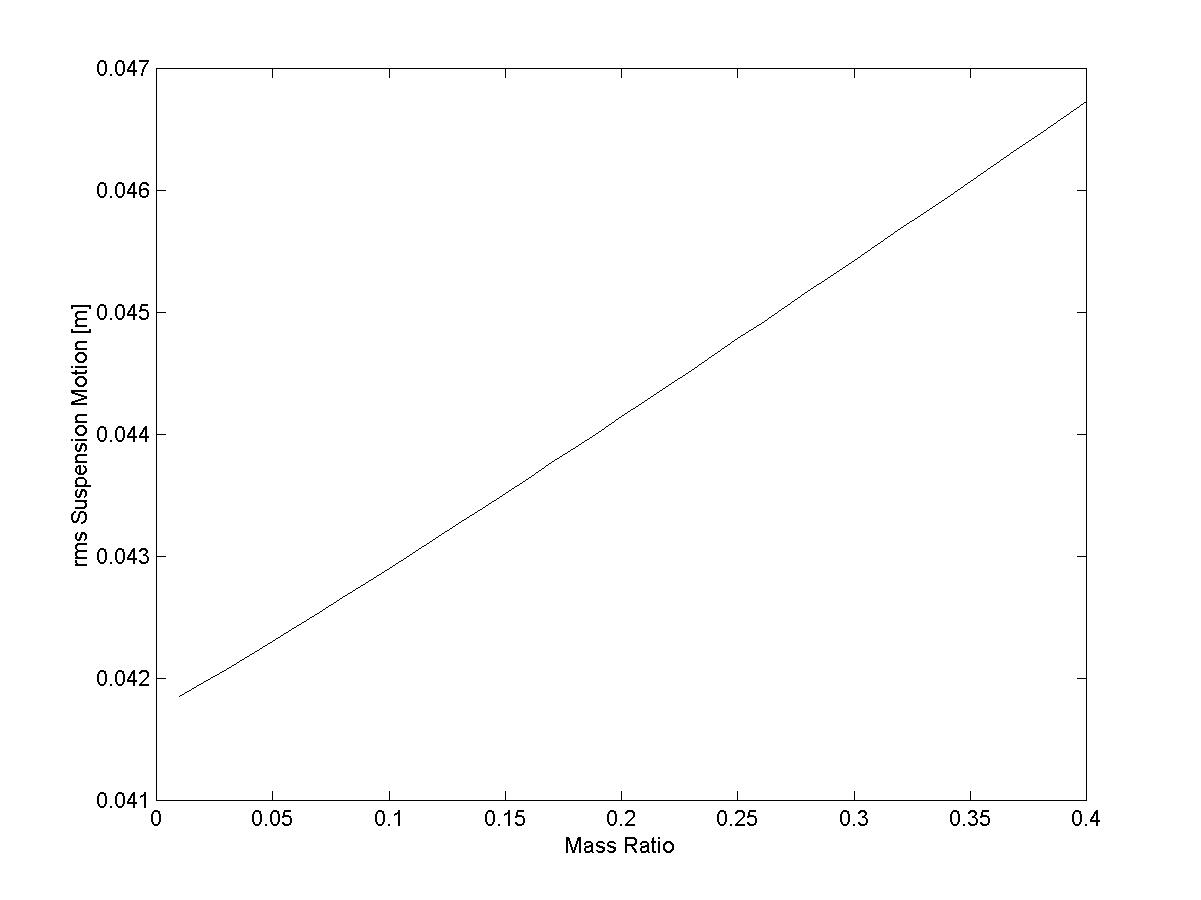
The root mean square (rms) responses from the model with variations in unsprung-to-sprung mass ratio, are given in Figures 2, 3 and 4. From these figures the effect of increasing the MR can be seen on the ride quality, acceleration of the unsprung mass and the suspension working space.
![Plot of rms sprung mass acceleration to ground input for variations of unsprung to sprung mass ratio, solid weighted [5] and dash unweighted.](/journals/journal-of-battlefield-technology/volume-07/issue-01/assets/7-1-3-purdy/figures/figure02.jpg)
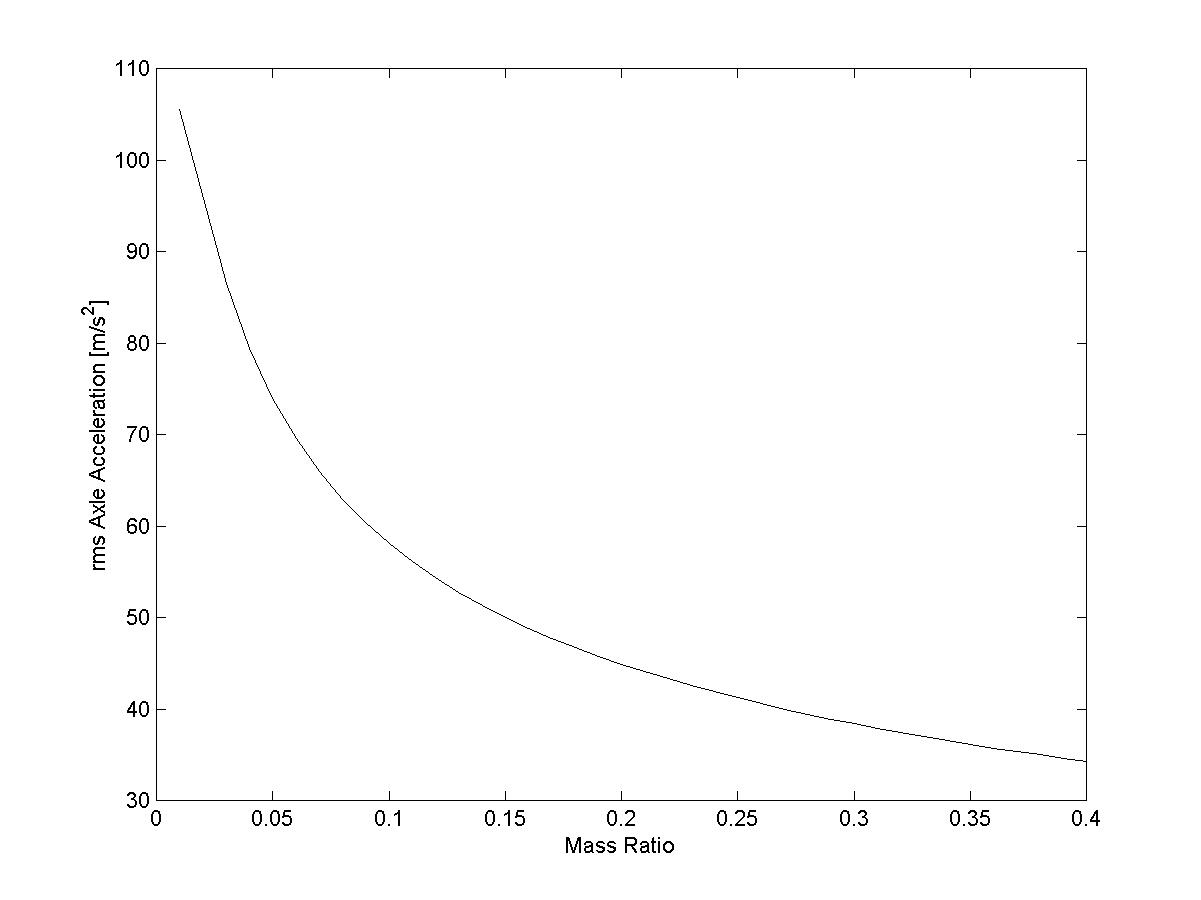
From Figure 2, as the MR increases the ride quality deteriorates indicated by the increasing rms acceleration. In this figure the important range for this ratio is 0.1 to 0.4. The unweighted rms acceleration is significantly higher than the weighted result at low MR but becomes closer at higher ratios. The weighted result, which represents the human response, is always less than the unweighted (unless the frequencies are restricted to just the 4-8 Hz band) and as the MR increases there is an initial rapid reduction in ride quality, which slows as the ratio increases.
From the unsprung mass acceleration, Figure 3, there is a decrease in the rms acceleration felt by the axle as the MR increases. The reduction over the main range (0.1 to 0.4) is almost 60%.
There is an almost constant increase in suspension working space with mass ratio (Figure 4). Thus as the MR increases there is an increased probability of hitting the bump stops on the suspension system if the working space remains constant.
The key findings are that as the unsprung to sprung mass ratio increases the ride quality reduces and there is a requirement for more suspension working space, which could further reduce the ride quality if not available. To balance this the acceleration experienced by the axle or wheel assembly reduces as the ratio increases.
| Parameter | Value |
|---|---|
| Sprung Mass ms | 655 kg [1] |
| Unsprung-to-sprung Mass Ratio µ (MR) | 0.1 – 0.4 [2] |
| Suspension Stiffness ks | 28.03 kN/m [1] |
| Tyre Stiffness kt | 500 kN/m |
| Optimum Suspension Damping Ratio ζopt | 0.37 [3] |
| Tyre Stiffness ke | 128.5 kN/m |
| Tyre Damping ce | 50 Ns/m |
| Tyre Outer Radius | 0.45 m |
| Runflat Outer Radius | 0.38 m |
| Tyre/Runflat Inner Radius | 0.225 m |
| Runflat Stiffness ke | 642.7 kN/m |
| Runflat Damping ce | 1 kNs/m |
Single wheel station nonlinear model
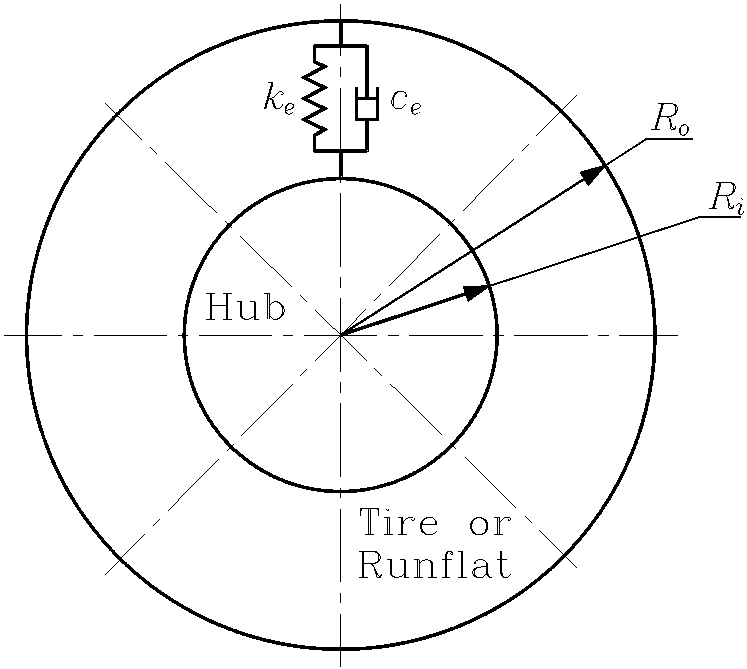
The nonlinear model of the single wheel station is based on that shown in Figure 1 with the tyre stiffness kt replaced with the tyre and runflat insert. Both are modelled as shown in Figure 5.
Tyre and runflat insert models
The hub of the wheel is treated as rigid in this model with the runflat insert and tyre tread being represented by rigid discs, which are linked to the hub by linear springs and dampers as shown in Figure 5, this type of model is a simplified version of that given by Lozia [6] and the rigid ring model of Bruni et al [8] and Zegelaar and Pacejka [9]. The data used for the model is given in Table 1 and has been taken from measurements at RMCS or from experience of similar systems. This model allows the tyre to leave the ground and more accurately represents the kinematics of the contact between it and obstacles.
Obstacles
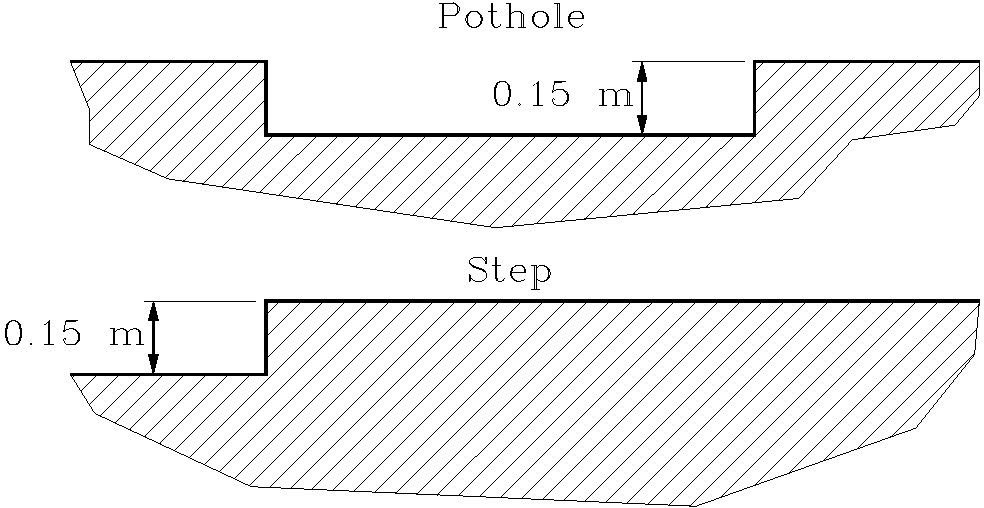
The obstacles to be used for the investigation are shown in Figure 6 and have been taken, with slight modifications, from Triche et al [1].
Results
The simulated responses obtained from the SWS model over the two obstacles at 5, 10, 15, 20 and 25 m/s are presented in this section. The responses given are for the accelerations of the sprung and unsprung masses with MR of 0.1, 0.2, 0.3 and 0.4. In determining the ride quality, the Vibration Dose Value (VDV) [5,7] has been used because of the impulsive nature of the inputs. The standard ISO analysis may not have given a realistic indication in these circumstances because it is based on rms measurement. The results have been broken down into two subsections covering the step and pothole.
Pothole
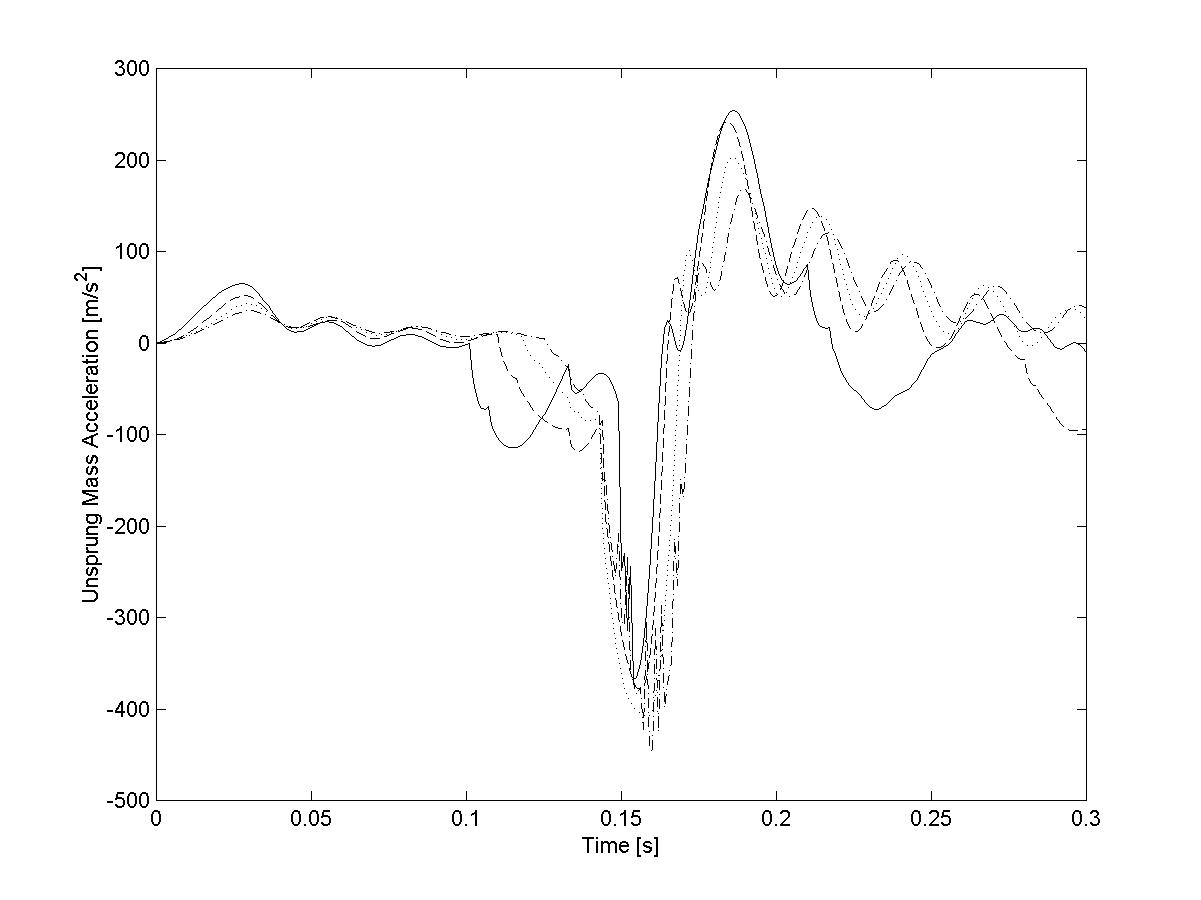
The acceleration of the body and axle are shown in Figures 7 and 8 respectively for a speed of 5 m/s, using the sign convention shown in Figure 1. The plots start when the centre of the axle is directly above the leading edge of the pothole. The initial motion is the suspension system falling into the pothole, with the tyre impacting the trailing edge after about 0.1s. The runflat insert makes contact with the inside of the tyre causes the very sharp rise in acceleration at approximately 0.15s.
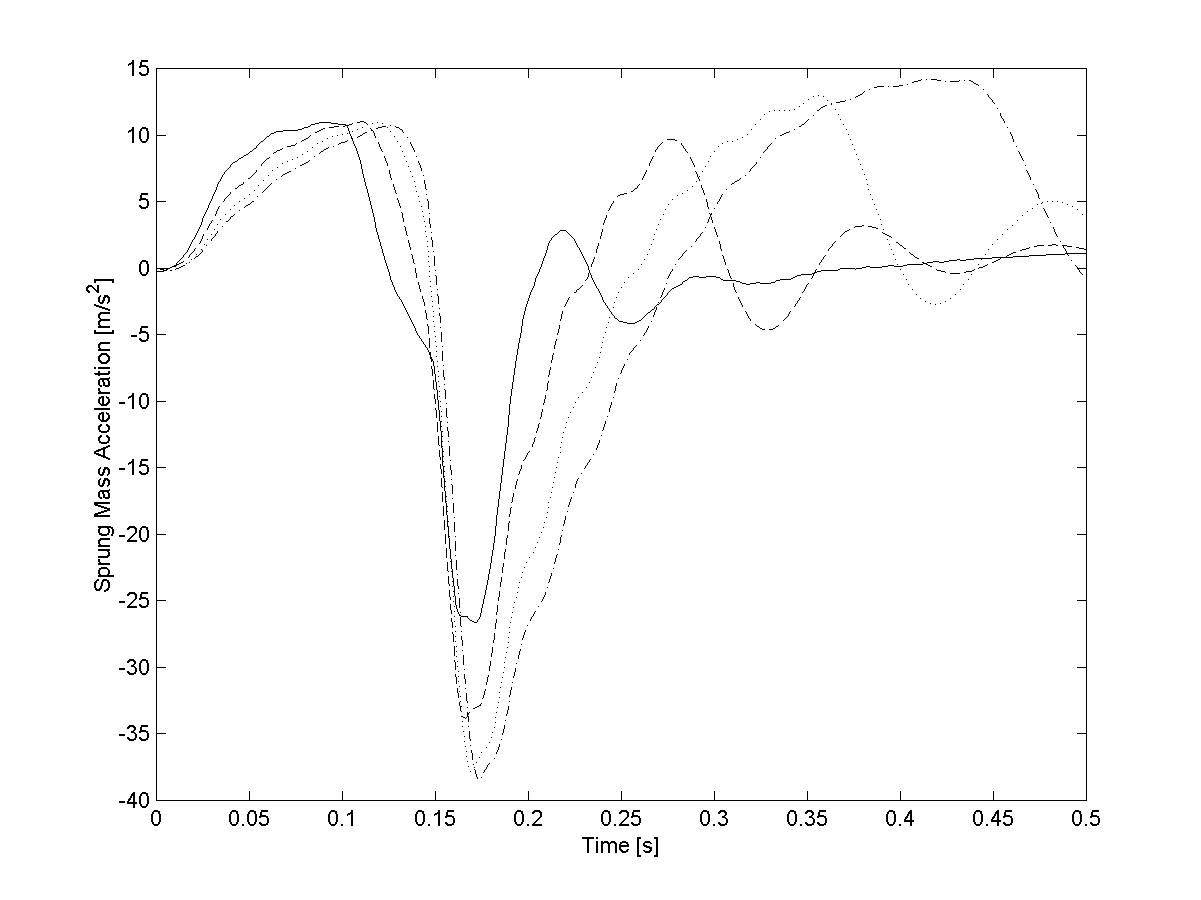
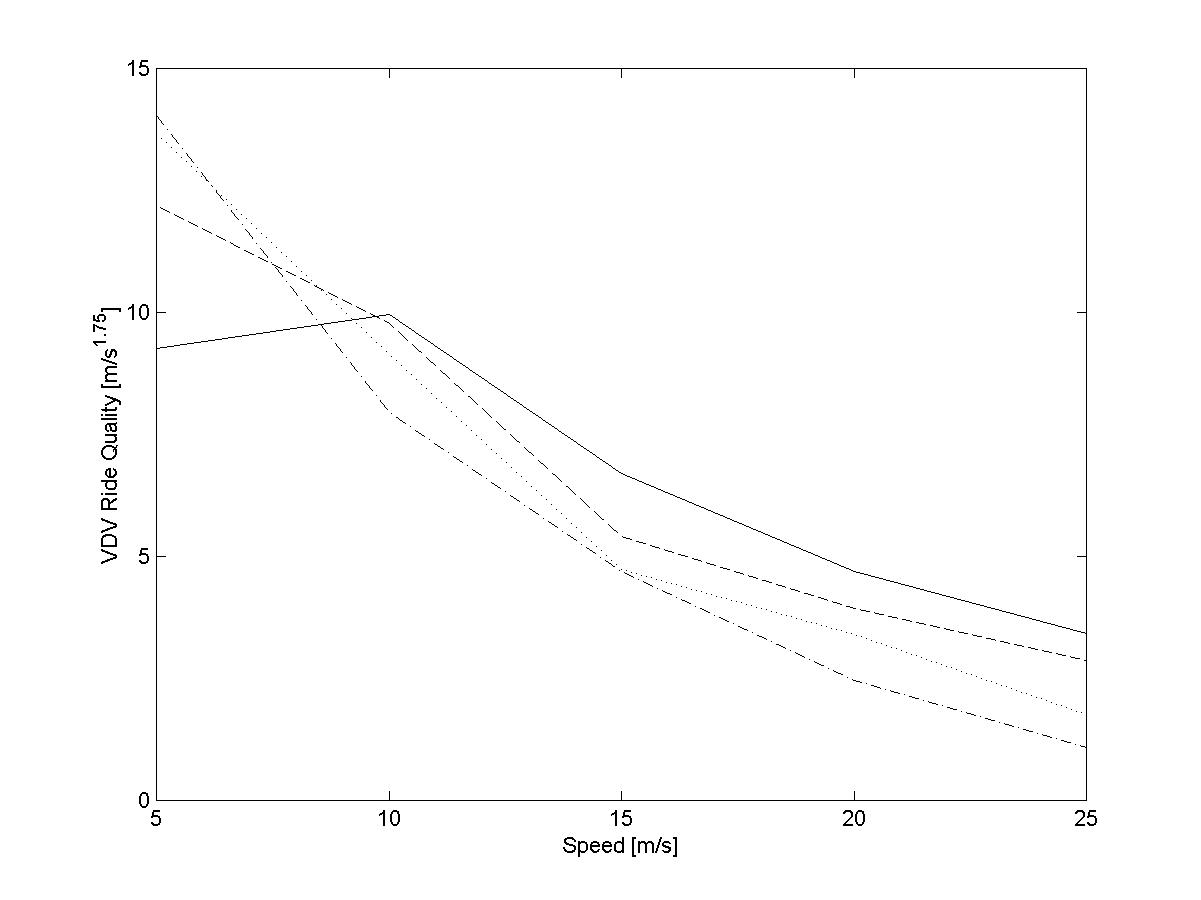
The sprung mass acceleration, Figure 7, shows some variation with MR, the most significant being the peak. This varies from just over 25 m/s2 at MR=0.1 to almost 40 m/s2 with MR=0.4. Thus the peak acceleration experienced by the crew increases with MR. The VDV for the pothole, Figure 9, shows that at this speed, 5 m/s, the best ride would be provided by the lowest MR with the ride worsening as the MR increases. By 10 m/s this completely changes with the greatest MR giving the best ride and the smallest MR the worst, this pattern is then maintained at all higher speeds. The reason for this is that with the lower unsprung mass there is more chance of the tyre being at the bottom, or lower down in the pothole, which results in a greater impulse when contact is made with the trailing edge.
The unsprung mass acceleration, Figure 8, shows an increase of peak acceleration with MR. The peak varies from about 380 m/s2 (MR=0.1) to 440 m/s2 (MR=0.4). These peak accelerations experienced by the unsprung mass are plotted in Figure 10 for the range of speeds being considered. This peak acceleration shows a peak between 5 and 15 m/s, the actual value being hidden because of the coarseness of the speed increments. Only at the lowest speed does the smallest MR give the minimum peak acceleration at all other speeds it is the greatest, the largest giving the minimum.
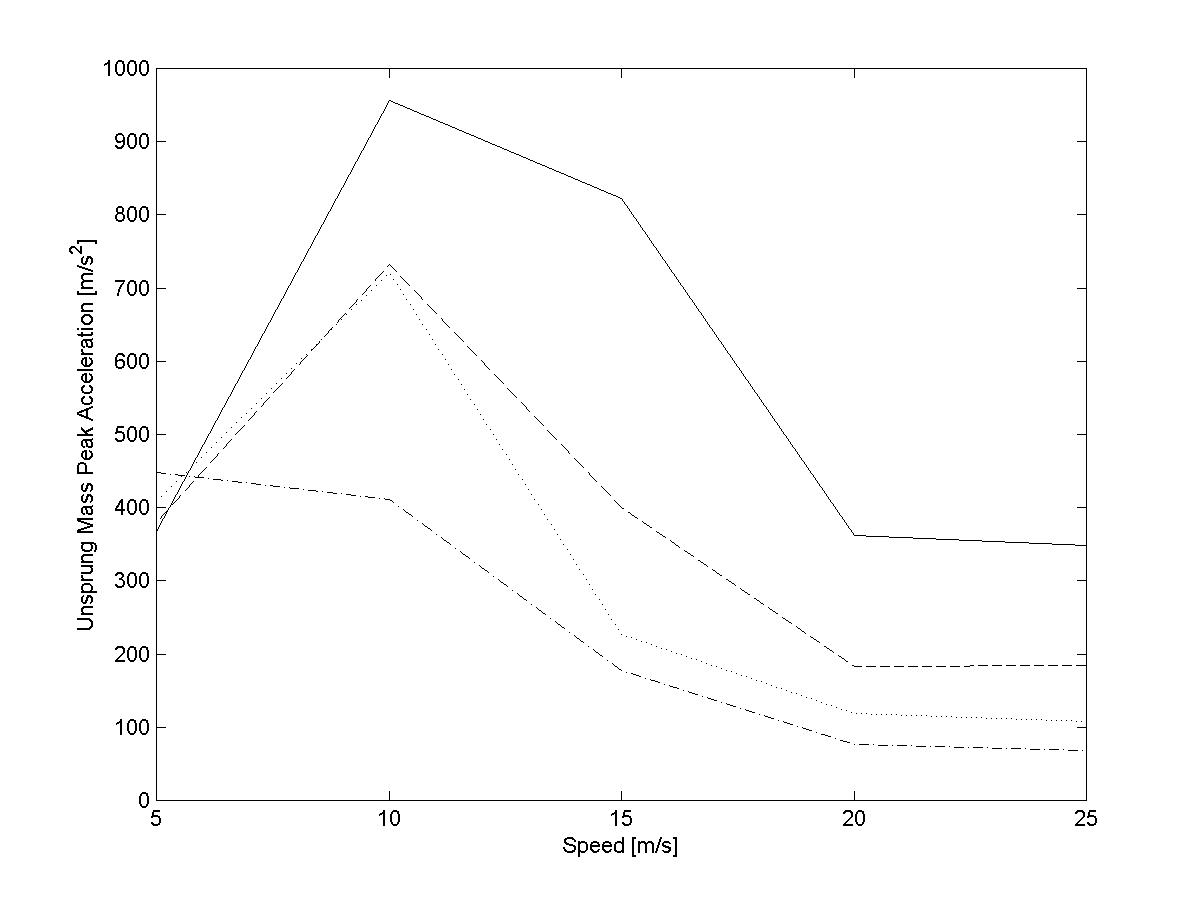
Thus other than at low speed the higher the MR the better the ride quality and smaller the peak acceleration of the unsprung mass when crossing this pothole.
Step
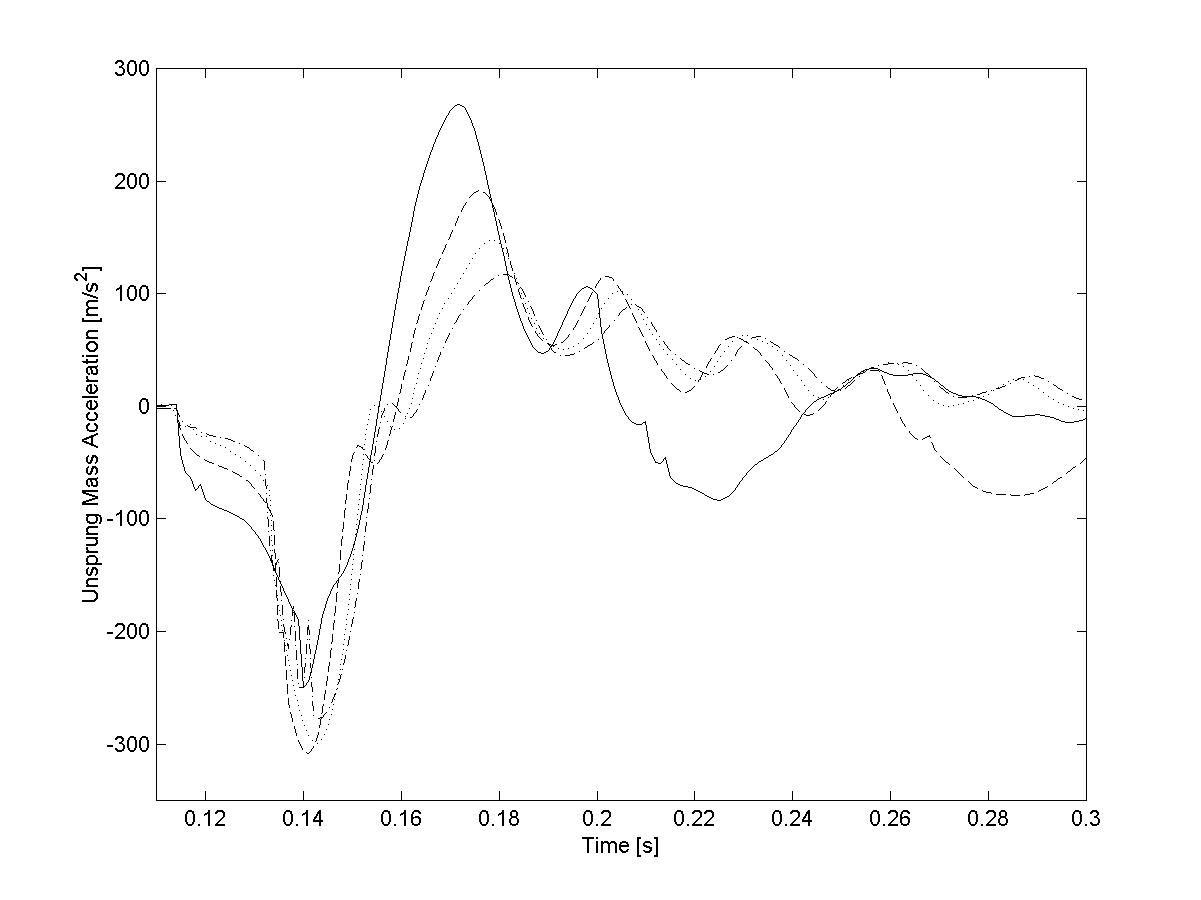
The predicted acceleration experienced by the sprung and unsprung masses when the wheel hits a 0.15 m step at 5 m/s are shown in Figures 11 and 12, where the plots start just prior to the tyre hitting the step.
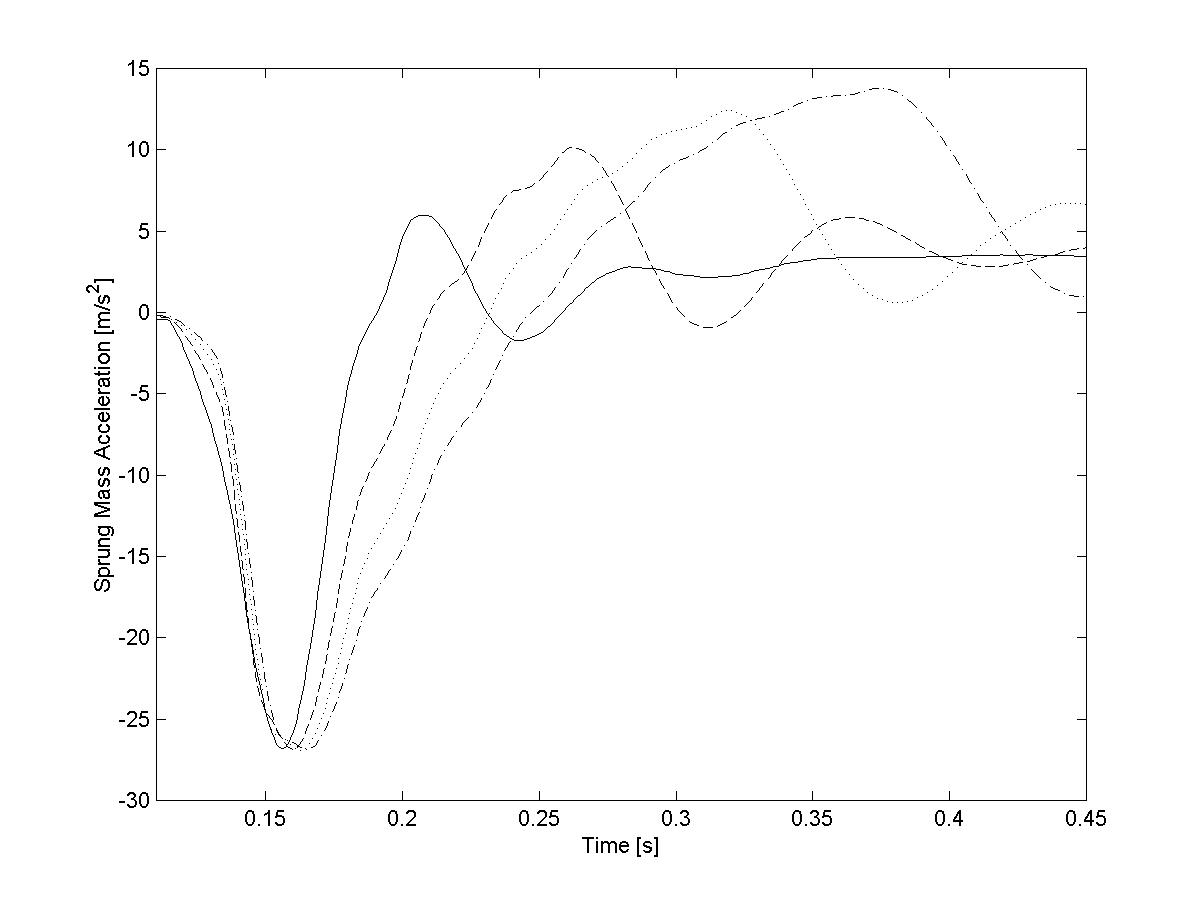
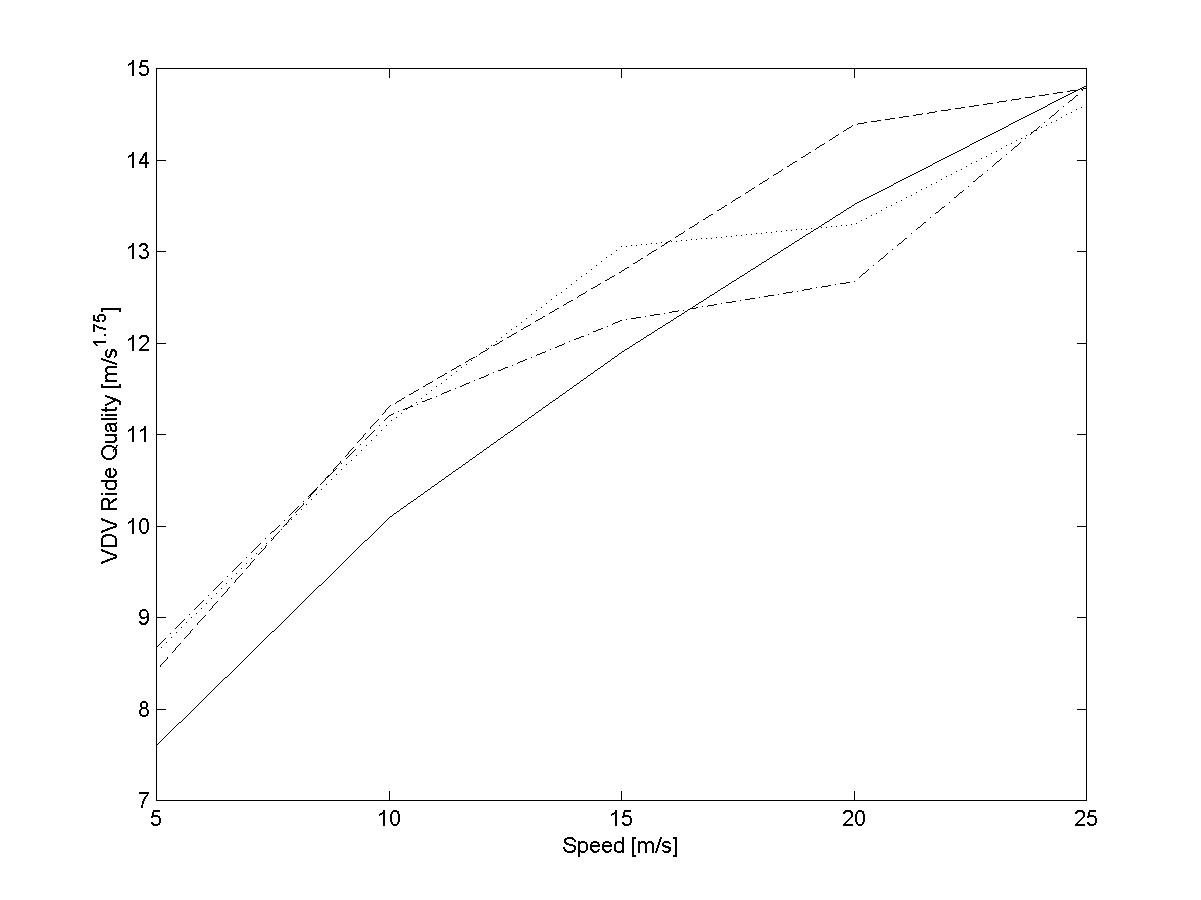
The sprung mass acceleration, Figure 11, shows that the peak acceleration is almost independent of MR. The VDV for the range of speeds and MR being considered is given in Figure 13. In this figure the smallest MR has the better ride quality up to 15 m/s, after which the largest is best. Up to 10 m/s the three larger MR have virtually the same VDV and only deviating at larger speeds, with the greater MR giving the better ride quality. No reason is evident for this behaviour, which requires further investigation, although in absolute terms the results are actually similar for the range of MR values.
The acceleration of the unsprung mass is shown in Figure 12, where the peak acceleration varies from about 250 m/s2 (MR=0.1) to 300 m/s2 (MR=0.4). The subsequent peak can be relatively large and is dependent on the MR, with the smallest giving the greatest acceleration. In the case of MR=0.1 this second peak is greater than the first. This second peak is caused by the wheel leaving the ground after the initial impact with the step. The lighter wheel assembly reacts in a more extreme manner than the heavier versions. The peak acceleration of the unsprung mass is shown in Figure 14, where all the MR show a continuous increase with speed. For all except the slowest speed the lowest MR gives the greatest peak acceleration and the highest the minimum. At a speed of 15 m/s the peak acceleration of the unsprung mass for MR=0.1 is almost twice that for MR=0.4, this effect is due to the greater unsprung mass reducing the peak acceleration.
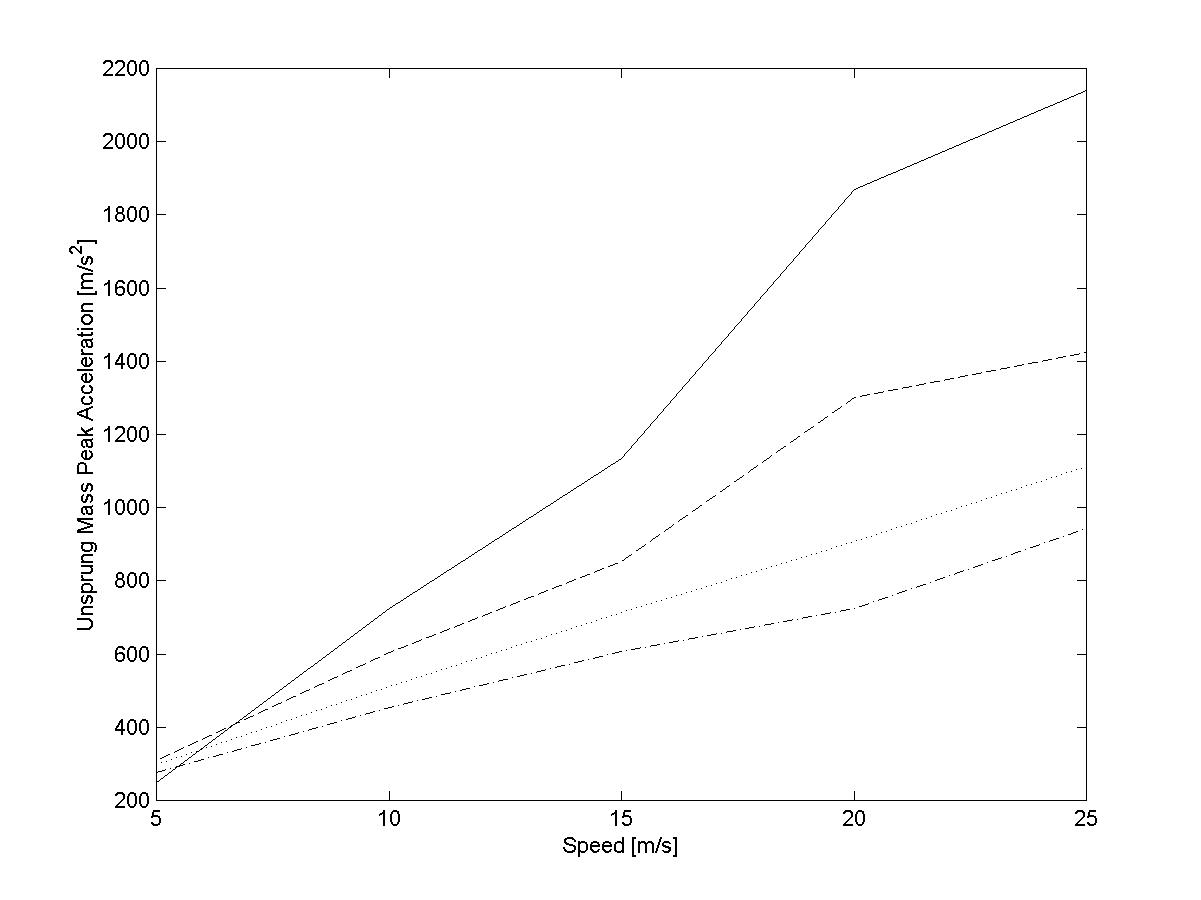
Thus for most probable off-road speeds, at which this type of step is likely to be encountered, less than 10 m/s the lower the MR the better the ride quality but the higher the peak acceleration experienced by the unsprung mass.
Discussion
The results presented have examined the performance of a SWS both as a linear and non-linear model.
The frequency responses of the linear model show the expected results for an increase in MR, in that the rms ride quality decreases with increasing MR and the rms unsprung mass acceleration reduces with increasing MR.
With the non-linear model, for two specific obstacles and limited range of speeds, the VDV ride quality is not as clear-cut. For the pothole only at low speed does the lowest MR give the best ride, above this speed the higher MR gave the better ride, while for the step this situation is reversed. The peak acceleration at the unsprung mass are virtually all higher with the lower MR.
This study has been fairly limited and considered only a SWS, which could only move in the vertical direction and a limited number of terrain types. This ignored the effects of leading or trailing arms, multiple wheel stations and variations to the dimensions of the obstacles, all of which could be important but become vehicle specific. The wheel, tyre and runflat insert model used has not been fully validated but gives results similar to the experimental ones reported by Triche et al [1]. Additionally the accelerations of the sprung and unsprung masses at the higher speeds were of a level that would cause significant damage to the vehicle and occupants.
Conclusion
Using a linear model it has been shown that the rms ride quality reduces with increasing MR and that the rms acceleration of the unsprung mass decreases.
With a non-linear model it was demonstrated that the ride quality was not only dependent on the MR but also on the terrain obstacles and the speed. For a pothole at low speed (less than 10 m/s) it was shown that the lower the MR the better the ride, while at higher speeds the larger the MR the better the ride. For a step the lowest MR gave the best ride quality up to 15 m/s. The peak acceleration of the unsprung mass was shown to reduce with increasing MR for the majority of conditions considered.
References
[1] E. Triche et al, “Wheel Motor Shock Loading Experiments and Requirements”, 5<sup>th</sup> International AECV Conference, Angers, France, 2-5 June 2003.
[2] A. Krautner, Weight and Size Versus Performance of Hybrid Electric Drives for Light to Medium Military Vehicles, MSc dissertation, RMCS, 2003
[3] G. Genta, Motor Vehicle Dynamics, World Scientific, 1997.
[4] J. Wong, Theory of Ground Vehicle, Wiley & Sons Inc, 2001.
[5] International Standard, ISO 2631-1, Part 1, 1997.
[6] Z. Lozia, “A Two-dimensional Model of the Interaction Between a Pneumatic Tire and an Even and Uneven Road Surface”, 10<sup>th</sup> IAVSD-Symposium, Vol. 17, Prague, 24-28 August, 1987.
[7] British Standard Guide to Measurement and Evaluation of Human Exposure to Whole-body Mechanical Vibration and Repeated Shock, BS 6841, 1987.
[8] S. Bruni et al, “On the Identification in the Time Domain of the Parameters of a Tyre Model for the Study of In-plane Dynamics, Tyre Models for Vehicle Dynamic Analysis”, Supplement to VSD, Vol. 27, Berlin, F. Böhm and H. Willumeit (eds), 20–21 February, 1997.
[9] P. Zegelaar and H. Pacejka, “Dynamic Tyre Responses to Vehicle Torque Variations”, Supplement to VSD, Vol. 27, Berlin, F. Böhm and H. Willumeit (eds), 20–21 February, 1997.