
Volume 6, Number 3, November 2003
A Review of Methods for Predicting Bomb Blast Effects on Buildings
- 1 Faculty of Engineering, University of Wollongong, Northfields Avenue, Wollongong, NSW, 2522, Australia.
Abstract
In recent years, explosive devices have become the weapon of choice for the majority of terrorist attacks. Such factors as the accessibility of information on the construction of bomb devices, relative ease of manufacturing, mobility and portability, coupled with significant property damage and injuries, are responsible for significant increase in bomb attacks all over the world. In most cases, structural damage and glass hazard have been major contributors to death and injury for the targeted buildings. Following the events of September 11, 2001, the so-called “icon buildings” are perceived to be attractive targets for possible terrorist attacks. Research into methods for protecting buildings against such bomb attacks is required. Several analysis methods available to predict the loads from a high-explosive blast on buildings are examined. Analytical and numerical techniques are presented and the results obtained by different methods are compared. A number of examples are given.
Introduction
In recent years, explosive devices have become the weapon of choice for the majority of terrorist attacks. Such factors as the accessibility of information on the construction of bomb devices, relative ease of manufacturing, mobility and portability, coupled with significant property damage and injuries, are responsible for significant increase in bomb attacks all over the world. In most of cases, structural damage and glass hazard have been major contributors to death and injury for the targeted buildings. Following the events of , the so-called “icon buildings” are perceived to be attractive targets for possible terrorist attacks. Research into methods for protecting buildings against such bomb attacks is required.
The bombing of the World Trade Centre in in February 1993, the devastating attack against the in in April 1995, and the recent collapse of both have underscored the attractiveness and vulnerability of civilian buildings as terrorist targets. These attacks have also demonstrated that modern terrorism should not be regarded as something that could happen elsewhere. No nation can believe itself immune to terrorist violence within its own borders. The fact is that the majority of government and civilian buildings continue to be vulnerable to terrorist attacks.
What can be done to ensure structural integrity from explosive blasts with minimum loss of life or property? Structural engineers today need guidance on how to design structures to withstand various terrorist acts. While the issue of blast-hardening of structures has been an active topic with the military services, the relevant design documents are restricted to official use only. A very limited body of design documentation currently exists which can provide engineers with the technical data necessary to design civil structures for enhanced physical security. The professional skills required to provide blast-resistant consulting services include structural dynamics, knowledge of the physical properties of explosive detonations and general knowledge of physical security practices.
The following steps are commonly followed in this practice: determination of the threat, development of the design loadings for the determined threat, analysis of the behaviour and selection of structural systems, design of structural components, and retrofitting of existing structures. This paper briefly discusses the nature of explosions and the effects of explosions on structures. It focuses on the techniques for predicting the design blast loads that can be used to evaluate the structural response (the damage level) of a new or an existing building.
Methods for predicting blast loads
The following methods are available for prediction of blast effects on building structures:
- Empirical (or analytical) methods.
- Semi-empirical methods.
- Numerical (or first-principle) methods.
Empirical methods are essentially correlations with experimental data. Most of these approaches are limited by the extent of the underlying experimental database. The accuracy of all empirical equations diminishes as the explosive event becomes increasingly near field.
Semi-empirical methods are based on simplified models of physical phenomena. They attempt to model the underlying important physical processes in a simplified way. These methods rely on extensive data and case studies. Their predictive accuracy is generally better than that provided by the empirical methods.
Numerical methods are based on mathematical equations that describe the basic laws of physics governing a problem. These principles include conservation of mass, momentum, and energy. In addition, the physical behaviour of materials is described by constitutive relationships. These models are commonly termed computational fluid dynamics (CFD) models.
Empirical methods
Over the years, as a result of research coupled with test programs, a number of analytical methods for predicting blast loading have been developed. These analytical procedures are presented in several technical design manuals and reports, some of which are described in the following sections.
Tm 5-1300 (us department of the army, 1990)
This manual is one of the most widely used publications available to both military and civilian sectors for designing structures to provide protection against the blast effects of an explosion. It contains step-by-step analysis and design procedures, including information on (i) blast loading; (ii) principles of non-linear dynamic analysis; and (iii) reinforced concrete and structural steel design.
The design curves presented in the manual give the blast wave parameters as a function of scaled distance for three burst environments: (i) free-air burst; (ii) air burst; and (iii) surface burst.
When an explosion occurs adjacent to and above a building structure such that no amplification of the initial shock wave occurs between the explosive charge and the structure, then the blast loads on the structure are free-air blast pressures.
The air-burst environment is produced by explosions that occur above the ground surface and at a distance away from the building structure so that the initial shock wave, propagating away from the explosion, impinges on the ground surface prior to arrival at the structure. As the shock wave continues to propagate outward along the ground surface, a front known as the Mach front is formed by the interaction of the incident wave and the reflected wave. The reflected wave represents the incident wave that has been reinforced by the ground surface.
If a charge is located on or very near the ground surface, the blast environment is considered to be a surface burst. The initial wave of the explosion is reflected and reinforced by the ground surface to produce a reflected wave. Unlike the air burst, the reflected wave merges with the initial wave at the point of detonation to form a single wave, similar to the Mach of the air burst, but essentially hemispherical in shape.
A scaling chart that gives the positive phase blast wave parameters for a surface burst of a hemispherical TNT charge is presented in Figure 2-15 in [1]. Such scaling charts provide blast load data at a distance R (called the standoff distance) along the ground from a specific explosive. To compute blast loads at points above the ground, a simplified approach is presented later in this paper.
The following step-by-step procedure for determining blast wave parameters for a surface blast is outlined in TM5-1300:
Step 1. Determine the charge weight, W, as TNT equivalent, and ground distance RG from the charge to the surface of a structure.
Step 2. Calculate scaled ground distance, ZG:
ZG = RG / W1/3
Step 3. Read the blast wave parameters from Figure 2-15 in [1] for corresponding scaled ground distance, ZG. To obtain the absolute values of the blast wave parameters, multiply the scaled values by a factor W1/3.
For example, detonation of a 100-kg TNT hemispherical charge at a distance of 15m from a building will produce loading on the front wall with the following parameters:
Peak reflected overpressure Pr = 272 kPa
Reflected impulse ir = 954 kPa-ms
Positive phase duration t0 = 17.2 ms.
Tm5-855-1 (us department of the army, 1986)
This manual provides procedures for the design and analysis of protective structures subjected to the effects of conventional weapons. It is intended for structural engineers involved in designing hardened facilities. It includes chapters on air-blast effects, blast loads on structures, and auxiliary systems (air ducting, piping, and so on). The manual also provides closed-form equations to generate the predicted air-blast pressure-time histories.
This manual can also be used to evaluate blast loading on multi-storey buildings. Load-time histories for buildings and building components located at some height above the ground can be calculated according to the methodology presented in TM5-855-1. The basic steps are outlined below:
- Divide a surface into sub-sections and evaluate a pressure-time history and impulse for each small zone.
- The total impulse applied to the surface is then obtained by summing up the impulses for each sub-section.
- The total load-time history is then defined to have an exponential form with a peak calculated assuming an average peak pressure applied over all the surfaces.
One of the limitations of this simplified method lies in neglecting the true physics of the blast wave / structure interaction phenomena in that it assumes the load-time history is applied to all parts of the surface at the same time. This assumption provides a poor approximation for close-in blast effects.
To overcome the above limitation, another algorithm has been developed and codified in the BLAPAN program [5]. In this program, the total load on a surface at a particular time is computed by summing up the load on each sub-surface at that time. Thus, the calculation predicts a load-time history that has the same total impulse as estimated by the TM5-855-1 procedure above, but with a different load versus time relationship.
CONWEP airblast loading model (hyde, 1992)
Kingery and Bulmash [2] have developed equations to predict air-blast parameters from spherical air bursts and from hemispherical surface bursts. These equations are widely accepted as engineering predictions for determining free-field pressures and loads on structures. The Kingery-Bulmash equations have been automated in the computer program CONWEP [3].
The report [2] contains a compilation of data from explosive tests using charge weights from less than 1 kg to over 400 000 kg. The authors used curve-fitting techniques to represent the data with high-order polynomial equations, which are used by CONWEP program. These equations can also be found in TM5-855-1 in graphical form only.
Unlike TM5-855-1, where an approximate equivalent triangular pulse is proposed to represent the decay of the incident and reflected pressure, CONWEP takes a more realistic approach, assuming an exponential decay of the pressure with time:
where P(t) is the pressure at time t (kPa); Pso is the peak incident pressure (kPa); T0 is the positive phase duration (ms); A is the decay coefficient (dimensionless); and Ta is the arrival time (ms).
The above equation is usually referred to as the Friedlander equation. The air-blast parameters in Equation (peak incident and reflected pressure and impulse, positive phase duration, and time of arrival) are calculated using the equations found in [2]. Using the peak pressure, impulse, and duration, the program iterates to find the decay coefficient A. The program then uses Friedlander’s Equation to find blast pressure values at various time steps.
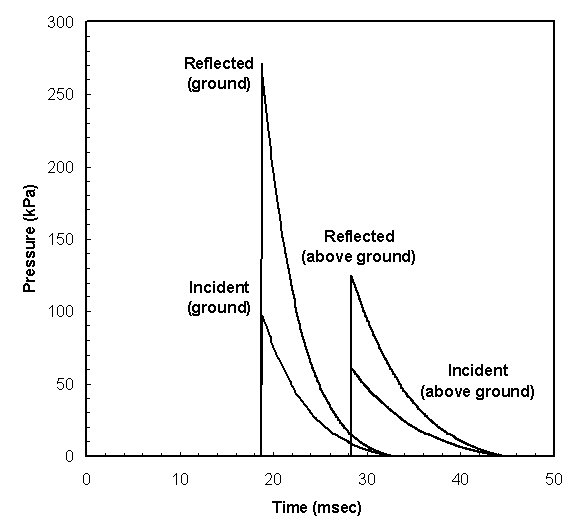
CONWEP air-blast loading model was used to make free-field and reflected predictions of air-blast parameters due to detonation of a 100-kg hemispherical charge of TNT explosive at the distance of 15m from the point of detonation.
The incident and reflected pressure-time histories for a hemispherical surface burst as predicted by the CONWEP program are shown in Figure 1. For the point of interest located 15m away from a 100-kg charge on the ground, the blast wave arrives ~19 ms after the detonation. The ambient pressure increases almost instantaneously and promptly begins to decay, forming an approximately triangular overpressure pulse. The peak side-on overpressure is approximately 99 kPa. It represents the pressure at a point in space when the shock wave is unimpeded in its motion. The duration of the pressure pulse is close to 15 ms. When the shock wave strikes the exterior wall of the building, the blast wave is reflected by the structure. The normally reflected overpressure is about 271 kPa with the corresponding reflected impulse of 918 kPa-ms.
Simplified approach to computing blast loads at points above ground
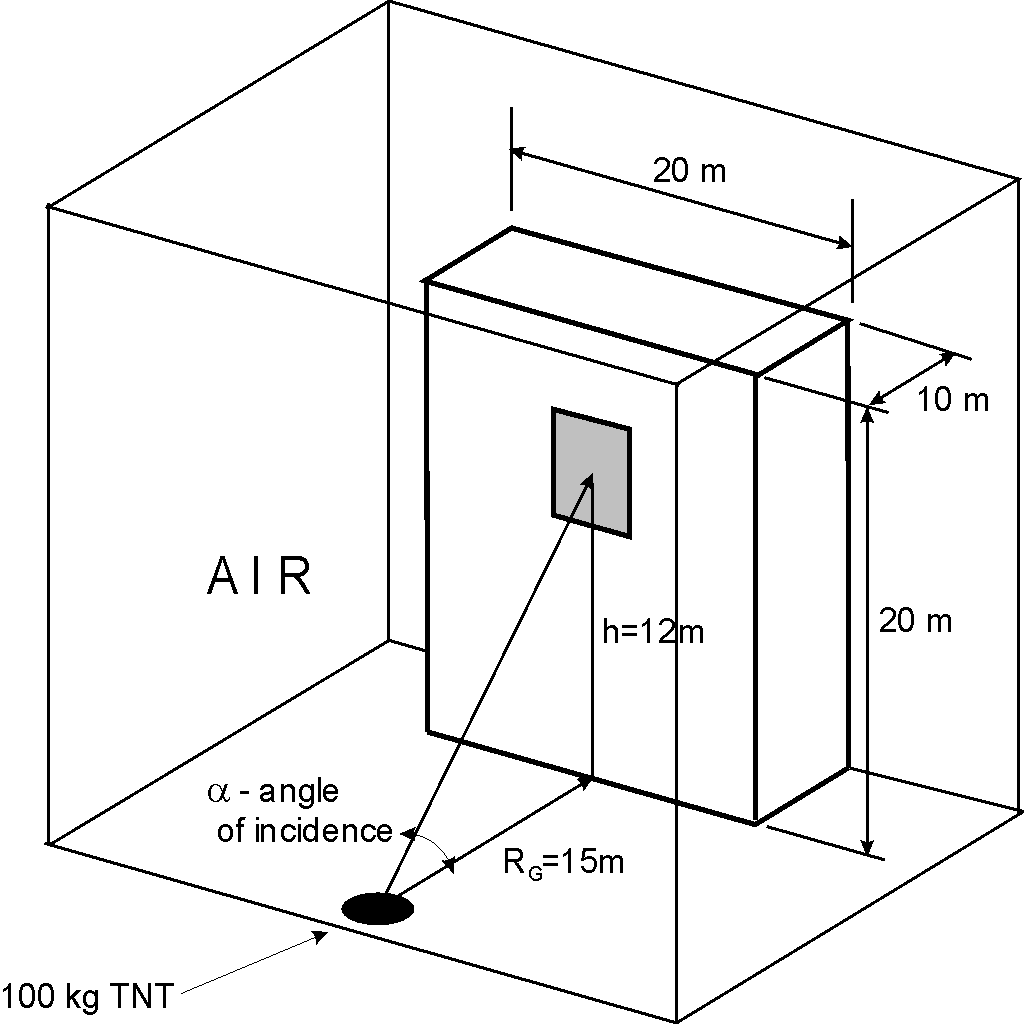
A simplified geometry of a typical bomb threat on an office block is depicted in Figure 2.
The blast loads on the vertical exterior wall of a building are calculated based on the input equivalent TNT charge weight (W), the charge location relative to the building, and the assumption of a relevant blast wave propagation model. There are generally two blast environments that could be considered in this situation: (1) a spherical air blast; and (2) a hemispherical surface blast.
Nearly all exterior bomb threats on architectural targets can be modelled using the surface-burst model. In this model, a charge is located on or very near the ground surface. The wave of the explosion is reflected from the ground and reinforces the energy of the blast wave propagating through the air. If the ground were a perfectly rigid surface, approximately half of the bomb energy would be reflected from the ground effectively doubling the blast wave intensity. Since the ground is not a perfect reflector, some energy (about 20%) is lost in forming a crater and producing ground shock.
In Figure 2, the ground standoff distance, RG, is calculated as the shortest distance from the centre of explosive charge to the exterior wall (or, the length of direct vector from the explosive charge which is normal to the surface). The standoff distance at height h, Rh, is introduced as the straight-line distance from the charge to the geometric centre of the area of interest, which is at height h above ground. The point of interest is always assumed to be at the centre of the building component and the blast load at the centre is used as a uniform load over the entire structural component.
Angle of incidence
According to the simplified procedure, the blast pressure on a vertical exterior wall will always be the fully reflected pressure corresponding to the calculated scaled standoff distance. One can argue that the simplified procedure does not consider the relationship between angle of incidence and reflection of the blast wave. The angle of incidence of a point on a surface is the angle between the outward normal and the direct vector from the explosive charge to the point. This is illustrated in Figure 2. It is well known that the angle of incidence is one of the factors, which generally affects the blast load on structural components.
For a given scaled standoff, Z=R/W1/3, the pressure measured on a large rigid surface and an angle of incidence equal to zero degrees (α=0) is the fully reflected pressure Pr at that scaled standoff. For a given standoff, the pressure measured at a point on a surface that has an angle of incidence of 90° (that is, it is parallel to the direction of blast wave propagation) is the incident or side-on pressure Pso at the given scaled standoff distance. The impulse applied to a surface being the integral of the pressure-time history is also affected by the angle of incidence. The impulse is generally increased from its free-field value if the angle of incidence is less than 90°.
If the angle of incidence is less than 45°, use of fully reflected peak pressure and impulse can be justified by analysing the reflected pressure-angle of incidence relationship shown in Figure 2-193 in [1].
In Figure 2-193 in [1], the reflected peak pressure is the product of the side-on pressure and the reflection factor shown on the vertical axis of the figure. The recommended minimum scaled range is Zmin=1.2 m/kg1/3. This implies that only curves corresponding to peak side-on pressures less than 1 000 kPa are applicable. Analysis of curves in Figure 2-193 in [1] indicates that, for the applicable side-on pressure levels, the peak blast pressure remains close to its full reflected value for angles of incidence less than approximately 45°. Therefore, the assumption that the blast pressure remains constant at its full reflected value for small angles of incidence (less than 45°) represents a good simplifying approximation.
Impulse on the area of interest of the building surface with angles of incidence between 0° and 45° are predicted well with this simplified procedure (within 20% on the conservative side). For angles of incidence greater than 45 degrees, impulse on components can be underestimated by factors from 2.5 to 1.5 for angles of incidence between 45° and 70° (see Figure 2-194 in [1]).
For many buildings at larger standoffs from the explosive charge, most of the exterior wall components subjected to reflected pressures would be at angles of incidence less than 45°. This fact renders the simplified procedure for computing blast loads at points above ground to be well suited for engineering calculations of blast induced effects on commercial buildings.
Procedure:
Step 1. Determine the explosive charge weight, W. Assume a hemispherical surface burst model. Select point of interest (centre of area) on the exterior vertical wall of a building at height h above ground.
Step 2. For the point of interest, calculate standoff distance at height h, Rh, scaled standoff distance, Zh, and angle of incidence, α:
Step 3. From Figure 2-15 [1] read peak reflected pressure Pr and scaled positive reflected impulse ir/W1/3. Multiply scaled impulse by W1/3 to obtain absolute value.
Case study: blast loads on a 3-d single building
In this sample problem, an explosive device consists of 100 kg TNT and is located in a street 15m from a single office block. The blast load will be assessed in application to a double glazed unit 1.5m wide by 2m high with its centre 12m above the ground. Two approaches will be evaluated: (i) a simplified method of computing blast loads at points above ground, and (ii) a numerical physics-based method.
Simplified approach
Problem: Determine peak reflected overpressure and reflected impulse for a point of interest on front elevation of office block (see Figure 2).
For the bomb threat geometry outlined in Figure 2, determine blast pressure and load on a double glazed unit 1.5m × 2.0m with its centre 12m above the ground.
Solution:
Step1. Given: Charge weight W=100 kg of TNT (hemispherical charge), h=12m, and RG=15m.
Step 2. For the point of interest:
Step 3. Determine reflected blast wave parameters for Zh=4.1 m/kg1/3:
From Figure 2-15 [1]:
Pr = 146 kPa
ir/W1/3= 154 kPa-ms/kg1/3
ir = 154×(100)1/3 = 715 kPa-ms
t0/W1/3 = 4.05 ms/kg1/3
t0 = 4.05×(100)1/3 = 18.7 ms
If the peak load on a glazing unit is required for design purposes, the panel load is calculated as:
Load = 146kPa × 1.5m×2.0m = 438 kN
Impulse = 715 kPa-ms × (1.5m×2.0m) = 2145 kN-ms
Numerical physics-based method
The numerical methods used to simulate the blast effects problem typically are based upon a finite volume, finite difference, or finite element method with explicit time integration scheme. In this paper, a hydrocode such as AUTODYN [6] is used to illustrate some of the capabilities of these types of codes to predict blast loading on buildings.
Modelling detonation/initial expansion of explosive device
The explosive detonation and expansion is modelled using the default JWL (Jones-Wilkins-Lee) equation of state (EOS) for TNT. For this analysis, the assumption is made that the hemispherical charge is detonated on rigid ground. If no energy is lost in forming the crater in the surface material, the hemispherical surface burst would be equivalent to a spherical detonation using twice the charge weight.
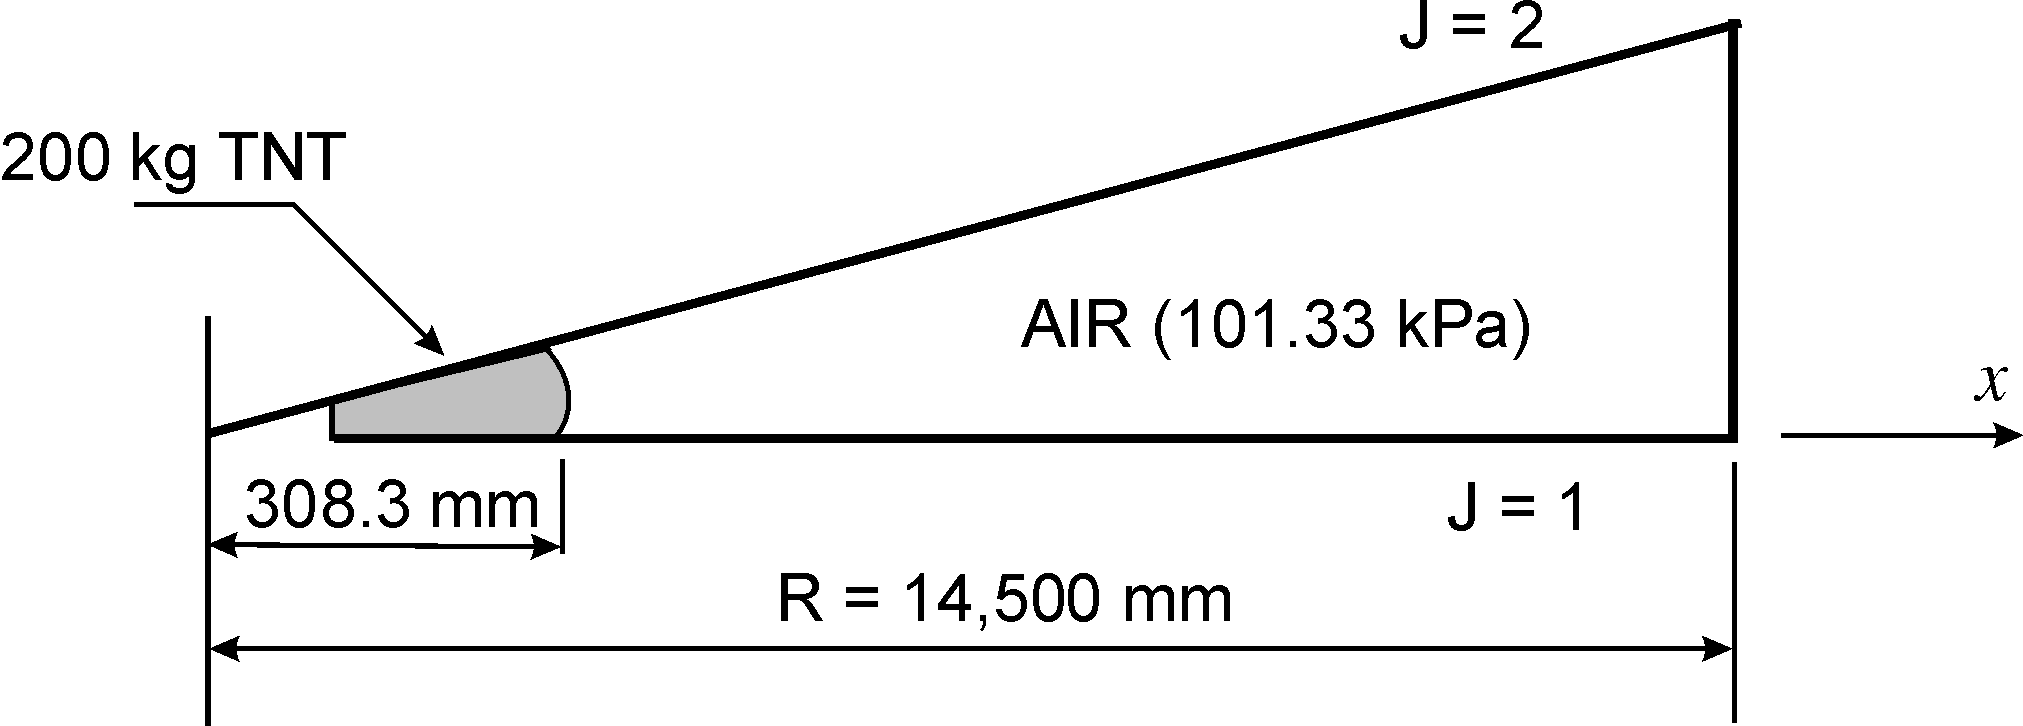
To set the initial conditions for the 3-D analysis of blast wave interaction with the building, a 1-D spherically symmetric analysis is performed of a spherical charge of 200 kg weight. Figure 3 illustrates the 1-D model setup.
The TNT material data available in the EXPLOS material library of AUTODYN is employed for this analysis. The default density of TNT (ρTNT=1.63 g/cm3) is used to calculate the radius of a 200-kg spherical charge of TNT (rTNT = 308.3 mm).
When the blast wave reaches the end of the 1-D mesh, the solution profile of density, velocity, energy, and pressure is saved. This is then mapped into the 3-D model consisting of the rigid building and the surrounding air as an initial condition.
3-d analysis of blast wave interaction with a building
A high order 3-D Euler-FCT approach is used to calculate the blast loads on the entire building structure. The method used in this analysis was optimised to be applicable only to ideal gas behaviour coupled with rigid structures. General 3-D rigid bodies are represented as smooth bodies within the Euler-FCT processor in AUTODYN-3D. The body orientation is totally independent of the rectilinear Cartesian numerical grid. Use of rigid surfaces allows for significant flexibility in modelling the sets of buildings with arbitrary analysis geometry, which is characteristic for modelling the blast effects in urban environments.
A uniform mesh with cells of size 0.5m × 0.5m × 0.5m is initially assumed. A structure is assumed rigid and initial state of the explosion is mapped from the 1-D spherical model. The rest of the computational domain is initialised with air at ambient atmospheric conditions.
A number of pressure gauges are placed along the height of the building to monitor pressure and impulse time histories.
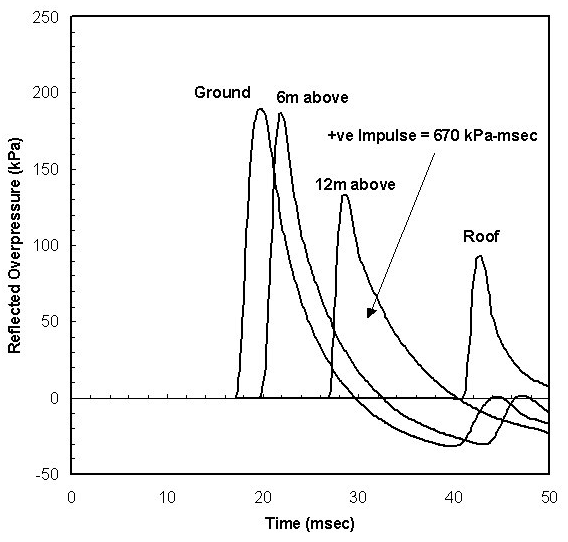
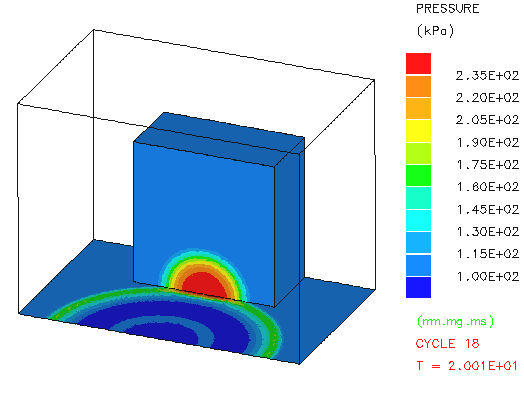
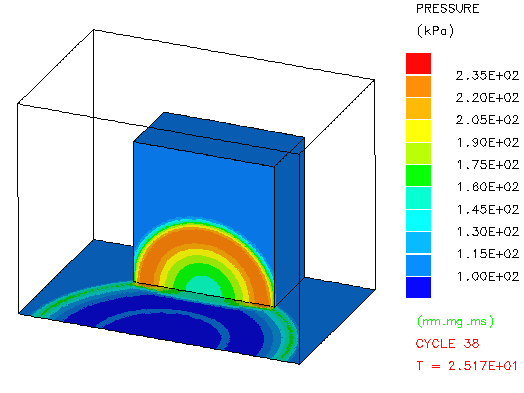
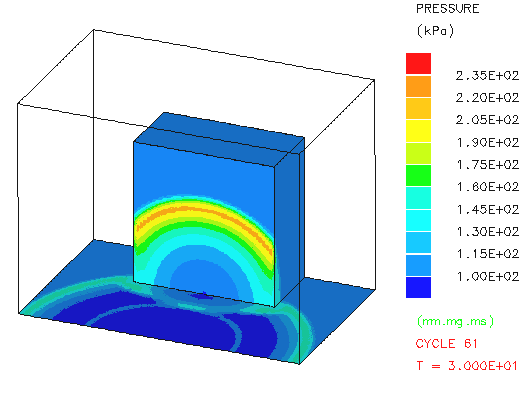
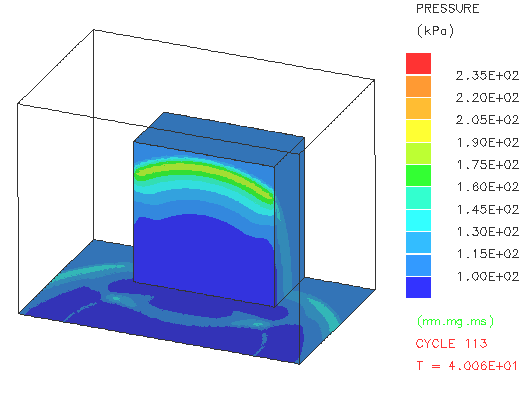
The results of the blast wave / building structure interaction analysis can be presented as contour and time history plots of variables such as overpressure, impulse, dynamic pressure, and velocities. Reflected overpressure time history plots at selected gauge points on the front of the building are shown in Figure 4. Figure 5 presents sequence of total pressure contour plots on a front elevation of the structure.
Table 1 presents the blast load parameters estimated using both a simplified approach and a physics-based model of blast wave propagation in air. The peak reflected overpressure predicted using the analytical method is within 5% of the AUTODYN (numerically obtained) value for upper stories of the building. The simplified approach shows a peak overpressure at the ground level 30% higher than the numerical prediction. The significant differences are shown in the positive phase duration using the two predictions with an average analytical prediction of 25% higher than the numerical one. The positive phase reflected impulse predicted by the simplified method is within 2% to 10% of the AUTODYN value on the conservative side. Also, Figure 4 indicates that a numerical code is able of capturing the correct physics of the blast wave / building interaction such as the presence of the negative phase in the blast wave, while the analytical approach does not account for this phenomenon.
Summary
This paper presents some of the currently available analytical and numerical techniques that can be employed to predict effectively loads on structures when a terrorist weapon is detonated in urban environment. The simplest case is studied when a single building is subjected to blast loading produced by the detonation of high explosive device. It has been shown
Figure 5a. Blast pressures on front elevation after 20 ms.
Figure 5c. Blast pressures on front elevation after 30 ms.
that simplified analytical techniques can be used as an engineering tool for obtaining conservative estimates of the blast effects on buildings. Numerical techniques including Lagrangian, Eulerian, Euler-FCT, ALE, and finite element modelling should be used for accurate prediction of blast loads on commercial and public buildings.
Further work needs to include modelling multiple buildings to investigate the effects on the blast propagation in urban environment.
| Blast Wave Parameters | Simplified Approach / AUTODYN-3D | ||
|---|---|---|---|
| Ground | 12m above ground | Roof | |
| Peak reflected overpressure (kPa) | 270 /190 | 146 /140 | 88 /92 |
| Positive reflected impulse (kPa-ms) | 955 /970 | 715 /670 | 536 /480 |
| Time of arrival (ms) | 18.7 /17.4 | 28.3 /26.5 | 42.8 /41.0 |
| Positive phase duration (ms) | 17.2 /12.1 | 18.7 /14.8 | 20.1 /16.2 |
Figure 5b. Blast pressures on front elevation after 25 ms.
Figure 5d. Blast pressures on front elevation after 40 ms.
References
[1] Department of the Army, Structures to Resist the Effects of Accidental Explosions, Technical Manual 5-1300, Nov. 1990.
[2] C. Kingery and G. Bulmash, Airblast Parameters from TNT Spherical Air Burst and Hemispherical Surface Burst, Report ARBL-TR-02555, U.S. Army BRL, Aberdeen Proving Ground, MD, 1984.
[3] D. Hyde, User’s Guide for Microcomputer Programs CONWEP and FUNPRO – Applications of TM 5-855-1, U.S. Army Engineer Waterways Experimental Station, , 1988.
[4] Department of the Army, Fundamentals of Protective Design for Conventional Weapons, Technical Manual 5-855-1, 1986.
[5] G. Zintilis, “Protection of Commercial Buildings against Blast and Ballistic Threats”, 7th International Symposium on Interaction of the Effects of Munitions with Structures, , 1995, pp. 13-22.
[6] Century Dynamics, AUTODYN-2D & 3D User Documentation, 2002.