
Volume 6, Number 1, March 2003
Using Agent Based Distillations to Model Civil Violence Management
- 1 Land Operations Division, Defence Science and Technology Organisation, PO Box 1500, Edinburgh, SA, Australia, 5111.
Abstract
A model of civil violence has recently been built and studied by Joshua Epstein at the Center on Social and Economic Dynamics in the USA using a remarkably simple cellular automata (CA) simulation. However, the model and its analysis were based on the assumption that the entities have purely random movement, which limits the degree of realism of the model. The Australian Defence Science and Technology Organisation (DSTO) has access to a more sophisticated CA simulation known as MANA, developed by the Defence Technology Agency in NZ. Recently, DSTO has developed a similar civil violence model to incorporate various movement strategies of the entities by using the MANA simulation. This paper describes the model and the analysis of the data, which included graphical, statistical and game theory techniques, and which provide some initial thoughts on the effectiveness of various strategies for managing civil violence. These results may also have applicability in other Operations Other Than War (OOTW) scenarios, including peace keeping and counter-terrorism. Finally, based on the analysis, two extensions to the MANA model are suggested.
Introduction
The civil violence model developed by Epstein [1] had three broad aims. The first was to show that the model was sufficient to generate recognizable macroscopic revolutionary dynamics of fundamental interest. The second was to show via statistical analysis that the resulting system dynamics exhibited characteristics representative of complex systems. The third was to explore the consequences of time-dependent variations of ‘hard’ and ‘soft’ variables (cop reduction and legitimacy reduction, respectively).
This paper does not attempt to exactly reproduce the model and analysis of Epstein [1]. Indeed, the MANA simulation does not (without code changes) permit implementation of some of the constructs used in the Epstein model. However, previous research with MANA [2–5] has already provided sound evidence for the first two aims listed above for the military domain. Similarly, previous work [6] has also demonstrated the importance of the agent’s movement strategy to mission effectiveness. The intent of this paper is to explore the impact of agent movement on a similar civil violence model constructed using the MANA simulation. Future work will then focus on bringing the two models and their conclusions closer together.
Epstein civil violence model
In this highly idealized model [1], a central authority seeks to suppress a decentralized rebellion. The model contains “quiets” (members of the general population), “actives” (those quiets who have become actively rebellious), and “cops” (forces of the central authority who seek out and arrest actively rebellious agents). All entities possess local vision (modelled by a finite radius) and move randomly over a two-dimensional lattice (representing some region). Such models are known as cellular automata (CA) models.
Therefore, over time, members of the general population can transition to various states (see Figure 1, Q=quiets, A=actives, J=jail) and it was the central authority’s aim to maximise the number of quiets, while the rebel’s aim was to maximise the number of actives.
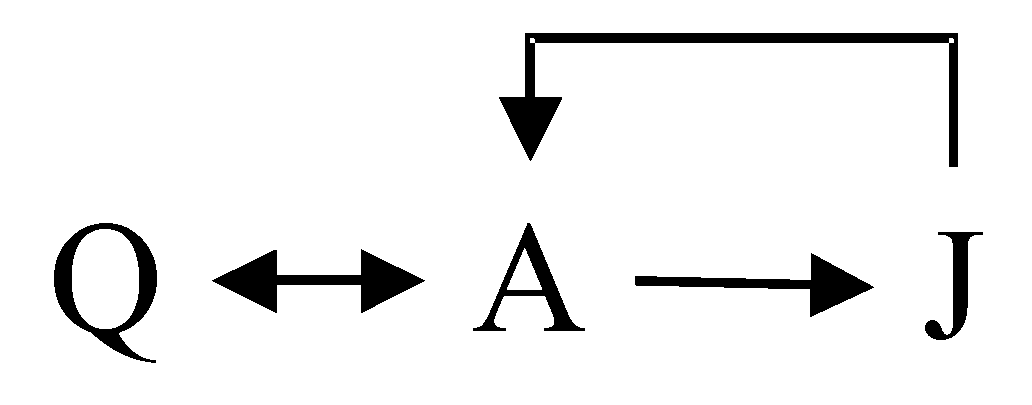
The rules that govern the transitions are as follows: the quiets (actives) will become active (quiet) if their (estimated) probability of being arrested is less (greater) than a certain threshold. This estimate is assumed to increase with the ratio of cops to actives within the prospective rebel's vision, and was given by:
(1)
where k is a constant to be set, C is the number of cops and A is the number of actives. The constant k is set to ensure a plausible estimate (say P=0.9) when C=1 and A=1.
For a fixed number of cops, the agent's estimated arrest probability falls the more actives there are, and this simple idea played an important role in the analysis. The cops (who never defect to the revolution in this model) had one simple rule, which was to inspect all sites within its vision and randomly arrest an active. An arrested active was then released after a finite duration and was assumed to be active.
Motivation for current study
The dynamics of the Epstein model (transitions between quiets and actives and jailed) are essentially governed by the fluctuating spatial densities of the quiets, actives and cops as they randomly move about the region. For example, pockets of relatively low cops densities are ‘ripe’ for rebellious activities and these can grow unchecked, as observed by the former China president, Mao Tse Tung (“a single spark can cause a prairie fire”), and which is why freedom of assembly is often the first casualty of repressive regimes as suggested by Epstein [1].
Given the importance of relative spatial densities, it is therefore conceivable that each side might improve their chances of success if they adopt some movement strategy that is not random. It is also somewhat artificial to assume the cops do not react (probably by chasing) to detected actives and vice versa.
DSTO has been using a more sophisticated cellular automata model, known as MANA [3], which importantly includes non-random movement strategies. By using the MANA simulation, the DSTO, through Land Operations Division (LOD) and Defence Systems Analysis Division (DSAD) has developed a similar civil violence model to incorporate various movement strategies (random and non-random) of the active and cops entities within the model.
This paper describes the MANA civil violence model, comments on the effectiveness of various movement strategies for managing civil violence, and, finally makes suggestions on possible further extensions to the model.
A broader motivation for this study is the observation that DSTO does not possess a robust set of modelling and analysis tools for operations other than war (OOTW) type scenarios (including peace keeping, criminal and terrorist networks) although defence planning for these operations are becoming more frequently required. This study may shed some light on whether cellular automata models are an appropriate enabler for this type of analysis.
MANA civil violence model
Modelling state transitions
There are two differences in the state transition diagram (see Figure 2) from the Epstein model, due in part to the modelling constructs available in MANA. The first is that there is no direct transition from active back to quiet. This represents a somewhat more zealous active entity than in the Epstein model and will provide more of a test of the cops’ strategy. The second difference is that jailed actives are assumed to be quiet on release, which is meant to represent some form of rehabilitation.
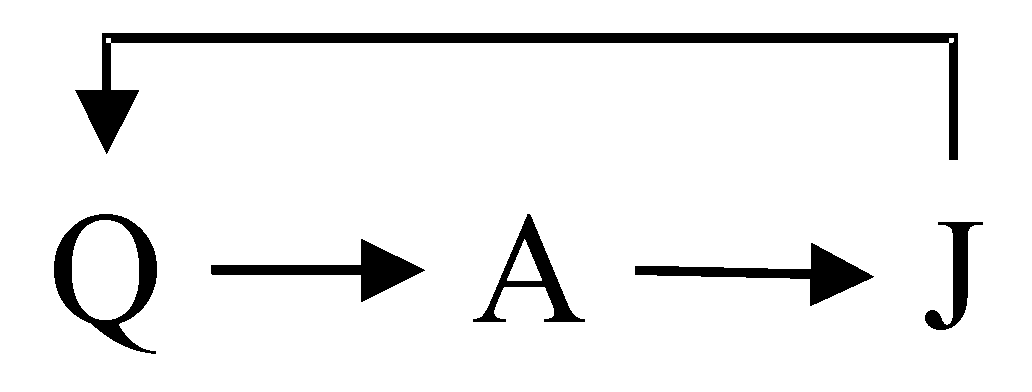
The MANA modelling of the active-to-jailed state transition is essentially the same as in the original Epstein model, in that a single (randomly selected) active within the cop’s vision is arrested. The jailed-to-quiet transition is also easily modelled in MANA by assigning a duration to remain in the jailed state and assigning the quiet state as the fallback state at the end of the duration.
However, MANA is incapable of modelling the quiet-to-active transition as governed by the arrest probability defined in Equation (1). The scheme used in MANA to approximate this situation is governed by what are known as entity interaction probabilities. These define the probability that an entity in state Z successfully transitions an entity in state X to state Y.
To simulate a higher probability of a quiet becoming active when in a high active-to-cops density region, we utilize two entity interaction probabilities. First, we assign a probability of a successful cops-to-active interaction to imply a cop transitioning an active to be in a subdued state. This state lasts only for one time-step during which the subdued active is unable to interact with the quiets. Second, we assign a probability of a successful active-to-quiet interaction to imply an active transitioning a quiet to be in an active state. The net effect of these two entity interaction probabilities is that in a high active-to-cops density region, there will be relatively more unsubdued actives that will then have a relatively higher probability of transitioning a quiet to the active state.
Movement strategies
All entities within the model are assumed to be capable of moving. While this may not be totally realistic, it appears to be a representative assumption, and it should also be noted that the dynamics of a cellular automata model are (quite literally) derived from agent movement.
Movement of the quiet entities is assumed to be random (as in the Epstein model) for two reasons. First, we assume the quiets have no affinity to either the active or cop entities. Second, we wish to concentrate on the dynamics between the active and cops movement strategies.
Movement for cops and actives are simulated in MANA by a set of weightings, which describe an entity’s propensity to move toward or away from other cops, actives and/or quiets. To allow representation of a strategy by a scalar parameterisation, we define:
(2)
as the movement strategies for the actives and cops, respectively. In this study, we assume that Wcops is negative and Wactives and Wquiets are both positive. That is, actives are repelled from cops, cops are attracted to actives, and both may have some attraction to the quiets.
Furthermore, we assume that:
(3)
for the actives, and that:
(4)
for the cops, which models a trade-off between avoiding (or chasing) the opposition and inciting (or protecting) the general population. For example, a large value of λ and small value of µ would represent a situation where actives are very cautious of the cops but the cops are more interested in protecting the general population.
Baseline scenario
The baseline scenario begins with twelve cops, and a population of two hundred, of which twenty are actively rebellious and the remainder are quiets. The area represents a grid of 200 squares by 200 squares. Table 1 lists a summary of each squad properties. Jailed actives are detained for a fixed term of 50 time-steps during which they play no part in the scenario.
| Cops | Actives | Quiets | |
|---|---|---|---|
| Number of agents | 12 | 20 | 180 |
| Sensor range | 50 | 50 | 10 |
| Interaction range | 10 | 10 | 0 |
| Probability subduing actives | 50 | 0 | 0 |
| Probability converting quiets | 0 | 10 | 0 |
Analysis of data
In the first part of the analysis, we will investigate the effectiveness of various movement strategies for both the cops and active as defined by the parameters λ and µ using the baseline MANA scenario. From the results of the resulting payoff matrix we can deduce the preferred strategies for both the cops and actives. Using these preferred strategies, we then study the impacts of the more resource demanding options of increased jail times and number of cops on our civil violence model.
Each simulation is run to 2 000 time-steps to allow the system to reach equilibrium and the mean percentage of quiets in the population over 50 replications is used as the primary measure of effectiveness. We treat the scenario as a two-person (cops and actives) zero-sum game (thus the actives wish to minimize the percentage of quiets in the population).
No strategies
This is akin to the Epstein model, whereby both actives and cops move randomly. In this case, we set Wcops, Wactives and Wquiets all to zero. We investigate this case first since it provides a baseline result to compare the subsequent analyses (assuming the effectiveness of some strategy is better than a random strategy). Figure 3 illustrates the time-series of the MANA civil violence model population (quiets, jailed and actives), averaged over the 50 replications, for the no strategies case.
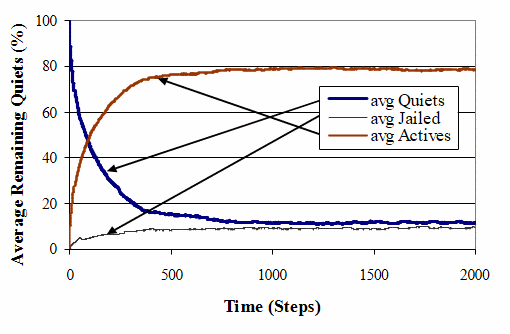
Figure 3 shows that in the first 500 time-steps, there is a rapid decline in the average number of quiets. The reason for this is that with a relatively low number of cops in random motion, there are likely to be areas where the cops’ density is low and the concentrations of actives are high (that is, low local C/A ratios). As a result, the quiets in these areas find it rational to join the rebellion and thus, catalyse a local outburst of actives. This is why there are an equally fast growing number of actives.
Figure 3 also shows that an equilibrium average population mix is achieved (in this case was before the 2 000 time-step simulation end). This is a result of supply-and-demand types of relationships that exist in this model (and more generally in models of population dynamics or predator-prey systems). Over time, the actives have a dwindling pool of potential new recruits (the quiets), while at the same time the increased number of actives will generally result in more being arrested (even with the cops moving randomly). These two feedback loops control the dynamics of the system, and a stable equilibrium results. Under the no strategies case, the cops perform badly, with only approximately 12% of the population remaining quiet (and approximately 78% active and the remaining 10% in jail).
Actives adopt various strategies
The aim of this paper is to investigate the effectiveness of various movement strategies of the two players (cops and actives). We hypothesise that some strategy is better than no strategy, and begin by allowing the actives to possess a movement strategy as defined by the parameter λ, but keeping the cops fixed with no strategy.
Figure 4 illustrates the variation of the average equilibrium percentage of the population that is quiet with the actives movement strategy parameter λ.
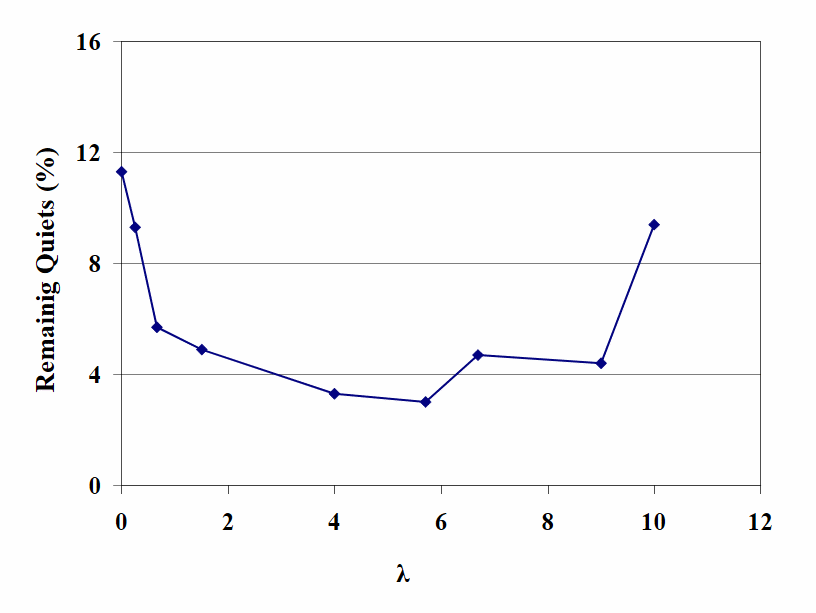
As shown in the graph, having either a low λ value (that is, a relatively high attraction to the quiets) or a high λ value (that is, a relatively high repulsion from the cops) is not the best strategy for the actives. In fact, if the actives choose to just chase the quiets and not run away from the cops (that is, λ=0) this produces the same effectiveness than if they used no strategy. More importantly, both of these strategies would give the actives their worst-case result (12% quiets as mentioned above).
The best strategy for the actives occurs at the minimum of the graph, which occurs when λ≈ 5, that is the repulsion from the cops is about five times stronger than the attraction to the quiets. Under this strategy, the actives can improve their effectiveness by reducing the average percentage of quiets in the population to approximately 3%. Figure 5 illustrates the time-series of the population (quiets, jailed and actives), averaged over the 50 replications, for the optimal active strategy case, from which we can deduce the reasons for the improved effectiveness of the actives.
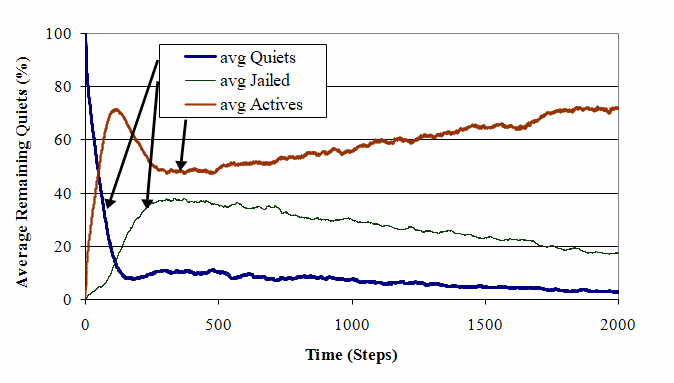
Figure 5 indicates a more dynamical system than the no-strategies case, with three dominant features. The first feature to note is the larger initial ‘growth-rate’ of the actives compared with the no strategies case. This is consistent with the actives having the ability to both avoid the cops (reducing the actives ‘death-rate’) and chase the quiets (increasing the actives ‘birth-rate’).
Having peaked at approximately 72%, the average number of actives reduces for a short period (to about 48%) and then grows linearly (back to 72%) for the remaining simulation time. The reason for the initial decline is that the number of quiets remaining was small and thus the actives could not recruit the quiets any faster than the cops were jailing the actives. Essentially, the active population had reached an unsustainable level. However, in time, those jailed actives were released into the population (as quiets), and Figure 5 indicates that these were immediately converted by the (still relatively large) population of actives.
Cops adopt various strategies
Having examined the possible benefits of using some form of movement strategy for the actives, we now reverse the situation and examine the situation for the cops. Figure 6 illustrates the variation of the average equilibrium percentage of the population that is quiet with the cops’ movement strategy parameter µ, but keeping the actives fixed with no strategy.
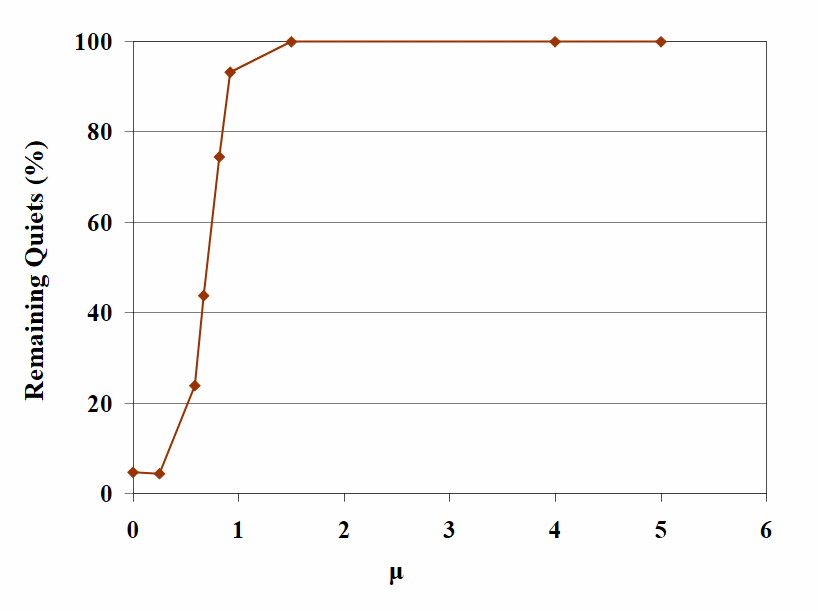
Similar to the case for the actives, almost any strategy for the cops is better than no strategy at all (note the cops are trying to maximise the percentage number of quiets), the exception being very small values of µ (that is, a strong affinity solely to the quiets).
More importantly, Figure 6 suggests that vastly improved effectiveness (in fact 100% effectiveness) can be achieved by the cops if they chose their strategy wisely. Unlike the case for the actives, the preferred strategy for the cops does not lie at a turning point in the graph; rather it lies at an extrema. The graph indicates that any µ value greater than 1.5 will allow the cops to be 100% effective. Hence, the preferred strategy for the cops to take is to almost exclusively chase the actives, and have little (or no) interaction with the quiets.
Figure 7 illustrates the time-series of the population (quiets, jailed and actives), averaged over the 50 replications, for the optimal cops strategy case, from which we can deduce the reasons for the improved effectiveness of the cops.
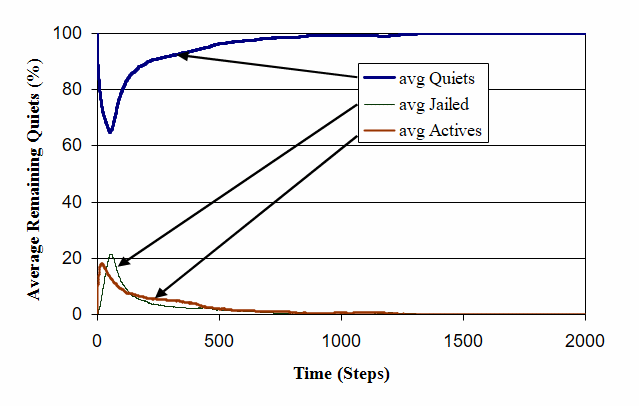
The initial dynamics is similar to the previous cases, whereby the low local cops to active ratios gives rise to an initial growth in the active population. However, with the actives using no strategy and the cops using their optimal strategy, the cops are able to arrest the actives faster than the new actives are recruited and eventually all the actives are removed. The end result is a population with all members quiet.
We also note from Figure 6 that the effectiveness of the cops strategy is extremely sensitive around the value of µ=1, where the cops give equal weighting towards chasing the actives and protecting the quiets. Values of µ<1 (greater emphasis on protecting quiets) tend to yield very poor results while values of µ>1 (greater emphasis on chasing actives) tend to yield very effective results.
Both adopt various strategies
The above analysis has demonstrated that either side (cops or actives) can significantly improve their effectiveness by adopting a strategy. From the baseline (both sides using no strategy) result of 12% quiet population, we have seen how the actives can reduce this to 3% and how the cops can increase it to 100%. However, this has assumed the other side has used no strategy. Of interest here is the interplay that results if both sides are allowed to adopt various strategies.
Figure 8 presents the payoff matrix (again, average equilibrium percentage of quiets in the population) for combinations of λ and µ. Depending on the combination of strategies, any possible result could eventuate. A method for determining a suitable strategy in this situation is provided by the mathematical theory of games [7]. In game theory, there are four criteria that can be used to select strategies. These are pessimism; optimism; least regret; and rationality.
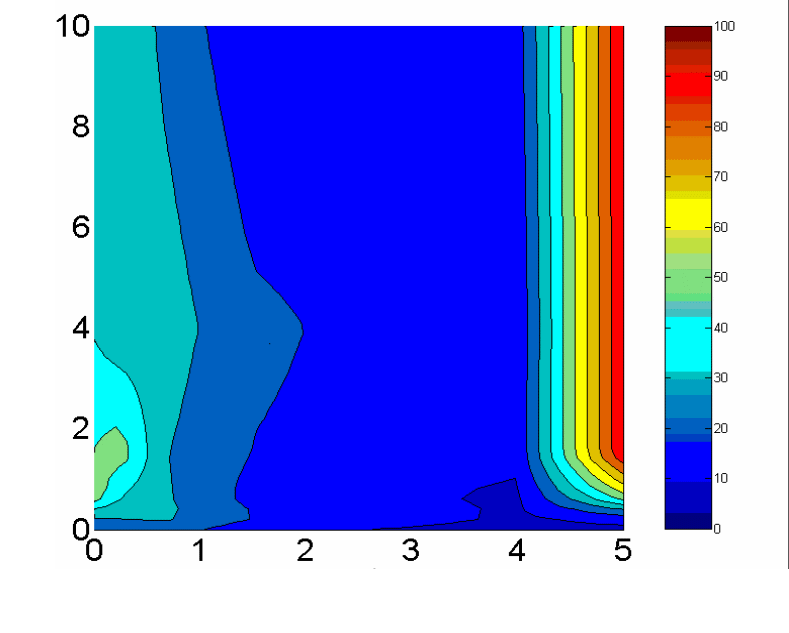
The most common is the first, also known as the maximin or Wald criterion, which represents a conservative decision-making approach. Under this criterion, each side chooses its strategy that offers the best-guaranteed payoff (that is, maximises the minimum payoff). Applying this criterion to Figure 8, we find the preferred strategies for the two sides to be: λ=4 for the actives and µ=5 for the cops. Interestingly, these are approximately the same strategies as determined using the ‘one-player’ versions above. The resulting payoff when both sides use their optimal strategies is an average equilibrium population of quiets of approximately 15%.
Figure 9 illustrates the time-series of the population (quiets, jailed and actives) for this case. The form of each curve in Figure 9 is similar to that in the no strategies case (Figure 4), changing monotonically before quickly reaching equilibrium states. The resulting final quiet population is only marginally higher at 15%. Essentially, the strategies of each side ‘nullify’ the other and the behaviour of the system is similar to that if each side used no strategies.
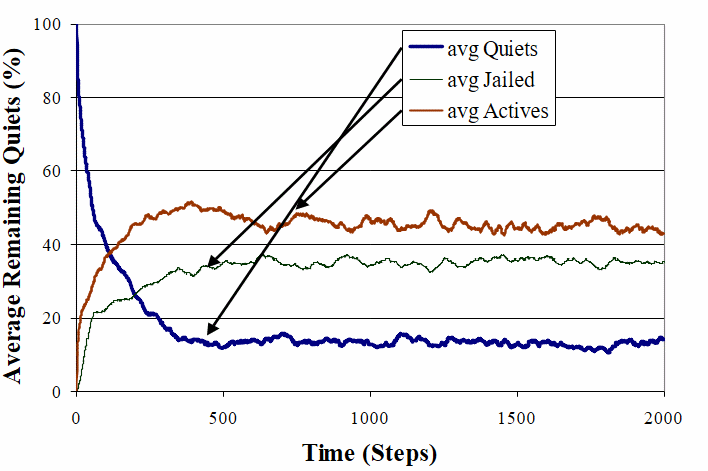
However, there is an important difference in Figure 9. Here, the jailed population is significantly higher (and correspondingly, the active population lower) than in the no- strategies case. Thus, even though the cops effectiveness cops is only marginally improved (quiet population increasing from 12% to 15%), the active population is almost halved (from 78% to 43%).
Resource options
Using the optimal movement strategy for the actives and the cops (λ=4 and μ=5), we varied the jail time of the arrested actives and the number of cops to study the impact these variables have on the system. Figure 10 displays the variation in the average equilibrium percentage of quiets in the population to changes in the jail time.
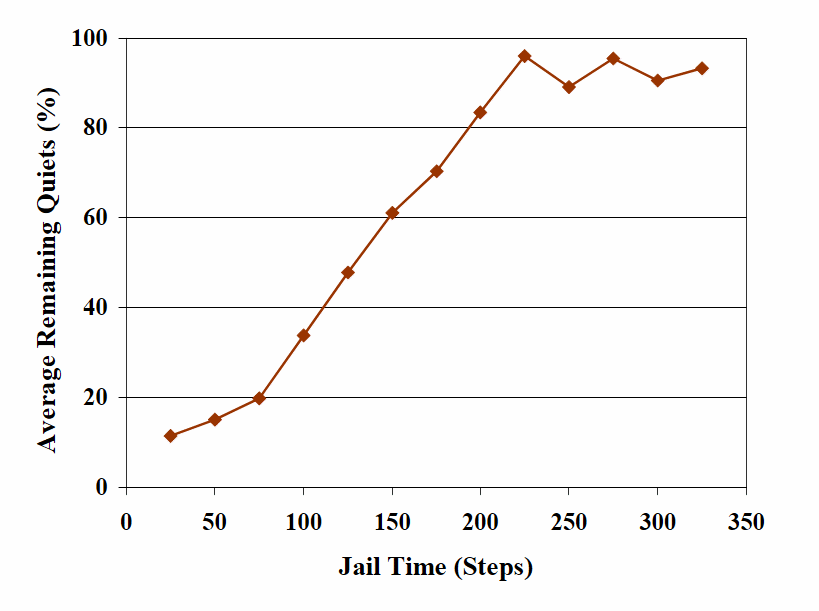
The graph suggests that the effect of jail time is approximately linear. With the default number of cops (12), the default jail time (50) would need to increase by a factor of 4 to 5 to enable that number of cops to be fully effective.
Figure 11 similarly displays the variation in the average equilibrium percentage of quiets in the population to changes in the number of cops.
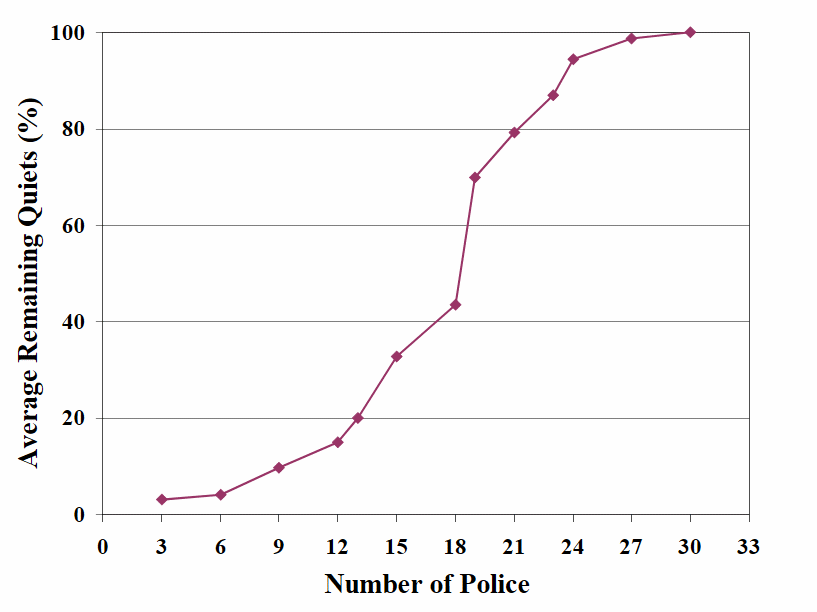
Here we see a less linear response than the variation with jail time. The variation with the number of cops appears to approximate the classical ‘S-curve’ that is characteristic of the principle of diminishing returns. With this, the specific interest is determining the ‘middle’ of the S, which represents the region that provides the maximum increase in effectiveness (the ‘marginal return on investment’). Figure 11 indicates that this region is between 12 and 20 cops.
Summary
The aim of this paper was to develop a cellular automata model of civil violence using the MANA simulation to investigate the impact of various strategies or resource options available to the participants. Statistical and game theory techniques were used to analyse the model output, using the average equilibrium percentage of quiets in the population as the measure of effectiveness. The results for the various strategies are summarised in Table 2.
The optimal strategy for the actives is to have a mixed strategy of generally avoiding the cops but also, to a lesser extent, attempting to mix with the quiet population. The optimal strategy for the cops on the other hand appears to be to simply chase the actives. Table 2 indicates that if one side does not use its optimal strategy, the opposing side can gain a significant advantage. Thus, assuming random movement (as in the Epstein model) removes what appears to be a significant determinant of the system dynamics and behaviour. Future work should therefore concentrate on examining the impact of this on the conclusions drawn from the Epstein model.
The subsequent impact of two alternative options, increasing the jail time of arrested actives, or increasing the number of cops, was then analysed. Although jail time appeared to provide a ‘linear return on investment’, the variation with the number of cops exhibited a non-linear response characteristic of the principle of diminishing returns. This suggests that an investment in additional cops numbers (provided this is not in the ‘tails’ of the curve) might be more effective than a policy of lengthier jail times.
Examination of the time-series plots of the population dynamics revealed two issues that should receive attention in subsequent analytical work. The first is the possible existence of ‘tipping points’ in the system (see the second turning point in Figure 5), which governs whether the situation falls to one side or the other. The other is the possible widening of the measure of effectiveness to include some functional of the number of actives and those in jail (compare Figures 3 and 9) to take a more holistic view of the civil violence scenario.
References
J. Epstein, J. Steinbruner and M. Parker, Modelling Civil Violence: An Agent-based Computational Approach, Working paper, Center on Social and Economic Dynamics, Brookings Institution, 2001.
A. Gill, R. Egudo, P. Dortmans and D. Grieger, “Supporting The Army Capability Development Process Using Agent Based Distillations—A Case Study”, Journal of Battlefield Technology, Vol. 4, No. 3, pp. 24-29, 2001.
M. Lauren and R. Stephen, “Map-Aware Non-uniform Automata (MANA)—A New Zealand Approach To Scenario Modelling”, Journal of Battlefield Technology, Vol. 5, No. 1, pp. 27-31, 2001.
M. Lauren, How Agent Models Can Address Asymmetric Warfare: An ANZUS Collaboration, SimTecT 2002 Conference Proceedings, Melbourne Australia, May 13-16.
M. K. Lauren, “Fractal Methods Applied to Describe Cellular Automaton Combat Models”, Fractals, Vol. 9, pp. 177-185, 2001.
A. Gill and D. Grieger, Verification Of Agent Based Distillation Movement Algorithms, submitted to Military Operations Research for publication, 2002.
N. Vorobev, Game Theory Lectures For Economics And Systems Scientists, Springer-Verlag, New York, 1977.