
Volume 5, Number 1, March 2002
Measuring Technique for the Determination of the Velocity and Spatial Distribution of Shotgun Pellets and Explosively Driven Fragments
- 1 TDW/EADS, Postfach 1340, 86523 Schrobenhausen, Germany.
Abstract
This paper presents a measuring technique by the application of argon flash bombs, which allows photography of fragments or pellets as illuminated points with a simple Polaroid camera. This method enables rapid measurement of fragment or pellet pattern—space and velocity distribution—in acceptance tests in spite of the small size of the fragment, such as only 2.4 mm diameter. This method does not need extensive test facilities, large amounts of test materials, nor protracted evaluation time for the analysis, and can be conducted on a test range.
Introduction
It is astonishing that the rapid and economic determination of the velocity and spatial distribution of fragments or shotgun pellets has remained difficult in spite of all the technical progress in the high-speed photography. This is especially so in the case of acceptance tests of fragmenting ammunitions or pellet shots where a larger number of such test firings are required. This requirement excludes a number of current potential methods.
The test requirements can be summarized as follows:
- Measure the spatial distribution of fragments or pellets of a shot.
- Measure the velocity distribution of fragments or pellets of a shot.
- Velocities between 200 ms-1 and 2,000 ms-1.
- Sizes of fragments or pellets down to 2.4 mm.
- Typical distribution of fragments or pellets at a range of 10m is 1m × 1m, and 3m × 3m at a range of 30m.
- Economical in terms of low investment costs and low material costs for each test.
- Short evaluation time or immediately available test results.
Possible test methods
A short overview on test methods possible in principle with their individual advantages and disadvantages is presented.
Front lighting or shadowgraphs
Short exposure shadowgraphy [1] is a well-established technique for the external ballistics. The possible test set-ups are shown in Figure 1.
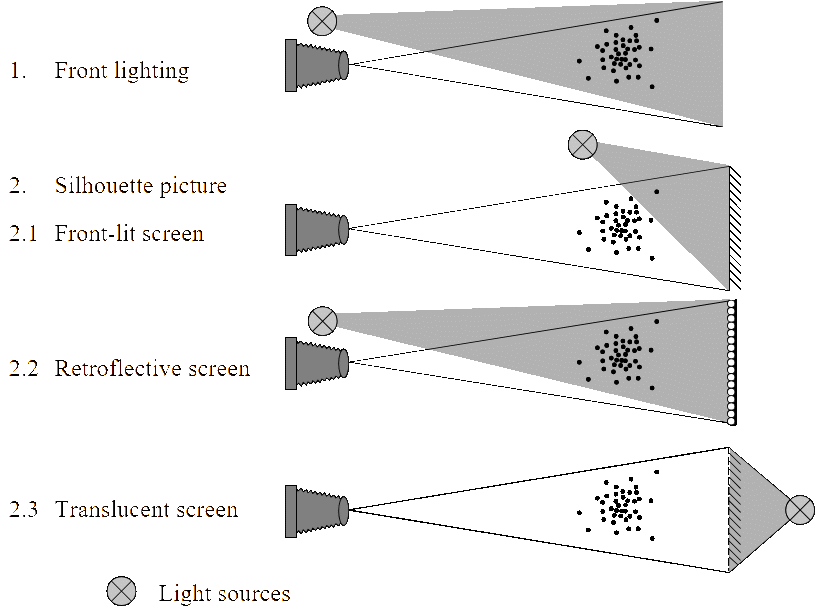
If the moving objects are projected onto a screen by a “point” light source with very short duration and the shadows are photographed, then this method gives not only the shadow of the objects itself but also density changes of the surrounding air around the moving objects [1]. The resolution capability of the camera and film limit the sizes or diameters of the objects in a given observation area. The use of Polaroid films with these methods are not possible because this very sensitive film has a space resolution of only 10–20 line pairs per mm.
Front illumination is a normal way to gain pictures, but the objects must have significant light reflectivity. Either a shutter on the camera or short bright flash can reduce the motion blur.
Using shadowgraphic techniques, any reflectivity of the objects can be neglected. The back screen comprises a simple illuminated white screen, illuminated in front by a light source arranged as near as possible to the lens, or a translucent screen with a back-lit source. In these techniques a very high spatial resolution of the camera lenses is required as the objects are small relative to the large field of observation.
One simple technique to overcome the resolution problem for a camera system is to project the shadows directly on a film, by using a bright point flash light source.
The shadowgraphic technique does not require the use of a camera (Figure 2).
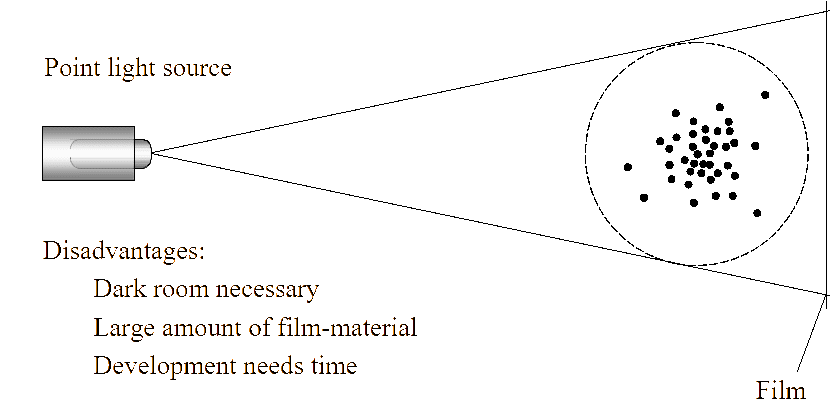
The shadows of the objects, created by a point light source, are thrown directly on to a photographic material or film. It is obvious that this method can only be used in a totally dark room. For an extended object, like the distribution of shotgun pellets, the amount of film material has to be a few square metres and is therefore costly. Developing and analysing this amount of material needs additional time.
Flash x-rays
If, instead of a point light source, a flash X-ray source is used (also with pulse durations of less than 0.1 µs), the tests can be conducted in full daylight and only the film itself has to be installed in film cassettes such as those typically used in flash X-ray (FXR) techniques and in medicine (Figure 3) [2].
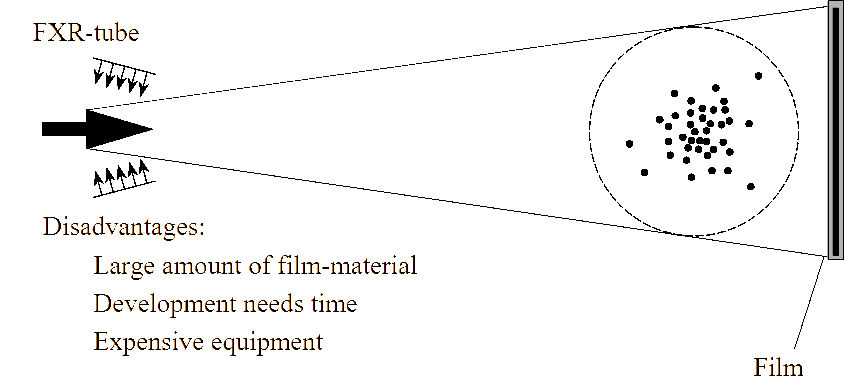
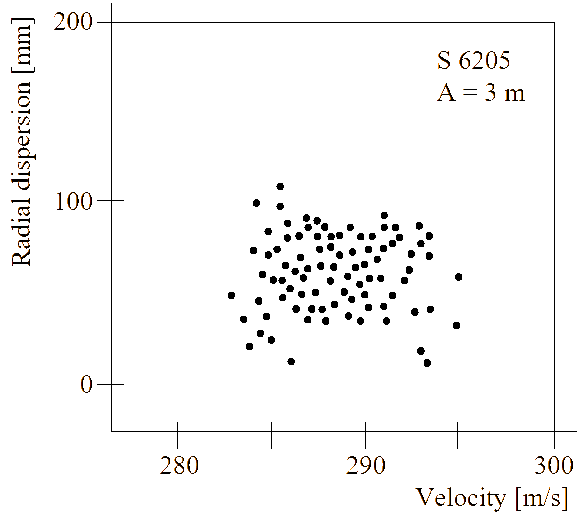
But this technique needs the same large amounts of film material, developing time and analysis of the films as described before. While these costs may be acceptable from a single test, they are inappropriate for acceptance tests. In addition the investment costs for a flash X-ray unit are high. Figure 4 and Figure 5 give the spatial and velocity distribution of 4-mm lead pellets fired with 1/2 choke at 3-m distance. The height of the fragment cloud is about 100 mm and the velocity spans between 283 ms-1and 295 ms-1 in Figure 4 and between 292 ms-1 and 297 ms-1 in Figure 5.
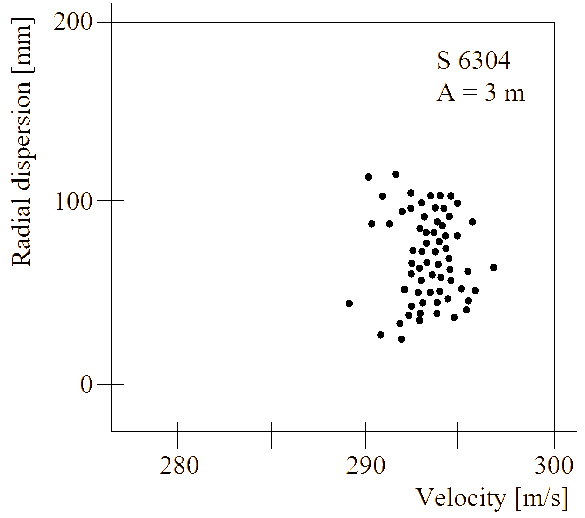
Figures 6, 7 and 8 (achieved using FXR technique) show the spatial and velocity distribution of lead pellets (4 mm, 3 mm and 2.4 mm respectively) of different ammunitions fired with 1/2 choke at a range of 10m.
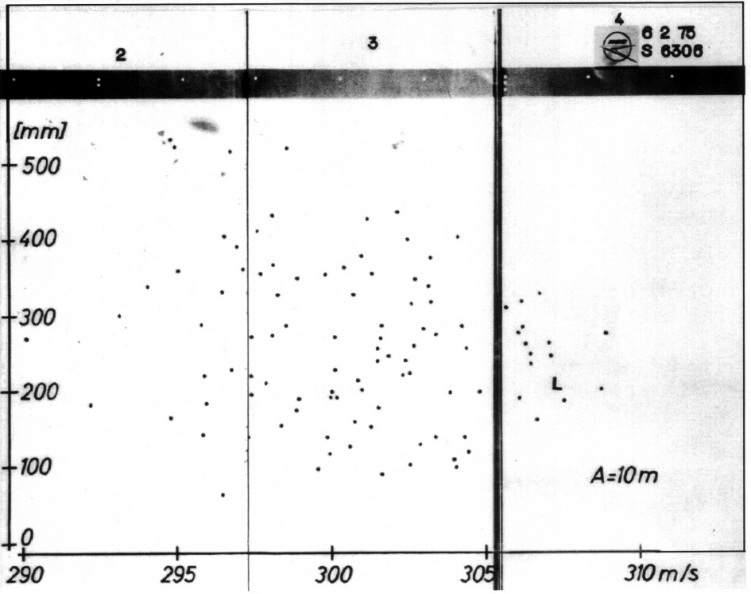
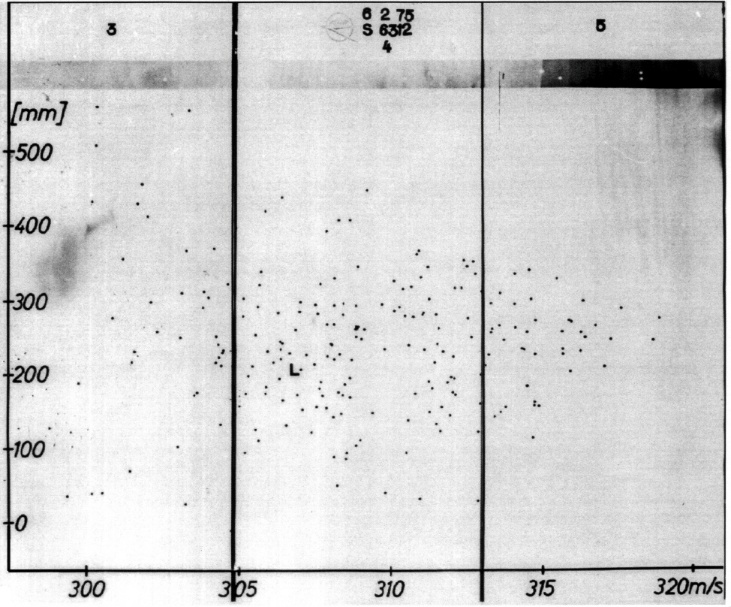
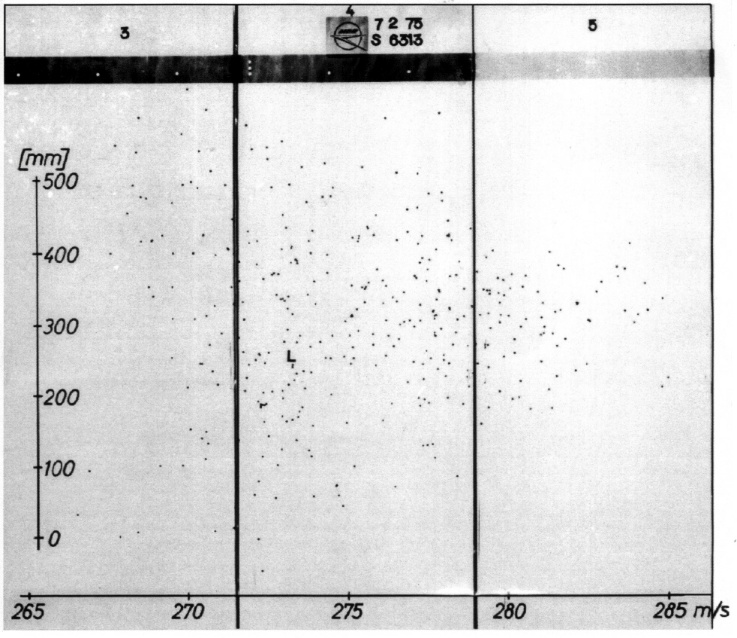
The smaller the pellets the larger their number and the more difficult it is to analyse the details on film. However, as demonstrated in Figures 4 to 8, this is possible.
To catch these pellet distributions in height and in velocity on the film (without knowing the velocity distribution exactly) six films were used, each 300-mm wide and 900-mm long. The figures present only the selected filmstrips that show the lead pellets.By knowing the time difference between the launch of the pellets from the barrel and the trigger of the flash X-ray units, the velocity of the individual pellets can be calculated. The spatial distribution can be read directly from the pictures taking the magnification factor into account.
A film size of 200 mm × 200 mm would be sufficient at a range of 3m as shown in Figure 4. In order to get the pellets at a range of 10m the film size should be at least 500 mm × 1,000 mm, as demonstrated in Figures 6, 7 and 8. At a range of 30m the dimensions have to be three times larger, which would give an area of film of 1,500 mm × 3,000 mm (4.5 m2). Further to the large amount of film material, two flash X-ray units should be used, because the illuminated area opening angle is then approaching the limit of the flash X-ray tubes.
New method
A schematic view of the proposed new measuring technique is given in Figure 9. Objects appearing as point-source ‘stars’ if they are very strongly illuminated by an argon flash bomb. Such ‘stars’ can be easily photographed with a camera with poorer resolution and also with a film with low spatial resolution.
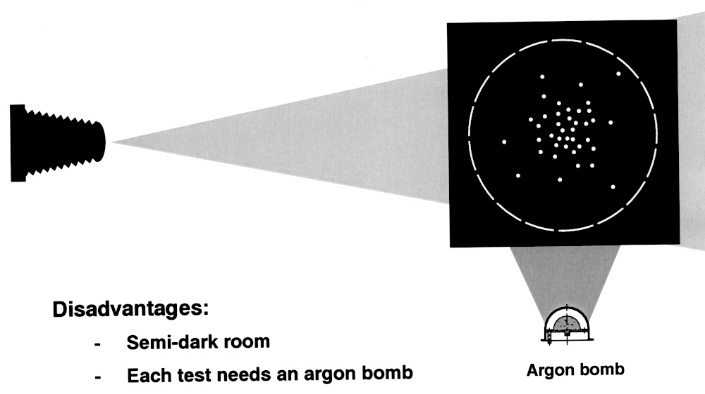
The shotgun pellets are intensively illuminated perpendicular to their flying direction by a detonative light source, a so-called argon flash bomb. The light scattered from these small objects is used as secondary point sources and photographed with a Polaroid camera. The ‘stars’ on the picture do not have any significance to the object in size or diameter but they can be used to determine their location and, with the knowledge of the time difference between the shot and the flashlight, the mean velocity of the individual pellets can be defined. The disadvantages of this method are the necessity that the test has to be made in a partially dark room; that the argon flash bomb can be used only once; and that the use of high explosive charges, even small amounts, needs a test range where high explosives can be handled and detonated.
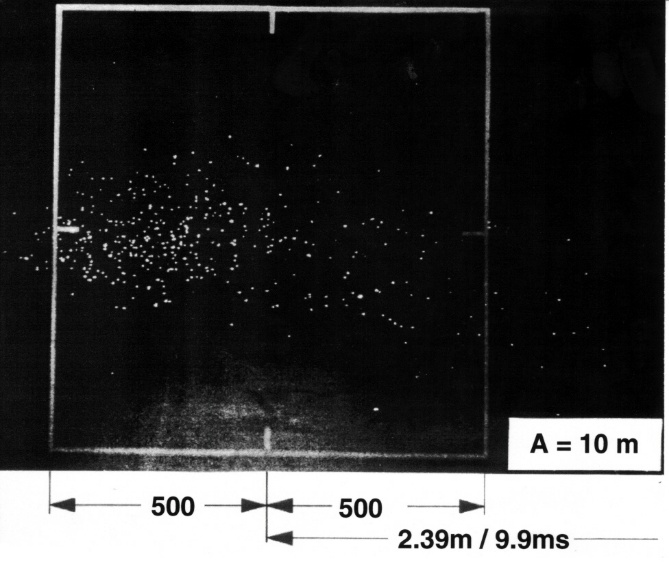
Figure 10 demonstrates that this method also gives good results with the 2.4-mm pellets. The area of more than 1m × 1m was illuminated. The time difference was 9.9-ms between the light barrier and trigger for the argon flash bomb and separated by a distance of 2.39m.
Detailed description of the argon flash bomb method
Argon flash bombs
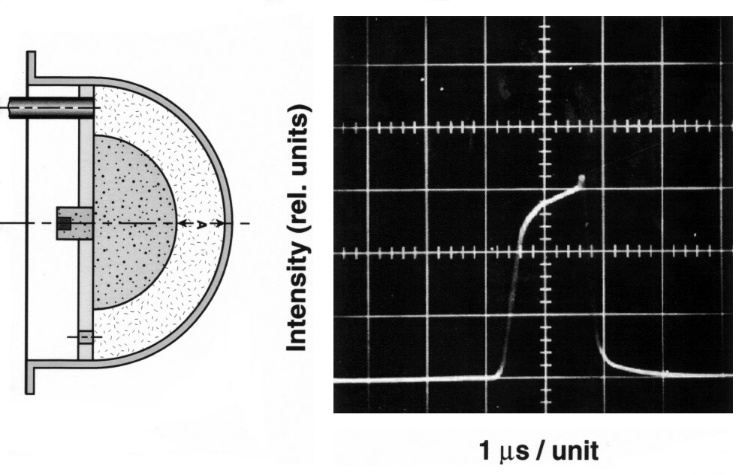
So that small objects can be photographed as stars, extremely bright flash light sources have to be used. One option is a detonative light source with short duration [3]. If the shock wave of a detonating charge is passing a noble gas, like argon, an extremely bright light is emitted. As soon as the strong shock wave hits the transparent cover (such as glass or plexiglass), the cover breaks and reduces its transparency. The shock wave, now reduced in strength, passes into the air and the strong light output ceases. The design of the argon flash bombs used is shown in Figure 11 and illustrated at Figure 12.
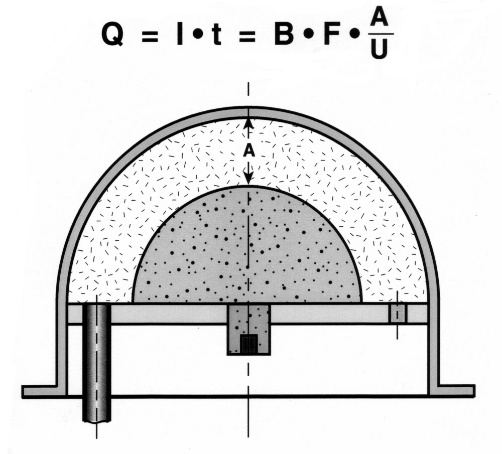
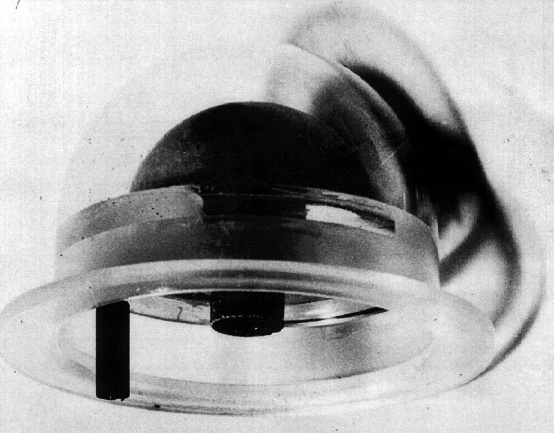
A hemispherical high explosive charge is installed in a hemispherical shaped plexiglass casing. For the initiation a booster is installed in the centre. The nearly spherical detonation wave arising from the surface of the high explosive charge induces a strong shock wave in the surrounding argon atmosphere, which emits light with an intensity of about 2×10⁷ Stilb [4]. As soon as the shock wave in the argon arrives at the hemispherical plexiglass casing, the light emission is reduced dramatically by a mechanism that is poorly understood.
The light duration can be calculated by the layer thickness, A, of the argon atmosphere divided by the shock wave velocity in that atmosphere, which is about 8 km-1.
Figure 13 shows the registration of the light emission of an argon flash bomb with an argon gap A of 10 mm. This light source gives a rise time of about 0.3 µs, followed by a small increase in intensity over a time interval of 1.0 µs and a decay time also in the range of 0.3 µs. The ≥50% light-emission period is about 1.2 µs, which accords with the calculation of 10-mm argon width divided by 8 mm/µs shock wave velocity giving 1.25 µs.
The reasons for the non-rectangular profile of the light emission can be explained by the framing and streak record of the light emission of the argon bomb, taken by a rotating mirror camera. The frames of Figure 14 were achieved with 2×10⁶ frames/second using a CORDIN 200 rotating mirror camera with an argon-filled gap of 10-mm width. From the upper left to the lower right corner, Figure 14 shows that the upper half circle starts a little faster and diminishes earlier. The light of the shocked argon has profoundly over-illuminated the film. The residual glow of the reaction products can also be seen on this highly sensitive Polaroid film.
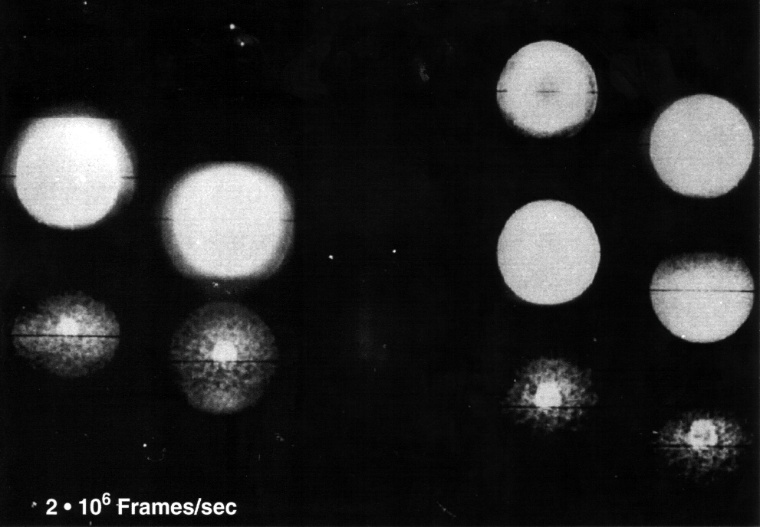
But definitely we have some afterglow with drastically reduced intensity after the shock wave has reached the plexiglass surface. The horizontal black line in the middle of the frames is used for the streak records, which is turned 90° in Figure 15. The horizontal black line in the frames is the streak slit which is used for the streak record shown in Figure 15. The horizontal line is depicted vertically. It clearly shows that the radial breakthrough from the booster charge of 15 mm diameter occurs about 0.5 µs earlier than the axial breakthrough, and the subsequent increasing diameter, from charge to plexiglass cover, as the radially expanding shock wave excites the argon layer.
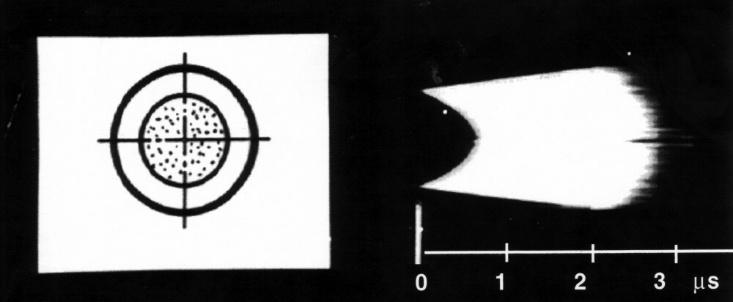
A first breakthrough starts in this streak record on the upper and lower part. This can be explained: the detonation wave from the 15-mm diameter booster arrives first at the sides of the hemisphere and about 0.5 µs later at the axis. The same happens as the shock wave arises first at the hemispherical plexiglass cover. The emission area increases from the radius of the high explosive charge to the internal radius of the hemispherical plexiglass, which is visible on the streak record as the inclined contour. The total light emission duration for the 10-mm argon gap is about 2.8 µs.
To produce a more rectangular light profile, the charge has to be initiated closer to the centre of the hemisphere or this behaviour has to be taken into account by using an elliptical outer contour for the high explosive charge rather than a hemispherical shape.
The reaction products of a detonating high explosive charge give a light source of low intensity but over millisecond time durations, about 1,000 times longer duration compared to the argon flash bomb.
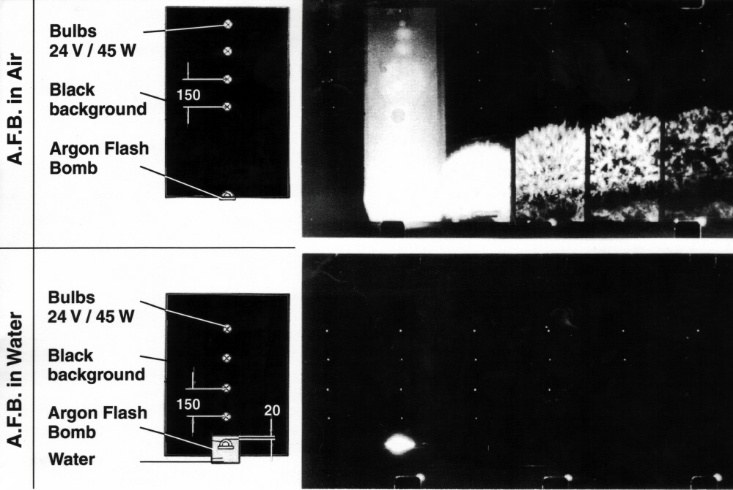
With an open shutter camera the microsecond output of an argon flash bomb can be degraded by the continuing low intensity millisecond light output of its explosive products [5]. If the argon flash bomb is set under water, this long duration afterglow of the products of explosives is eliminated. This is well demonstrated by comparing the HYCAM pictures gained with 10,500 frames/sec for an argon flash bomb detonating in air and in a small aquarium (Figure 16). The expanding products of explosives continue to produce some light for relatively long duration, but of less magnitude compared with the short argon flashlight due to the traversing shock wave. The glow of the reaction products can be avoided if the argon flash bomb (AFB) is set in a water pool.
Measurement of the pellet distributions
The test set-up and electronic circuit schematic is shown in Figure 17. With the opening of the camera shutter ((1), (2) and (3)) the gun will be fired (4) and (5). The pellets on passing the light barrier (6) trigger the delay generator system using a Tectronics oscilloscope (7a) which provides the required delay prior to firing the argon flash bomb (8), (9a) and (10). The time difference is independently measured with a 1-MHz counter (signals at (7b) to start, (9b) to stop).
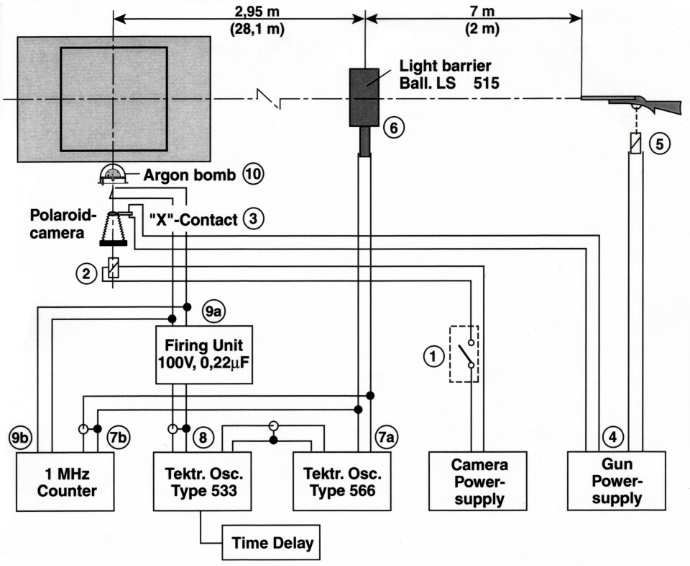
The firing switch (1) connects the camera power supply with the magnet (2) for the Polaroid camera shutter. The X-contact (3) of the Polaroid camera switches the riffle power supply (4) on, which activates the pullmagnet (5) of the rifle. The pellets, on passing a light barrier (6)—Drewell LS515—trigger a time delay system (7a) and a 1-MHz counter (7b). The time delay system now triggers the output signal (8) after the preselected time, and the firing units (9) which have 100-V and 0.22-µF output (9a) then initiate the fast reacting detonator KX1/20 at the argon bomb (10). The time difference between the trigger impulse from the light barrier to the output of the firing signal (9b) was measured with a 1-MHz counter. Therefore the velocities of the pellets can be calculated from the travel distance between the light barrier divided by the time difference between the trigger signal and the argon flash light.
Figure 18 shows the double-barrelled shotgun (Cal. 12/70) with 1/2 and 1/1 (full) choke with the light barrier, Polaroid camera (Oszillophot NZ), the argon flash bomb immersed in water, the background in matt black with the markings of 1m x 1m and the targets to the right. A shutter exposure time of 1/50s can be used which requires a very sensitive film that needs a semi-dark environment.
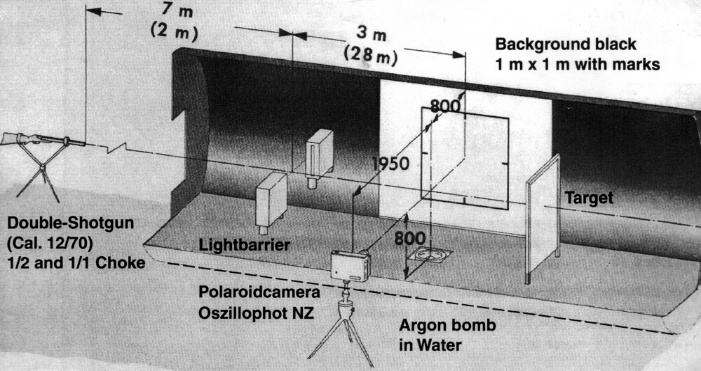
The distances on top are given for the firings at a range of 10m, and in brackets for firings at 30-m range. The pictures were taken in a semi-dark room. The pictures obtained are presented in Figures 19 to 21 of different ammunitions fired with 1/2 choke at 10-m range from the muzzle of the gun, with 2.95-m separation of the light barrier to the middle of 1-m2 observed area with the following details:
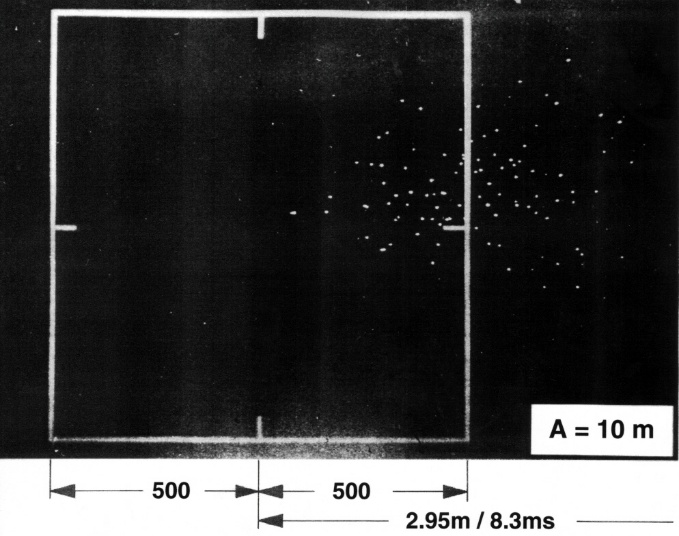
- Figure 19: 4-mm pellets—8.3 ms time difference;
- Figure 20: 3-mm pellets—9.7 ms time difference; and
- Figure 21: 2.4-mm pellets—9.9 ms time difference
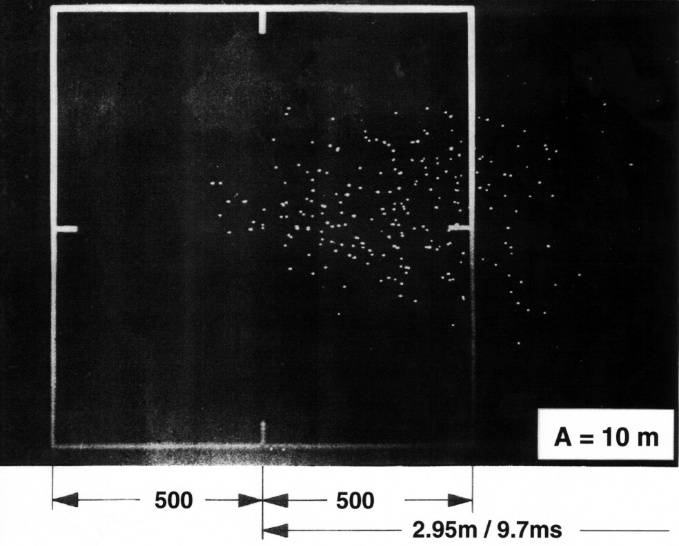
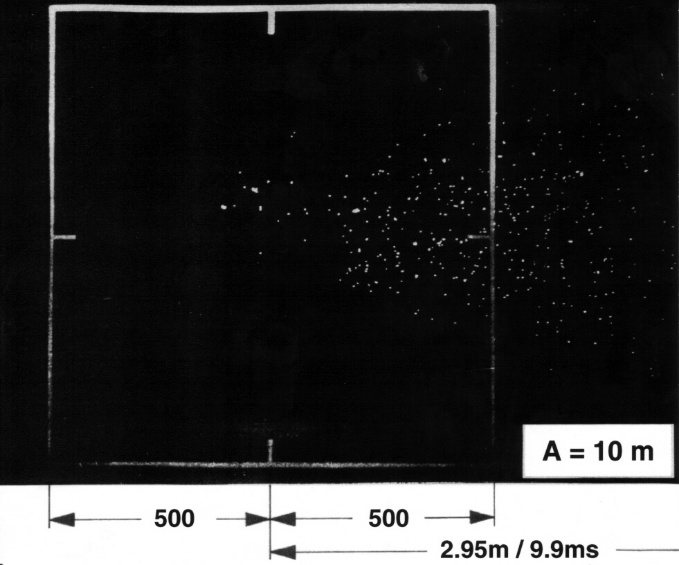
All these pictures give a clear indication of the pellets, even at only 2.4-mm diameter. This seems to be the practical lower limit of the pellet size with the tested arrangement. At about 30m distance between the muzzle of the gun and the observation area, the picture of the pellet distribution will no longer be clear. At this greater distance from the camera, the “stars” have to be observed in an area that is nine times larger, with the result that the light intensity decreases.
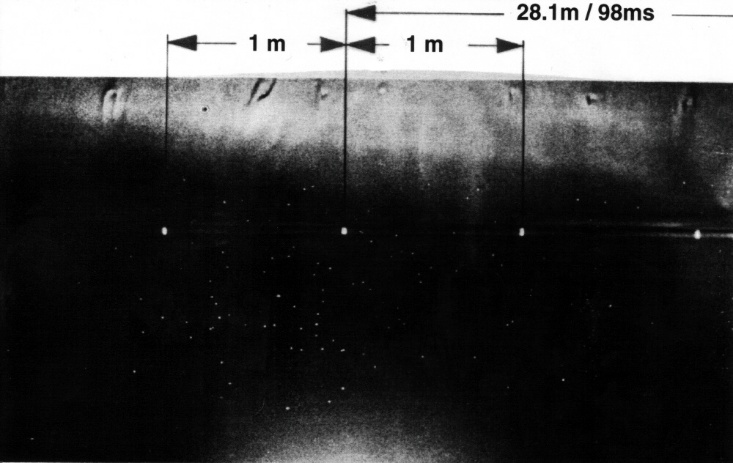
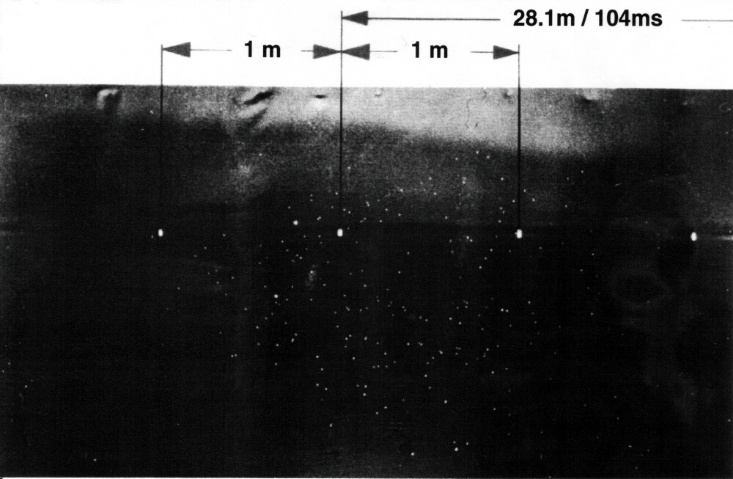
The 4-mm and 3-mm pellets can be seen relatively well after around 100 ms time difference (Figures 22 and 23). But after a time difference of 112 ms, the 2.4-mm pellets are on the limit with the used configuration (Figure 24). The light barrier (6) was about 2m away from the muzzle of the gun. The delay times are counted from the light barrier to the argon flash bomb, arranged 28.1m behind the light barrier.
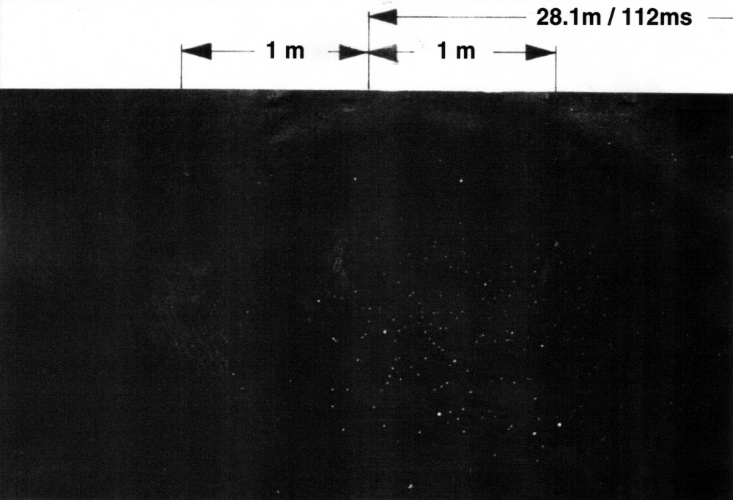
For these test conditions an argon flash bomb with a greater light intensity should be used as well as a longer duration to guard against misinterpretation from some failure points on the Polaroid film. It would be useful to use a longer duration to get short lines which would be then more representative compared with a point for a pellet or fragment. But the technique for using argon flash bombs with time durations of 10–20 µs has not as yet been tried to illuminate a field of view of 2m × 4m.
Conclusion
It was demonstrated that if, the objects are effectively point-source “stars” because they are intensely illuminated, then small objects can be photographed regardless of the resolution of the lens or the demagnification of the film even though their proper resolution would fail to give a direct picture. This was demonstrated with very good results in an observation field of 1.5 m2 but was on the limit if the observed area was 2m × 4m at 30-m range from the muzzle of the gun when 2.4-mm pellets were photographed.
This technique can be improved with a more powerful lens (that is, a lower f number), more light intensity, or with argon flash bomb sources with more power and longer durations so that exposure is increased.
The demonstrated technique has the advantage that it can be analysed immediately.
Further improvements are possible if, instead of using a Polaroid film, current CCD-cameras are used owing to their very high sensitivities compared with high-sensitivity films. Additionally, instead of using argon flash bombs with detonating high explosives, Q-switched lasers could be used for the same purpose, although their investment costs could be a financial problem.
References
P. Fuller, “Project Design and Planning” High Speed Photography and Photonics, 1997.
M. Held, “Flash Radiography”, Tactical Missile Warheads, 1993.
M. Held, “Selektives Stroboskop”, Proceedings of the 8th International Congress on High-Speed-Photography, Stockholm, Sweden, 1968.
C. Winning and H. Edgerton, “Explosive Argon Flash Lamp”, Journal of the SMPTE, 59, 1952.
H. Muraour, “Sur l’utilasation des rencontres d’ondes de choc dans l’argon comme source lumineuse brève et puissante”, Mémor Artillerie Francaise, 1949.