
Volume 3, Number 2, July 2000
A Systems Approach To Defence Procurement
Abstract
Using this white-box approach, it seems possible to approach procurement by identifying the performance and other characteristics of equipments as they contribute synergistically to overall C3I effectiveness. This leads to performance measures for equipments being seen, not as individual quantities, but as interactive contributors to overall effectiveness. Since the simulation also represents costs of maintenance and support of technology, bespoke or COTS, it is also possible to determine the overall value of COTS versus bespoke on a scientific basis. The approach also enables radical tradeoffs to be explored. For instance, it may be possible to trade-off the cost of command team training against the cost of enhanced weapons.
Introduction
With the increasing complexity of, and reducing budgets for, defence procurement, there is a need to take a formal systems-scientific approach in this area. This should involve:
- Looking at the whole system where the boundaries that define the whole system are sometimes difficult to define.
- Balancing the parts to optimise the whole. Candidate parts include:
- Performance of individual equipments, to optimise the overall defence system effectiveness, although there seems to be no universal agreement as to how effectiveness should be measured.
- Cost of various contributing parts and of the whole.
- Value, also of various parts, in how much they contribute to overall effectiveness.
Under present defence procurement methods:
- Procurers may consider individual equipments/weapons as discrete projects, with their responsibility being to get "the best" from the contractor(s). Unfortunately, as we shall show, getting the best for one project may act against getting the best for the whole weapon system, and may impair overall effectiveness.
- Procurers (and modellers) generally omit humans (operators, commanders, and maintainers) from the equation. In practice, however, the contribution to military success is very largely dependent on such operators and decision-makers.
- Procurers and analysts may omit real-time interactions between sensors, weapons, communications, operators, and so on, thus limiting any analysis.
There is evidently a strong case for a system-scientific approach to defence procurement. We have been researching into how that might operate, and have developed prototypical methods to address the issues. In particular, we have applied systems science methods.
Procurement
What to procure, and how best to procure it, have been major issues in defence since WWII. One major problem is that of specifying the requirements for a system many years in advance of delivery, such that it can be manufactured, supplied, supported in operation and – most important of all, perhaps – that it will operate effectively should the need arise. There is, after all, little point in procuring equipments and weapons that prove ineffective when used in anger.
Meantime, everyone would like defence procurements to cost less or at least guarantee value-for-money – however defined. This raises a major current issue – bespoke versus commercial-of-the-shelf systems COTS. Should the armed forces procure and deploy (COTS), or are they better off sticking to the traditional bespoke systems? In many ways, the dilemma is the same as that faced by a lady or gentleman who needs a new suit:
- A bespoke tailor will make a suit to measure, it will take time, several fittings may be necessary, and it will be expensive.
- Off-the-peg suits are available right now, cost less, and can be made to fit by judicious tweaks with the scissors, needle and thread—which takes a relatively short time.
The defence situation is similar, except that the time delay can be much greater:
- Bespoke Procurement: traditional, secretive, customer requirements based, takes up to 20 years, expensive.
- COTS: commercial, open market, “try-before-buy,” instant(?) availability, cheaper, also continually upgradeable (c.f. personal computers).
Which is best, bespoke or COTS? What does "best" mean? How to tell? How does one measure effectiveness? Importantly, if all the various equipments, operator, commanders, etc., mutually interact and influence each other continuously, how can one observe the consequent emergent properties, capabilities and behaviours of the integrated whole?
Emergence and effectiveness
Emergence
Any systems approach focuses on emergence. Originally, emergent properties were those properties of a system that "emerged" due to interactions between the parts of a system. There was a sense of the unexpected, or counter-intuitive, about emergent properties, and emergence is strongly identified in system theory with hierarchy [1].
More recently, the idea of emergence has been expanded to include emergent properties, capabilities and behaviours (PCBs):
- Properties are those observable and measurable features that can be seen or deduced from outside the system, such as all-up-weight, overall failure patterns, colour, centre of gravity, and so on.
- Capabilities define the envelope of what the system is able to achieve, and might include maximum altitude, top speed, maximum fire rate, and so on, and these are identified with conditions under which the capability might be observed.
- Lastly, Behaviours identify the way in which the overall system responds to stimulus, and might include reaction times, rules of engagement, and so on.
From this latter viewpoint, many emergent PCBs might be rather obvious and are termed "mundane", while others are counter-intuitive after the original style. Procurers often identify many emergent PCBs as requirements in procurement specifications, such as availability, survivability, and performance.
Within a real weapon system, with operators, decision-makers, sensors, communications, processors and weapons, there are very many interactions. Identifying the emergent PCBs of the whole system is complex, yet vital in understanding how the system works and what makes it effective.
Effectiveness
Effectiveness is the effect that one system has upon another: it is an external measure of what the system does, rather than what the system is. Operators and politicians tend to view effectiveness either in terms of cost exchange ratios, or as casualty exchange ratios. Procurers, on the other hand, seem to prefer cost effectiveness, or value for money—which appears to be broadly the same thing.
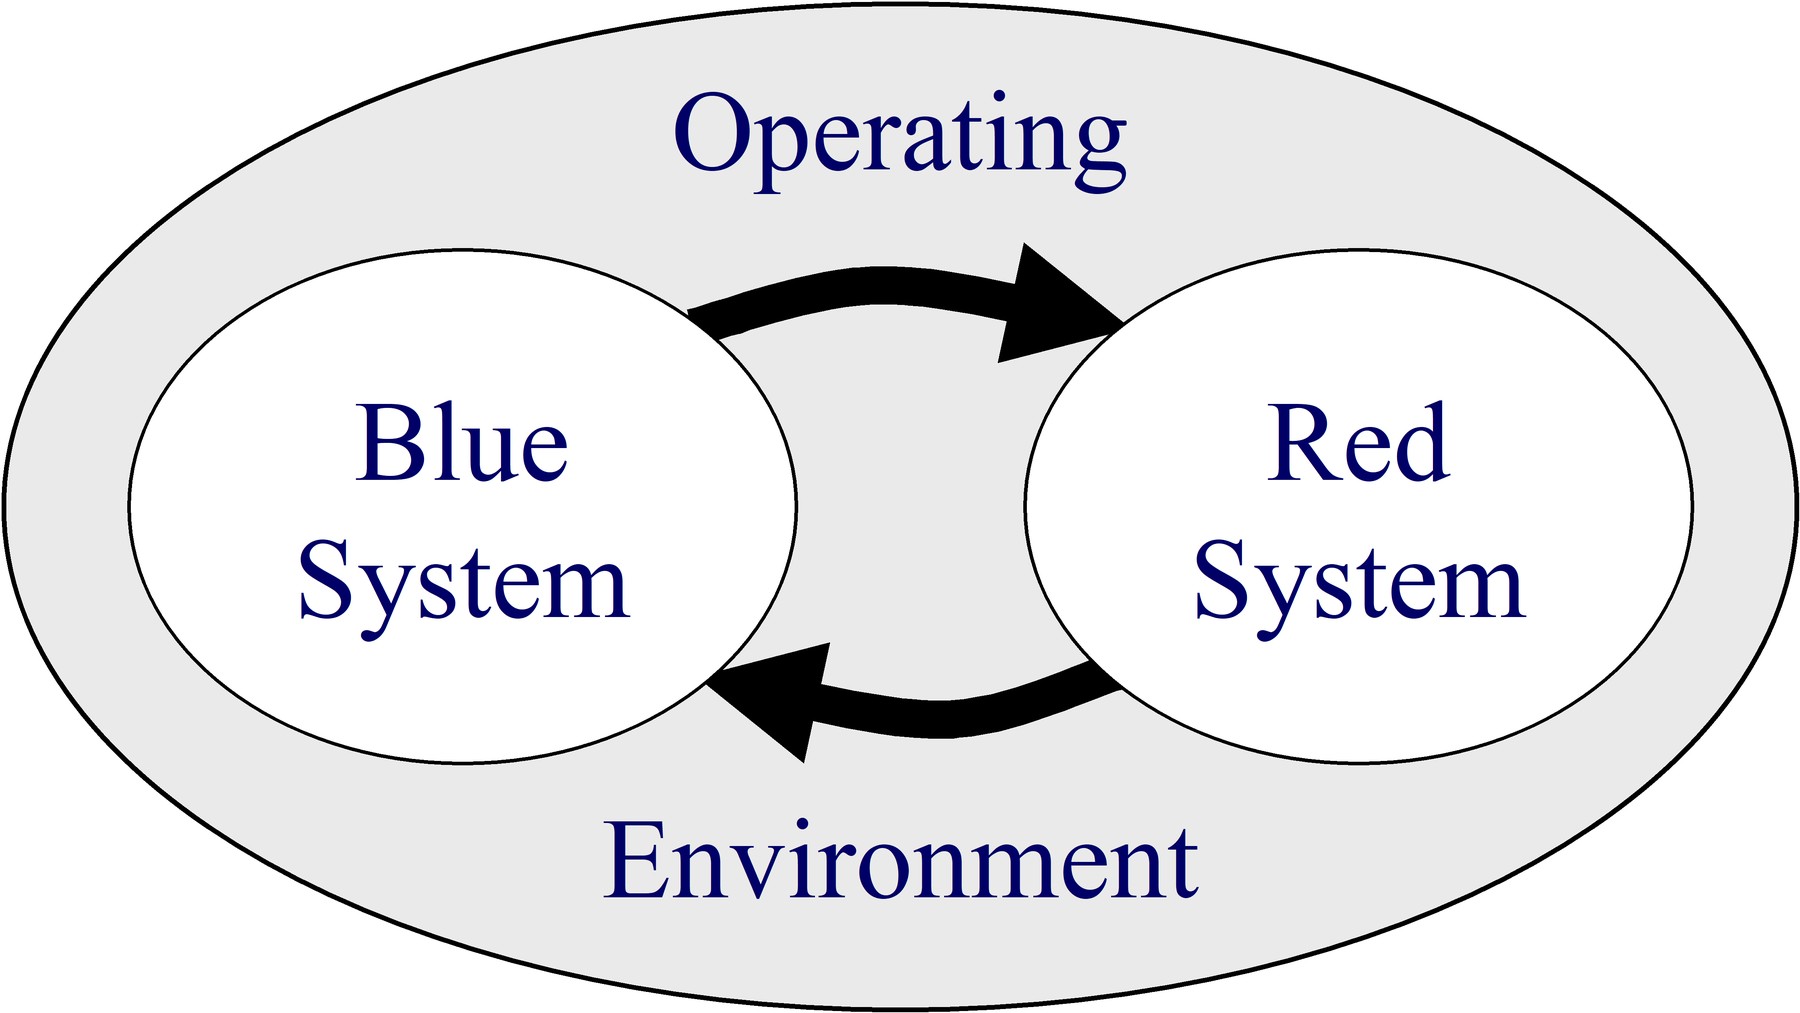
Figure 1 shows the basic concept of effectiveness. Two systems are seen interacting in an environment. Blue system has some effect on Red system, which is changed because of it. Red system’s similar effect on Blue is also changed, altering Blue system; and so on. It is possible to measure Blue system's effectiveness, but only in the context of Red system, their mutual interactions and their respective operating environment. Moreover, Blue effectiveness is seen as: a) dynamic, continually changing; and b) an emergent property of Blue system.
Predicting effectiveness -two methods
Figure 2 shows two quite different approaches to measuring effectiveness, the so-called black box and white (or glass) box approaches. An illustrative example of a black box method is shown at the top. Subject matter experts (SMEs) provide knowledge, in this case about C3I, from which Capability Performance Metrics (CPMs) are derived covering various aspects of a command system’s operation, such as picture compilation and situation assessment. Each metric is defined with scales and units, and is assigned a value for the particular C3I system being assessed. These values are combined in a weighting scheme, employing some form of multivariate analysis, such as Multiple Criteria Decision Analysis (MCDA) [2], to establish an overall figure of merit; that is, a measure of effectiveness for the C3I system with a particular set of CPM values and weights.
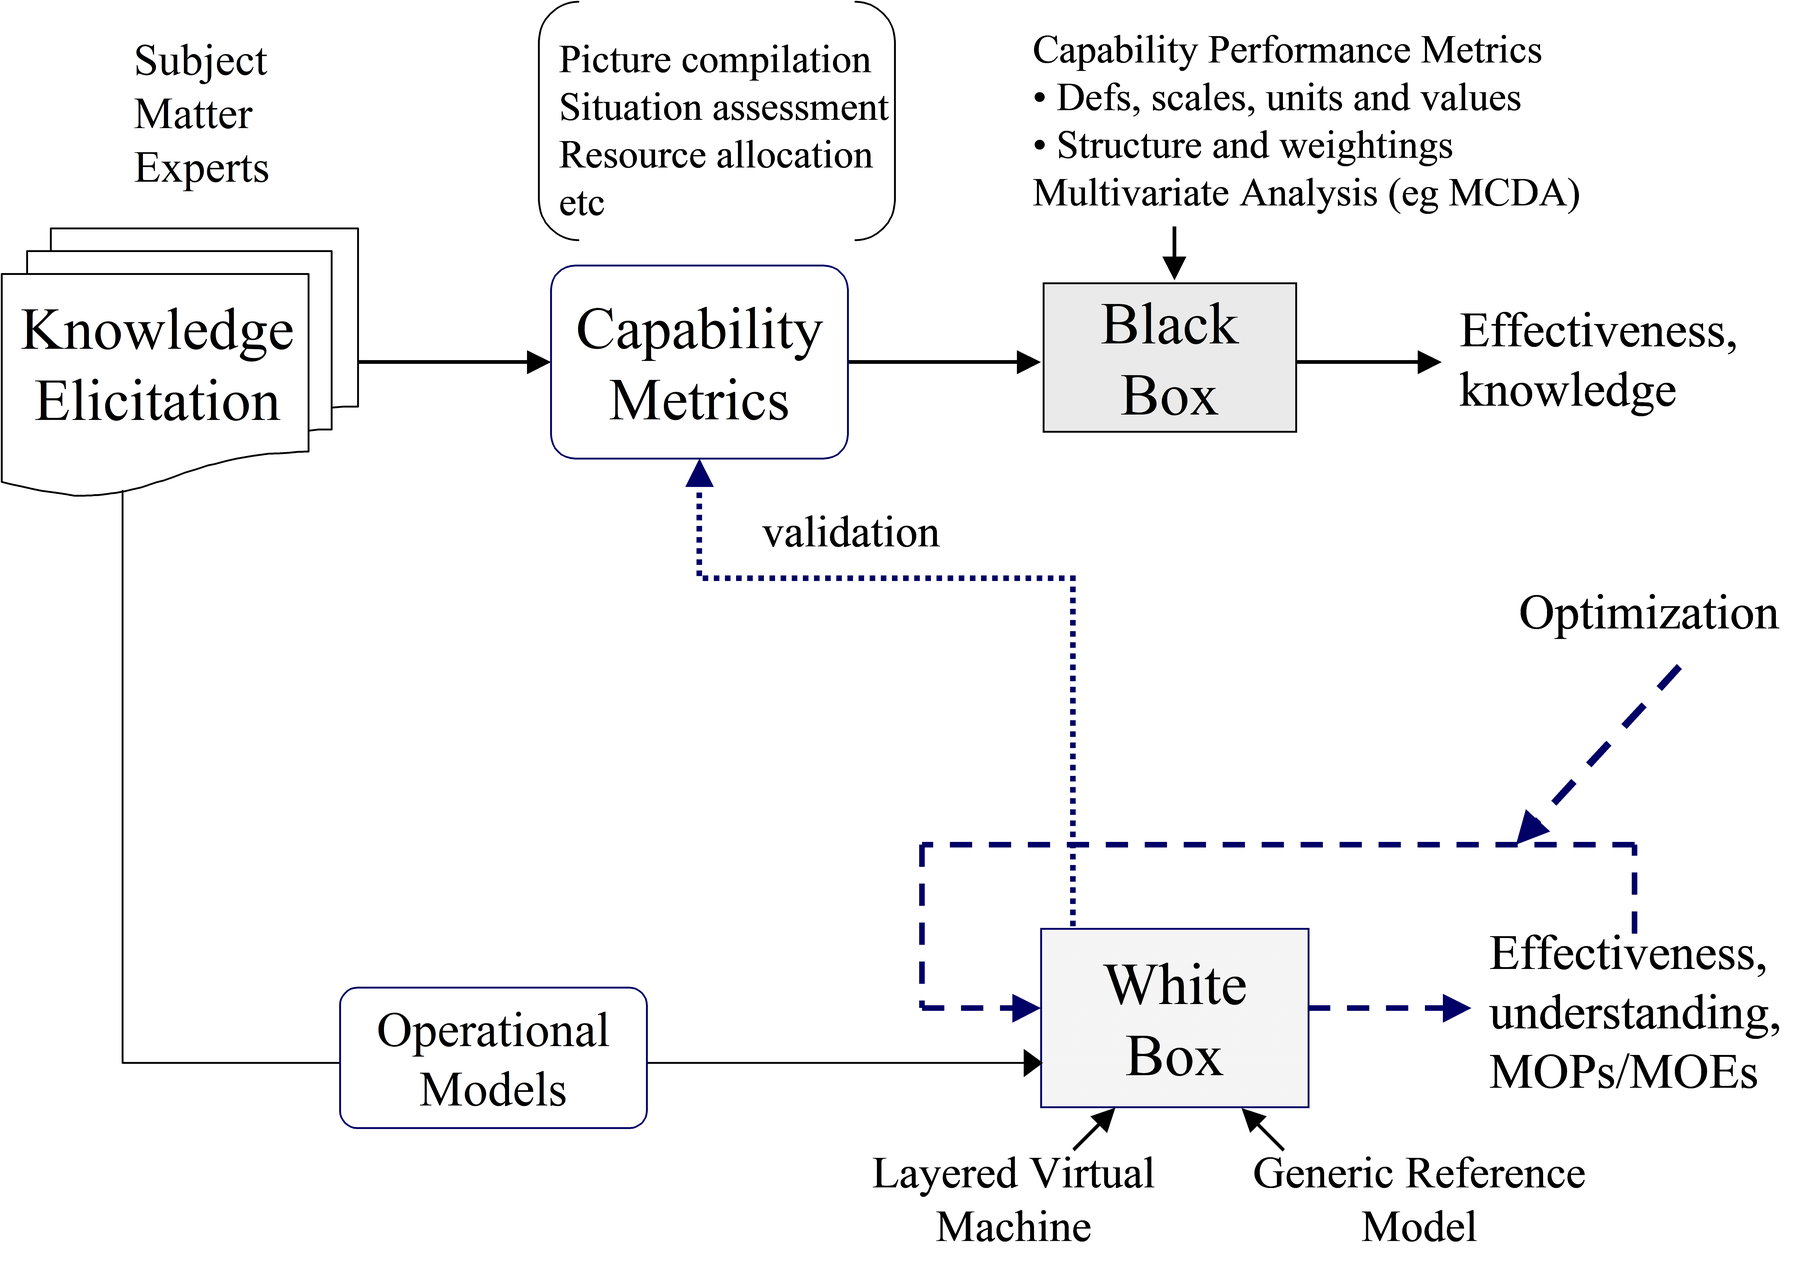
The white box method works quite differently, as illustrated in the lower half of Figure 2. A dynamic representation of the whole system is constructed, with all parts and parameters visible and adjustable (hence white box, implying open and visible). Interactions between the various parts are included, together with representations of operators and decision-makers. The parts and interactions are adjusted so that the emergent PCBs of the whole coincide with the real world. In order to achieve this, SME’s must provide C3I knowledge in a form that allows operational models of a C3I system to be constructed.
Using the white box approach, it is then possible to observe how a defined set of Measures of Effectiveness (MOEs) are related to Measures of Performance (MOPs) of individual equipments, for specified operational scenarios. Command CPMs can be generated as an output, rather than elicited as input, and used to validate the white box model. It is even possible to adjust the various technology parameters to optimise overall system effectiveness, in some MOE-defined sense, and so to determine the optimum MOPs for each equipment as part of the set, rather than in isolation. The white box approach, therefore, qualifies as a system approach.
In this paper we present a particular white box modelling approach that is founded upon the idea of using a Layered Virtual Machine, more commonly found for structuring complex software systems, to provide a framework for modelling the interaction between technology, people and process within a C3I system. Within this framework, the Generic Reference Model, which is an established technique for representing a wide variety of systems, has been employed to model these three C3I component layers, in order to determine the PCBs of the overall C3I system. In order to explain this approach, the following sections of this paper:
- introduce the Layered Virtual Machine (LVM),
- introduce the Generic Reference Model (GRM),
- combine the two into a Layered GRM (LGRM),
- show how the LGRM can reveal emergence and measure effectiveness, and
- explore the effect of COTS versus Bespoke on naval C3I Effectiveness.
Layered virtual machine
The Layered Virtual Machine (LVM) is a widely established technique for managing the complexity of software and hardware interactions that take place in a computer system [3]. A simple example of this is illustrated in Figure 3. Typically, at the lowest level, we might represent the computer hardware as a layer upon which an operating (software) system executes. This operating system will manage the hardware resources, and may provide common services, such as communications and data management, to the application software that resides in higher-level layers.
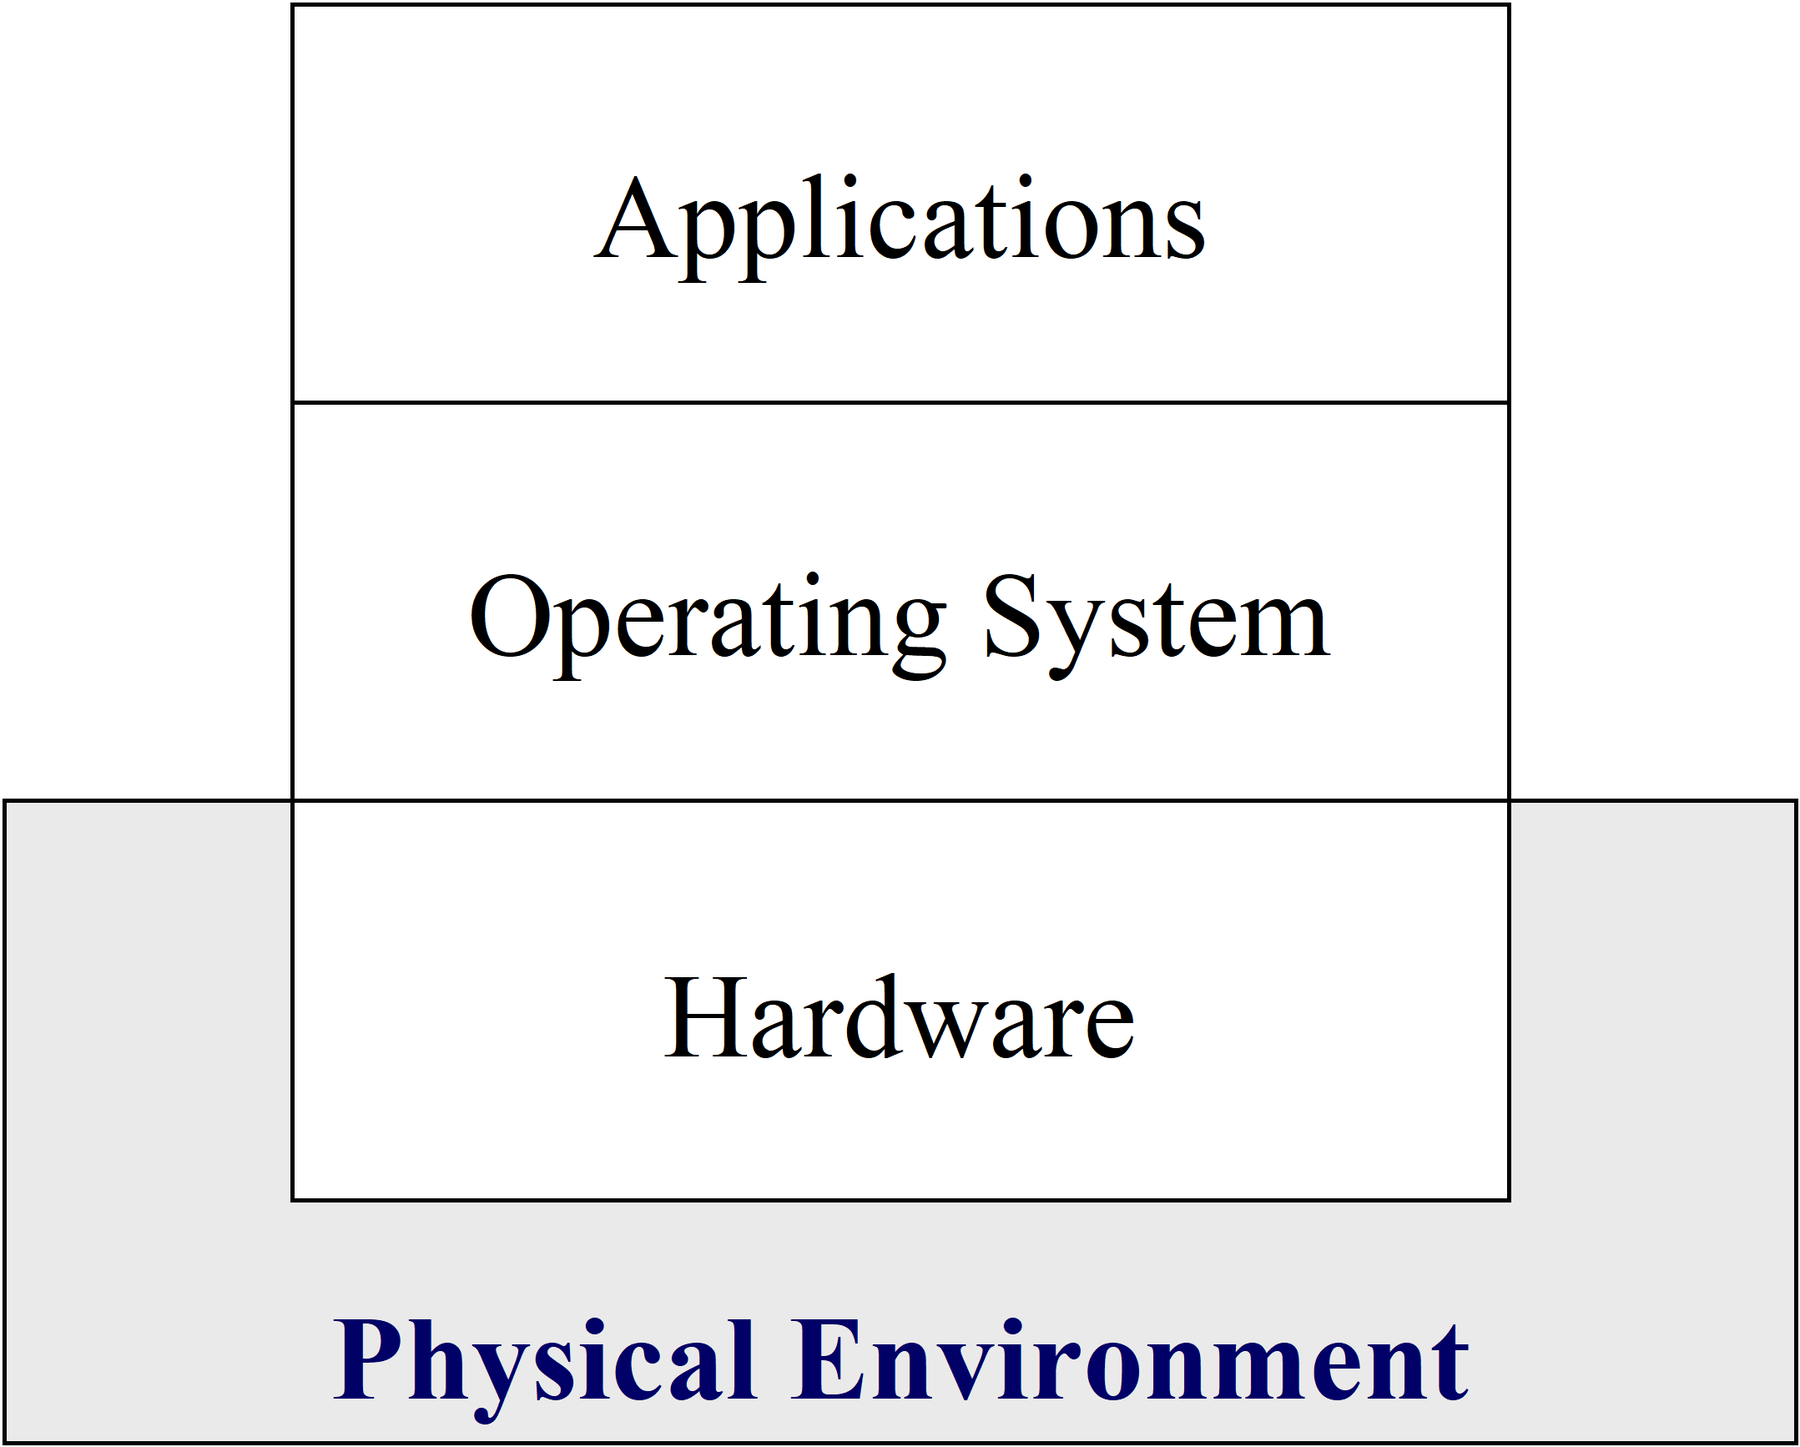
In principle, any number of layers is possible and, above the hardware layer, each software layer can be considered to use the services of the layer below, to provide services to the layer above. In essence, each layer adds to the layers below to create a “virtual machine” upon which the software in the layer immediately above can execute.
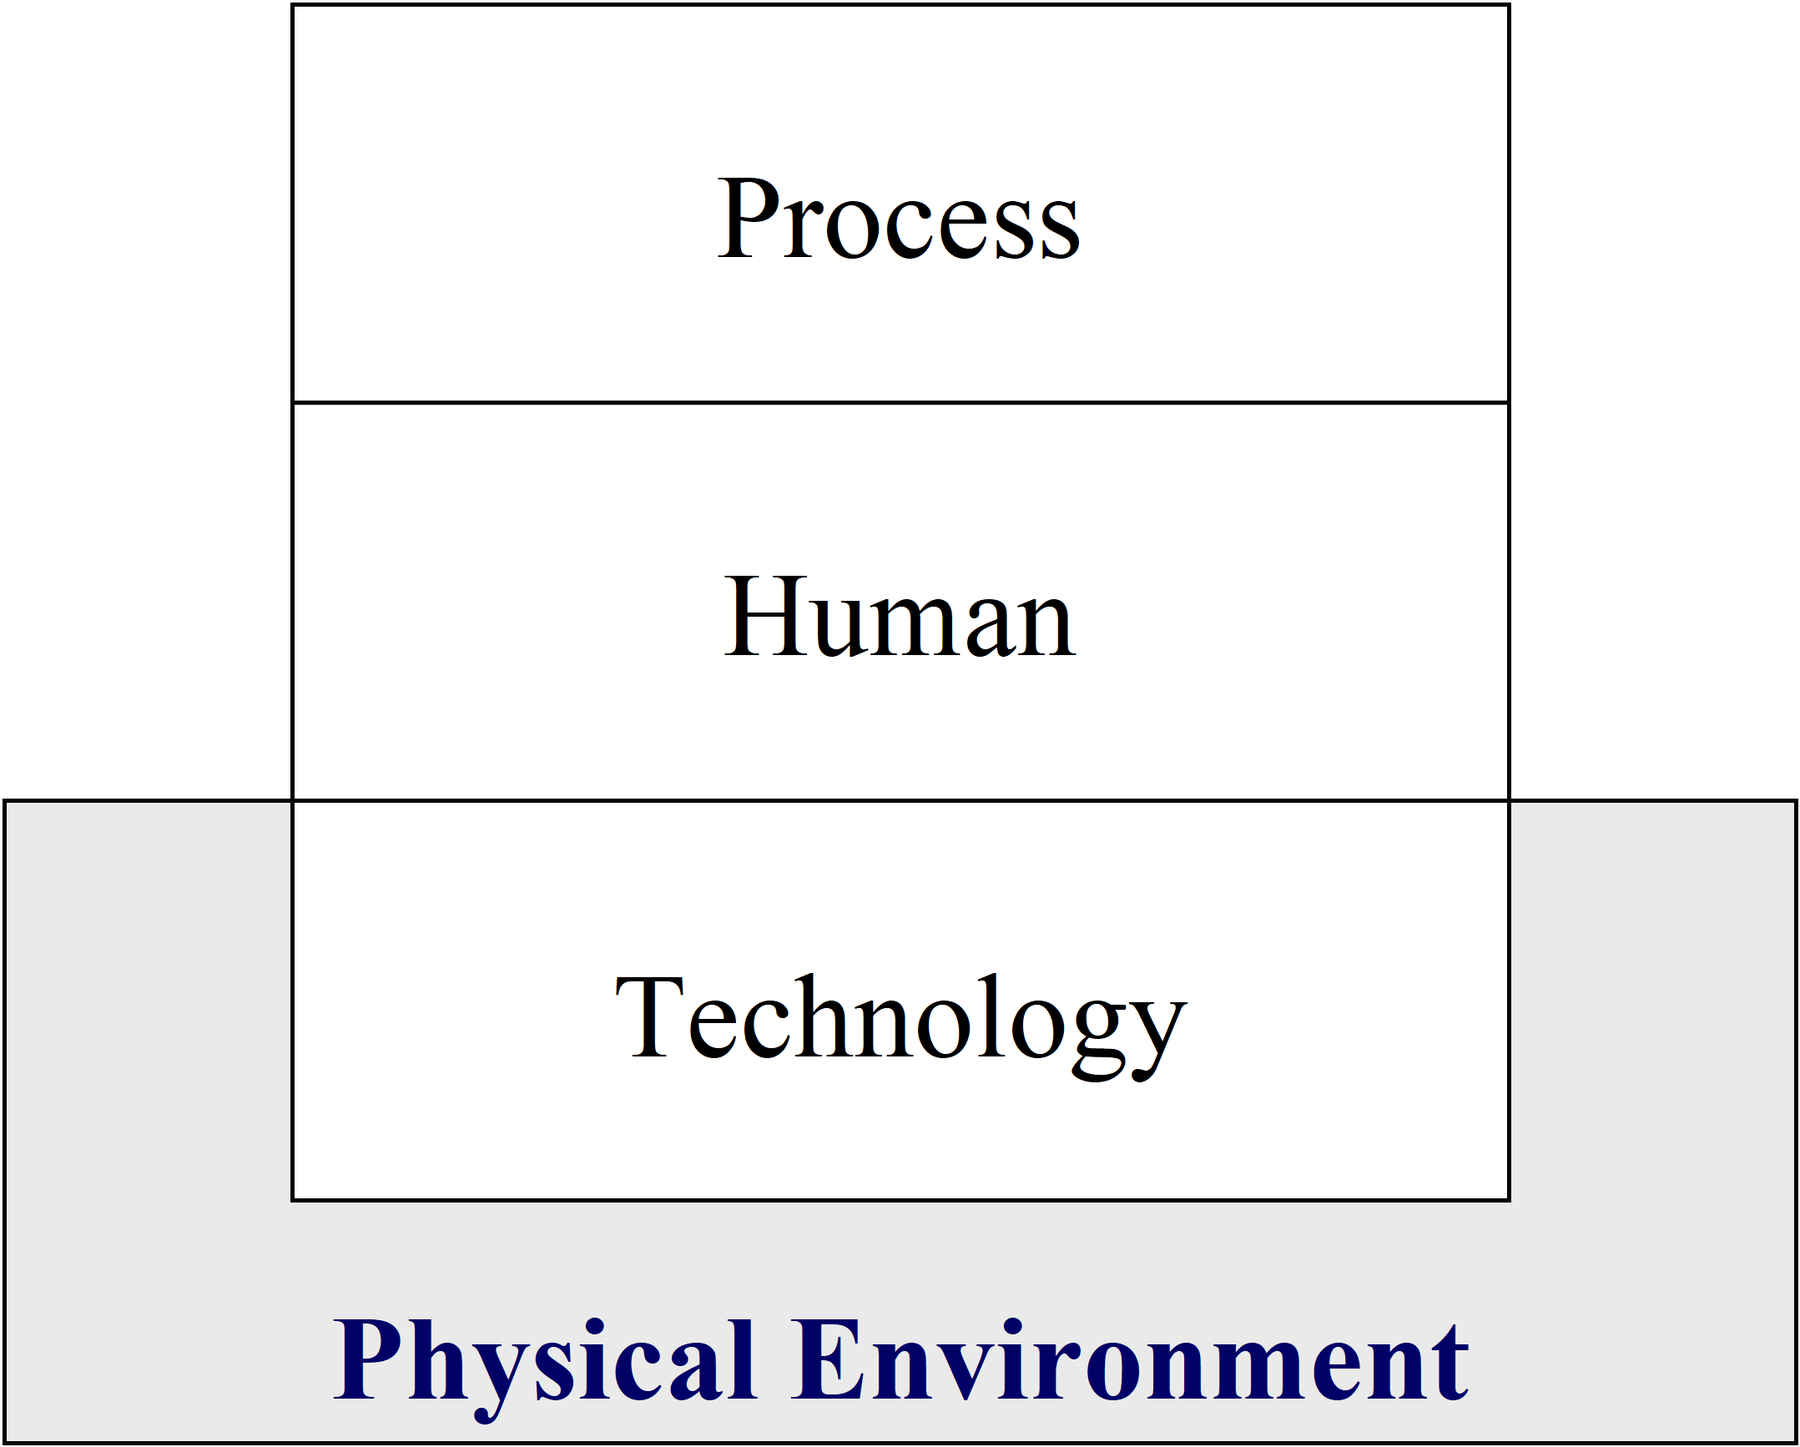
Ultimately, in our white box approach, we wished to model the way in which technology influences the effectiveness of the overall (socio-technical) C3I system. By applying the principles of the LVM approach to a socio-technical information system, we were able to postulate a three-layer model, as illustrated in Figure 4, comprising technology, human and process layers.
For example, technology may sense some stimulus from the environment, and present information to the human. The human uses experience, knowledge and training to interpret the information. That interpretation is used to further the process at the top level that is being conducted by individuals organized into groups or teams. In general, the process might be management, decision-making, design, or manufacturing. In our case, however, we are concerned with the command and control process.
Figure 5 shows how two or more LVMs can interact. Physical connections and interactions occur upwards and downwards within LVMs, and logical connections form laterally. So, humans in one LVM would logically connect with their counterparts in another, while their physical connection went downwards through the technology, through the physical connection and upwards through the other technology layer. Similarly, processes can interact logically as well as physically. One LVM process might, for instance, formulate a plan that is conveyed to another LVM for the process of executing the plan.
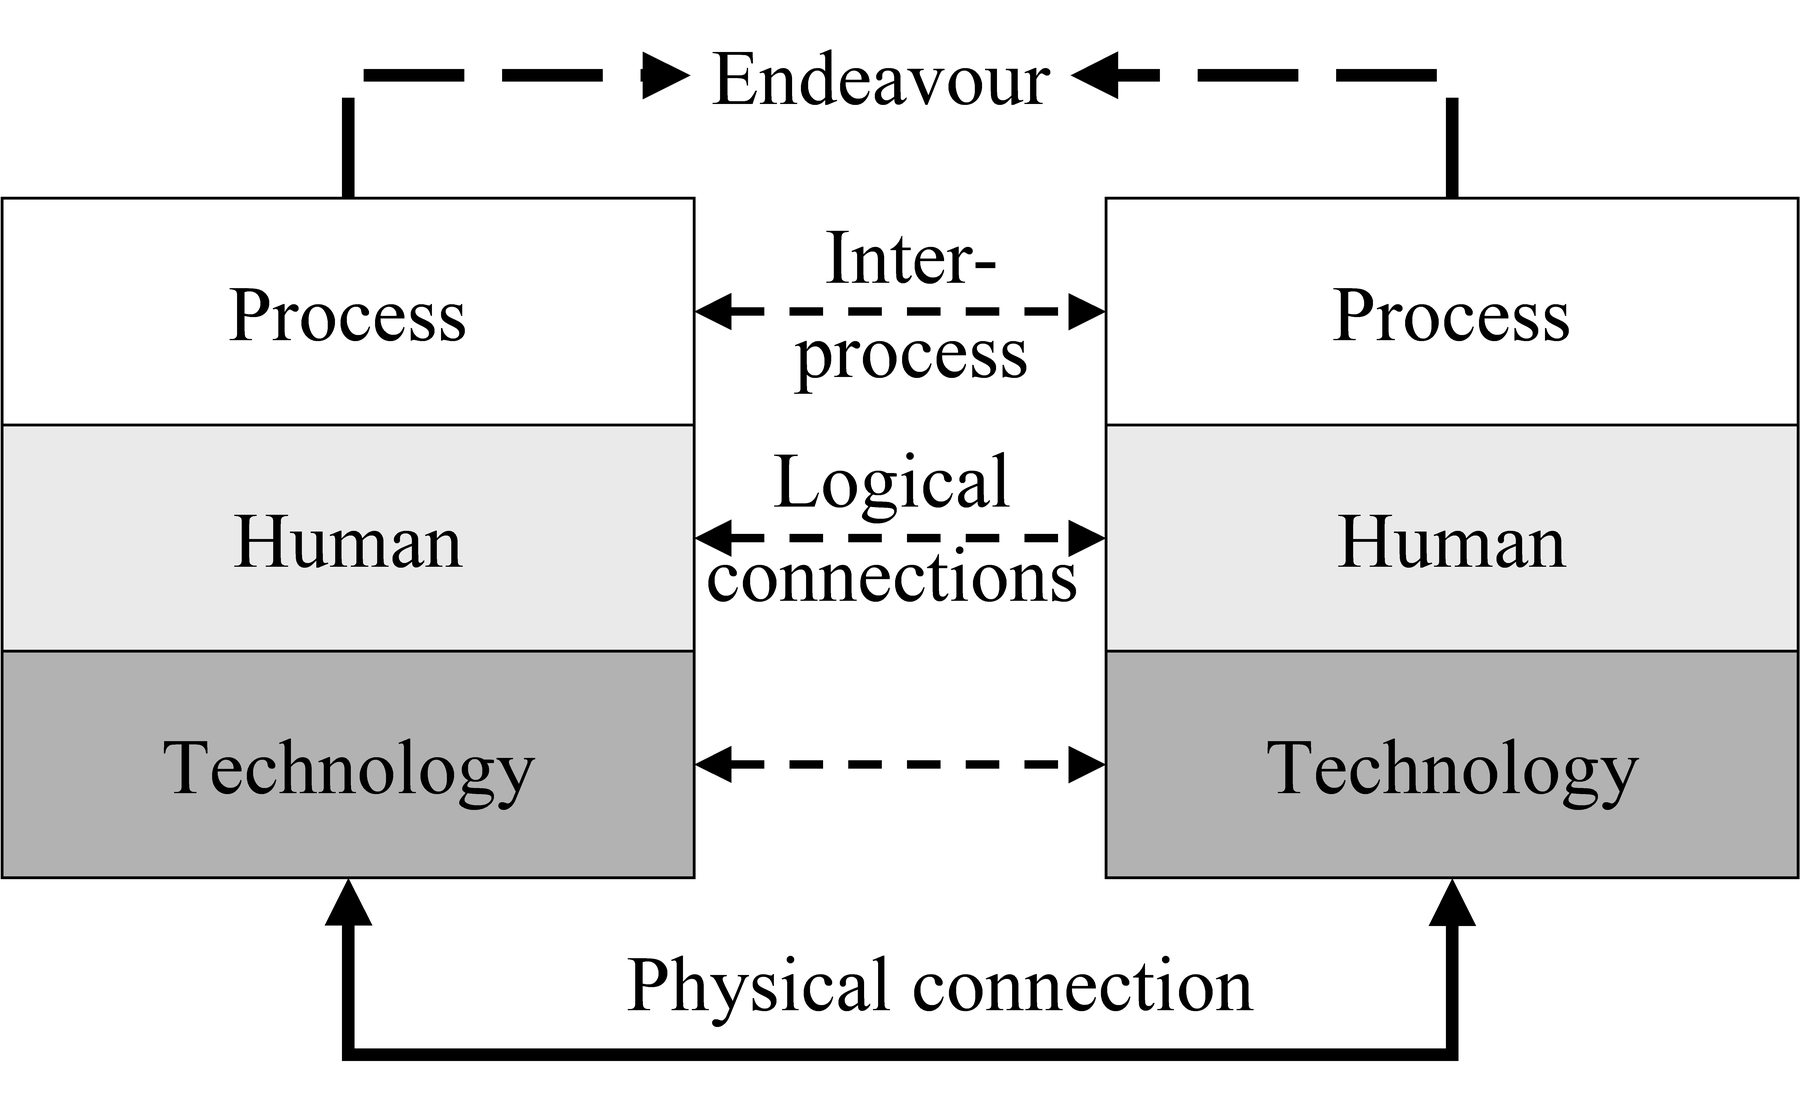
There is nothing in Figure 5 intrinsically to suggest that the two LVMs are co-operating – they could equally be in conflict. In either scenario, they form an interacting relationship, as in Figure 1. It is, therefore, reasonable in principle to use this format to observe both effectiveness and emergence.
The research aim of the white box modelling approach is to determine the impact on C3I effectiveness of introducing COTS. If the two LVMs of Figure 5 were instantiated as, say, identical C3I systems, with all Bespoke equipments in the two technology layers, then the following simple procedure could be followed:
- allow the two identical LVMs to compete/conflict;
- observe/record their effectiveness in competition/conflict (their respective effectiveness will be identical for identical LVMs);
- change one item, for example one equipment only, from Bespoke to COTS, in one LVM only;
- allow the two LVMs to compete/conflict again; and
- observe/record the new effectiveness profile (since it will change with time as previously explained) - the difference in effectiveness ( Effectiveness) between the two runs is due exclusively to the one change that has been introduced.
Provided each LVM is a faithful counterpart of the real-world system, this approach will take account of such factors as:
- all subsystem interactions,
- system-to system interactions,
- environmental influences,
- maintenance and logistic effects, and
- human behavioural effects.
In other words, this is potentially a true systems approach. However, in order to pursue this, it is necessary to devise a way of modelling the individual layers of the LVM and their interactions. As a pilot experiment [4], we have adopted the Generic Reference Model for this purpose, and our recent experimental results suggest that this combination provides a powerful template for rendering a reasonable counterpart to any real world system.
Generic reference model
The Generic Reference Model describes the “inside” of any system; the subsystems and their mutual interactions, are the source of emergence and effectiveness. [5]
The model at its top level is outlined in Figure 6. At its simplest, a system has being, or just exists without function or behaviour. The solar system, it seems, just is. It has structure, sources of energy, gravitational influences, and so on, but nonetheless just is.
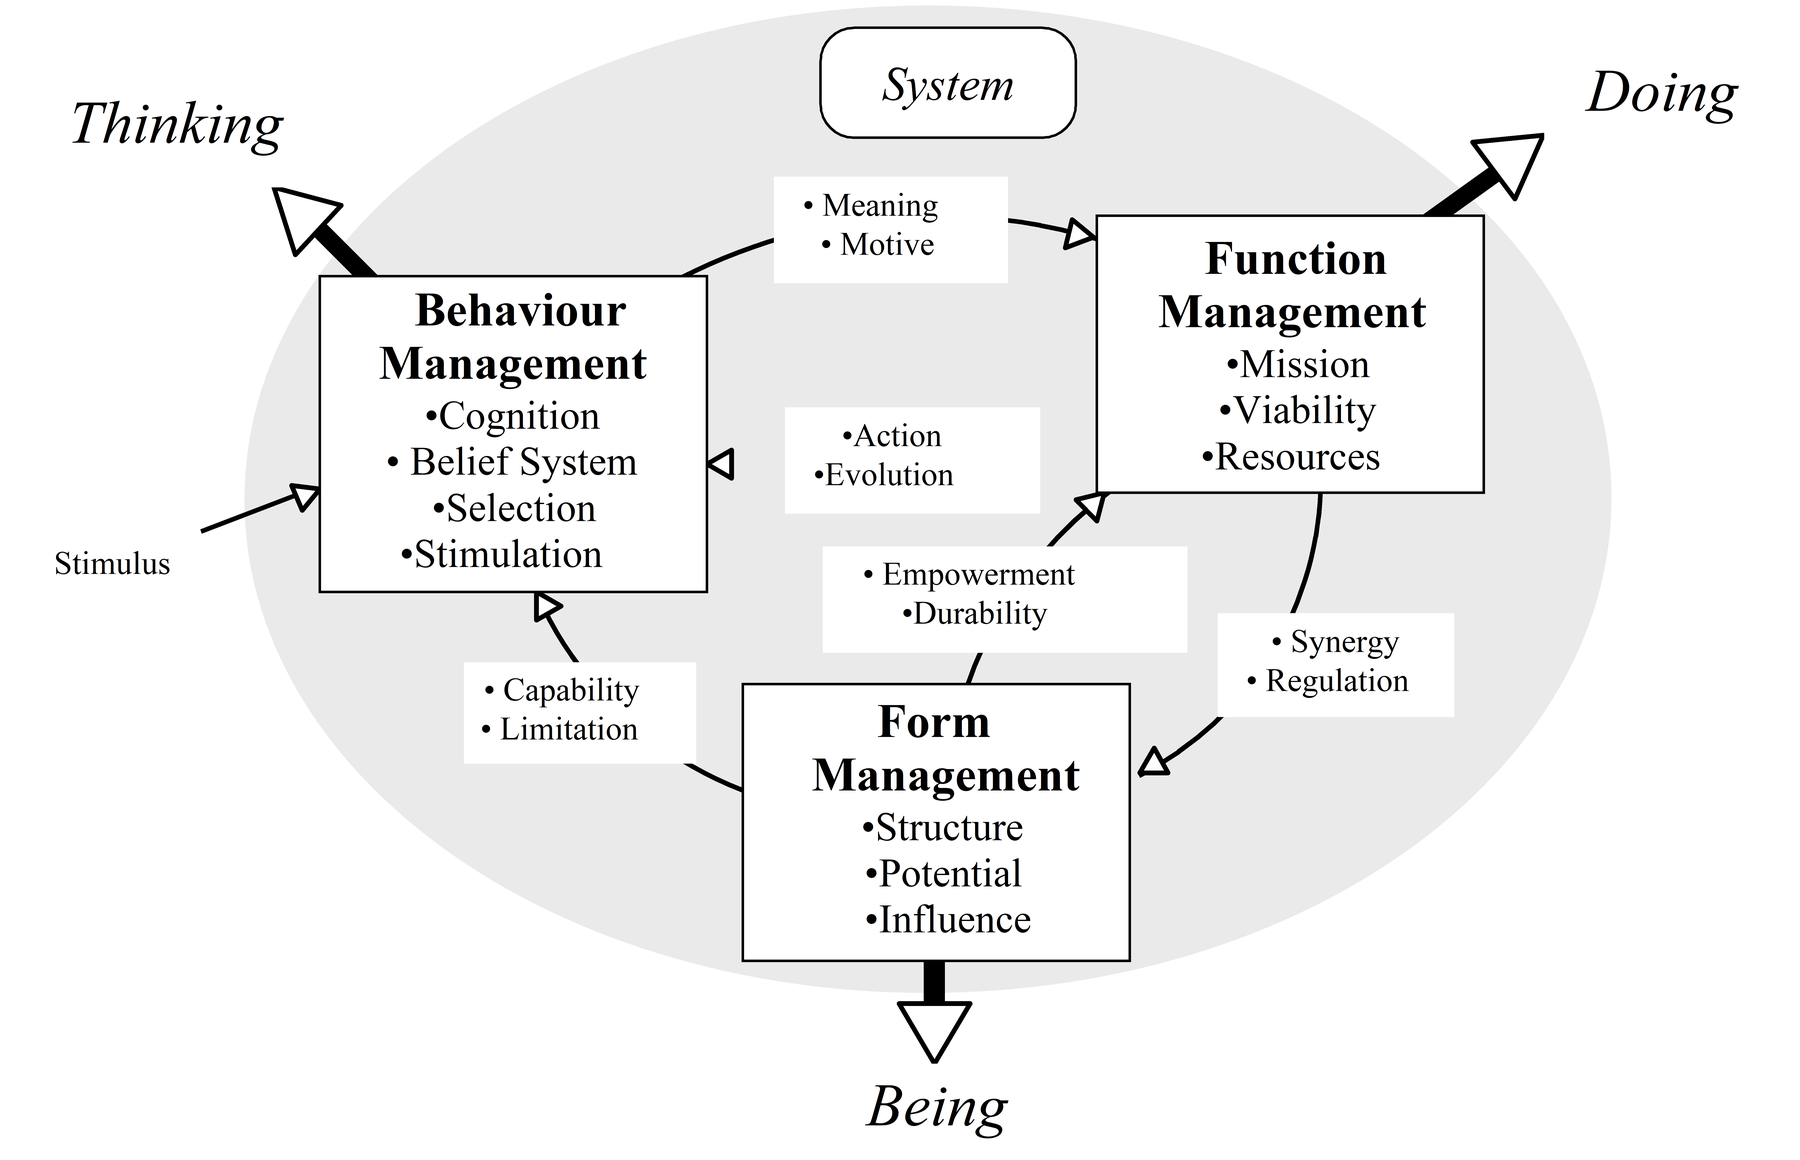
Some systems not only exist, but do things, too. Plants and simple animals fit this description, but so too do manufacturing systems, tanks, ships and places – these have function, although they may not work without operators. Yet again, some complex systems exist, do things, and think – cogito ergo sum. Humans fit into this category, but so, too, do C3I systems, and tanks ships and planes when they have their operators and decision-makers installed and active.
So, the GRM can represent any system by choosing which of the three parts to invoke. All systems exist, some function as well and, of these, some think, too. Figure 6 also outlines internal structure, which will be expanded briefly, below.
Mission management
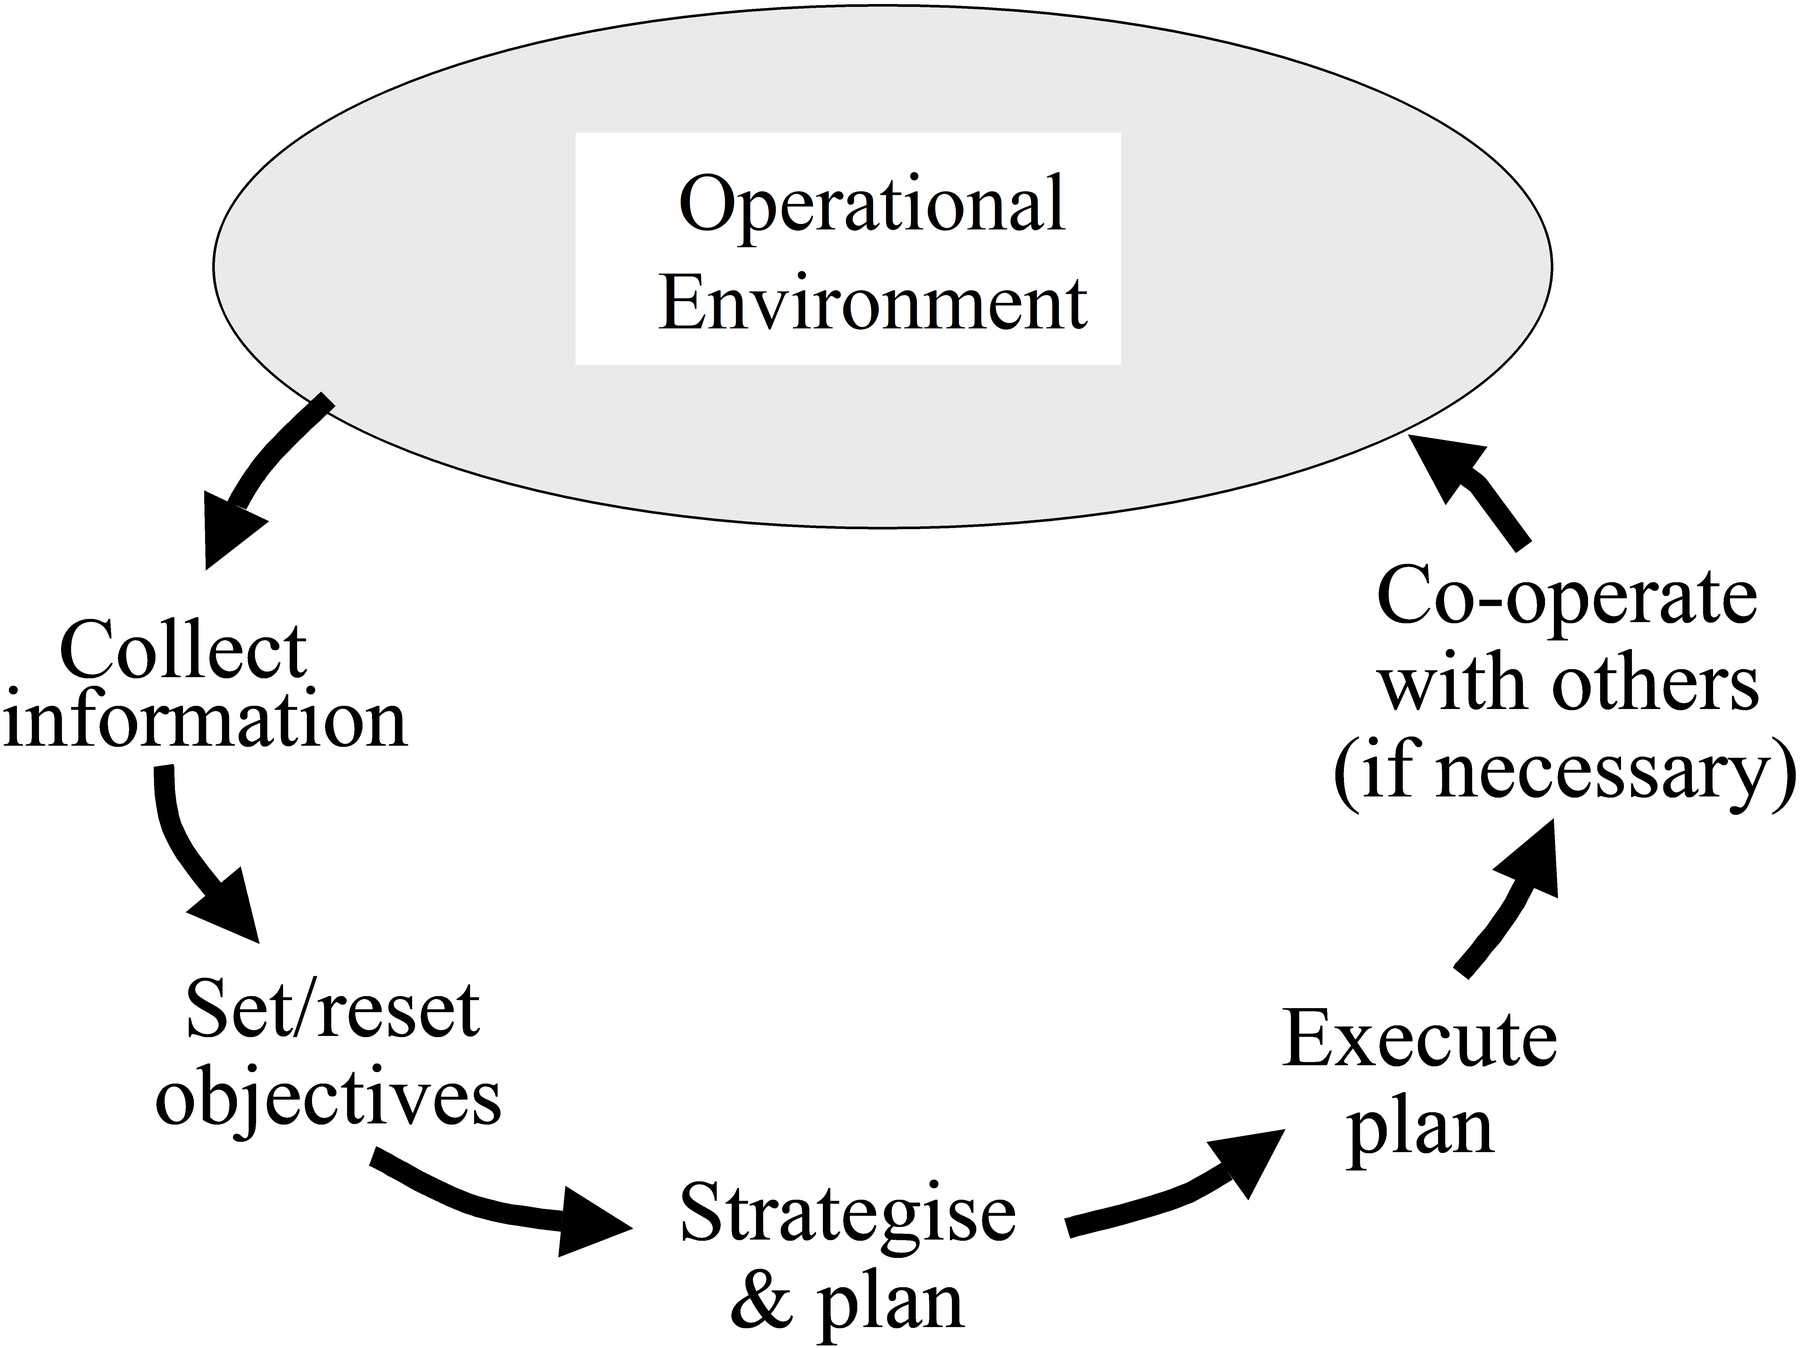
Figure 7 shows the first level of elaboration for Mission Management. The sequence of activities is the simplest set, and they can be seen deriving information from some operational environment and then acting into that environment. This figure could represent an earthworm seeking refuge, NASA putting Neil Armstrong on the Moon, or a C3I decision-making process. Note that energy is needed to maintain the circular process.
Resource management
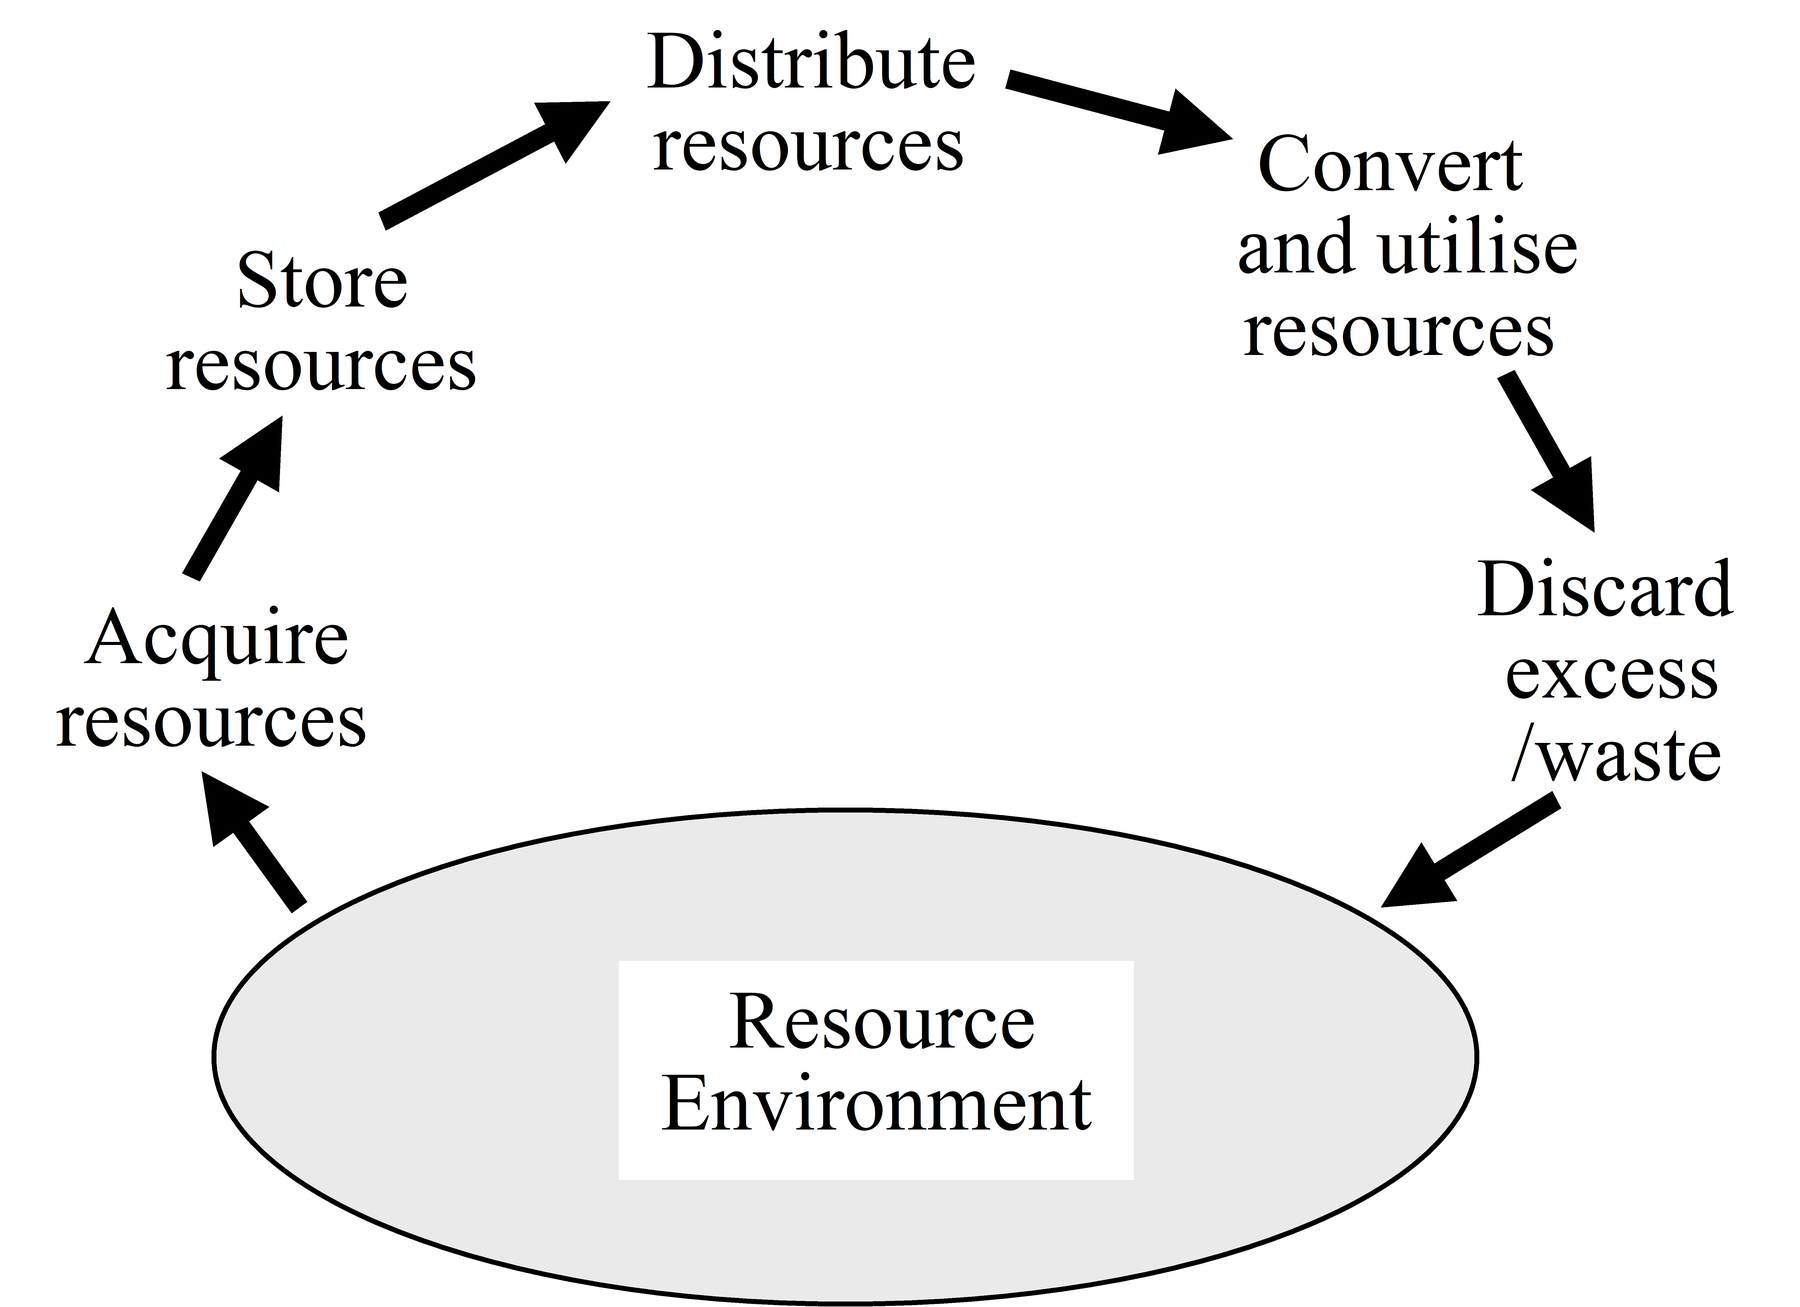
Figure 8 shows a similar figure representing the process of resource management. Resources are acquired from some resource environment and excess/waste (even product) is returned to the resource environment. Note, as before, that energy is needed to maintain the rotation.
Viability management
Figure 9 shows Viability Management. A similar division used for a US tactical fighter suggested the division of Function Management into Mission, Resources and Viability. (For the fighter, the split was Mission, Resources and Platform. Platform management included all the resources needed to maintain the integrity of the platform as it undertook its various missions.)
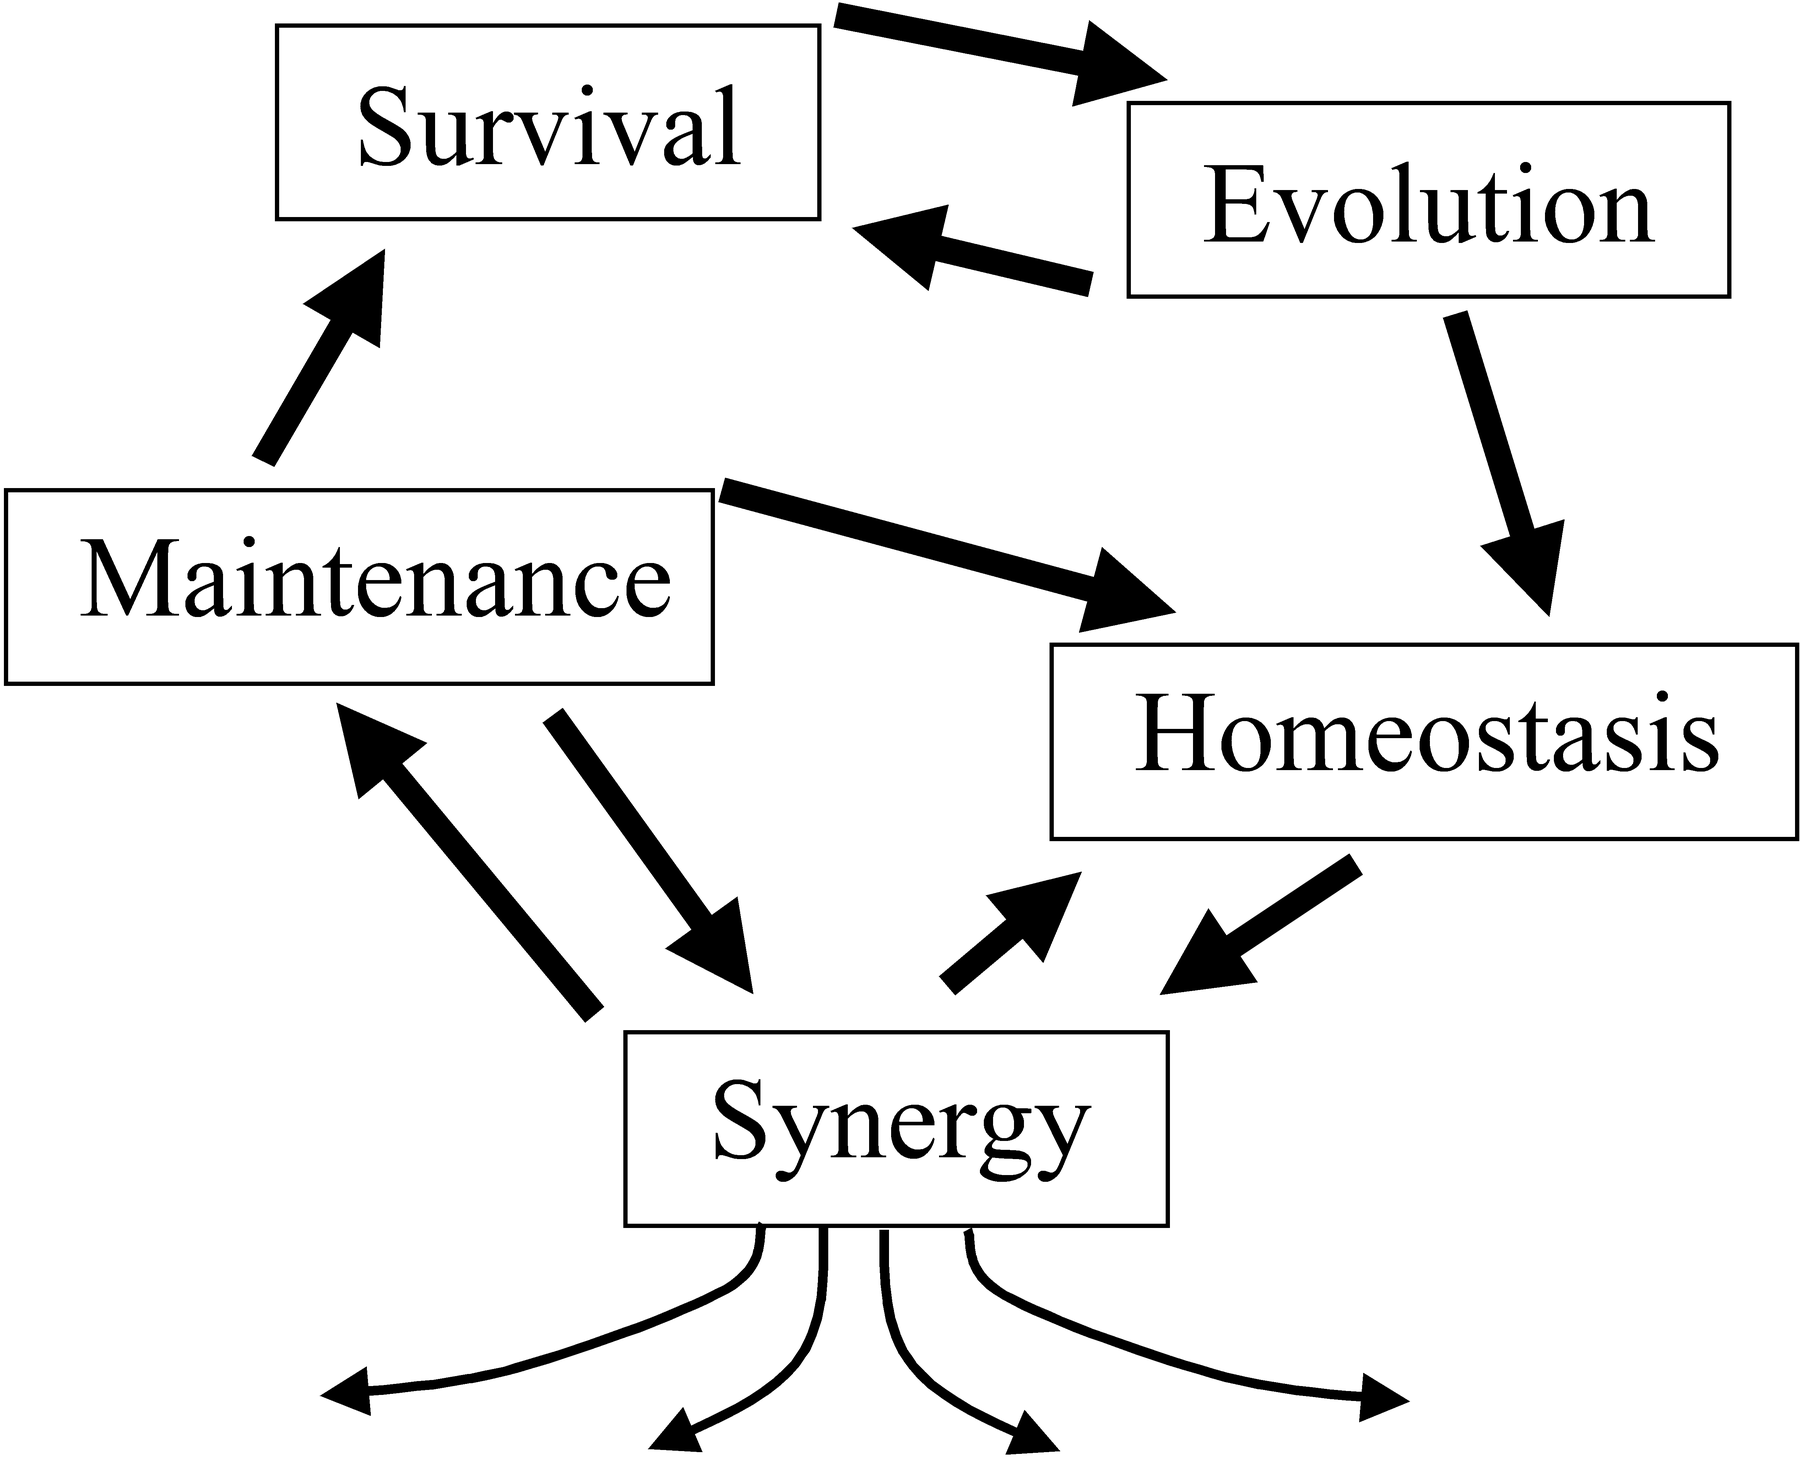
Viability management employs the same idea, but in generic form; that is, applicable to any system. In the figure:
- the whole forms a self-sustaining set;
- homeostasis maintains internal environment for all other internals;
- synergy co-ordinates all internal parts;
- maintenance detects, locates, replaces, disposes;
- survival protects from externals;
- evolution adapts, improves…; and
- Together = Viable System.
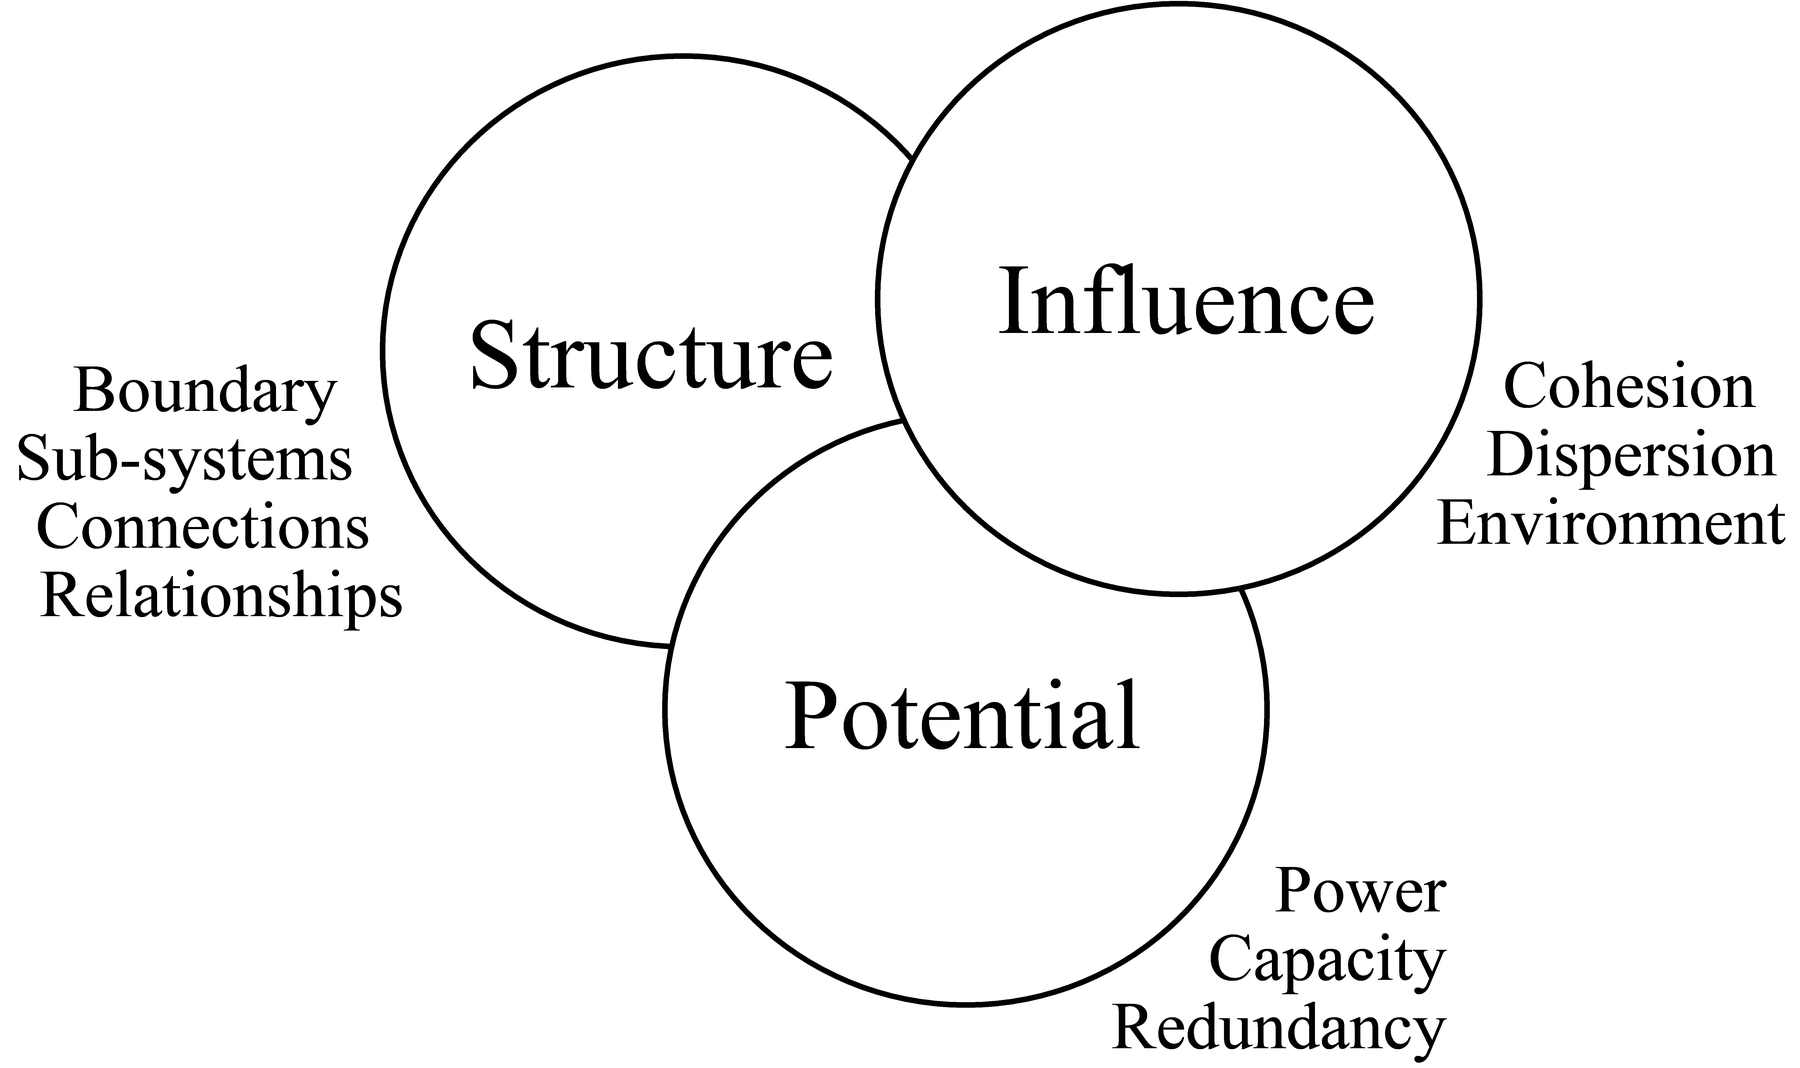
Figure 10 shows the first level of elaboration for the GRM Form Model. As with the other parts of the GRM, it is erroneous to view these various elements as existing separately from each other. All aspects coexist. For instance, Viability Management is integral to Form, and Function requires Form to give effect.
Grm—behaviour management
The Behaviour Model, illustrated in Figure 11, proposes how Behaviour might be selected generically – it does not identify which particular behaviour results from a given stimulus. That is beyond current capability.
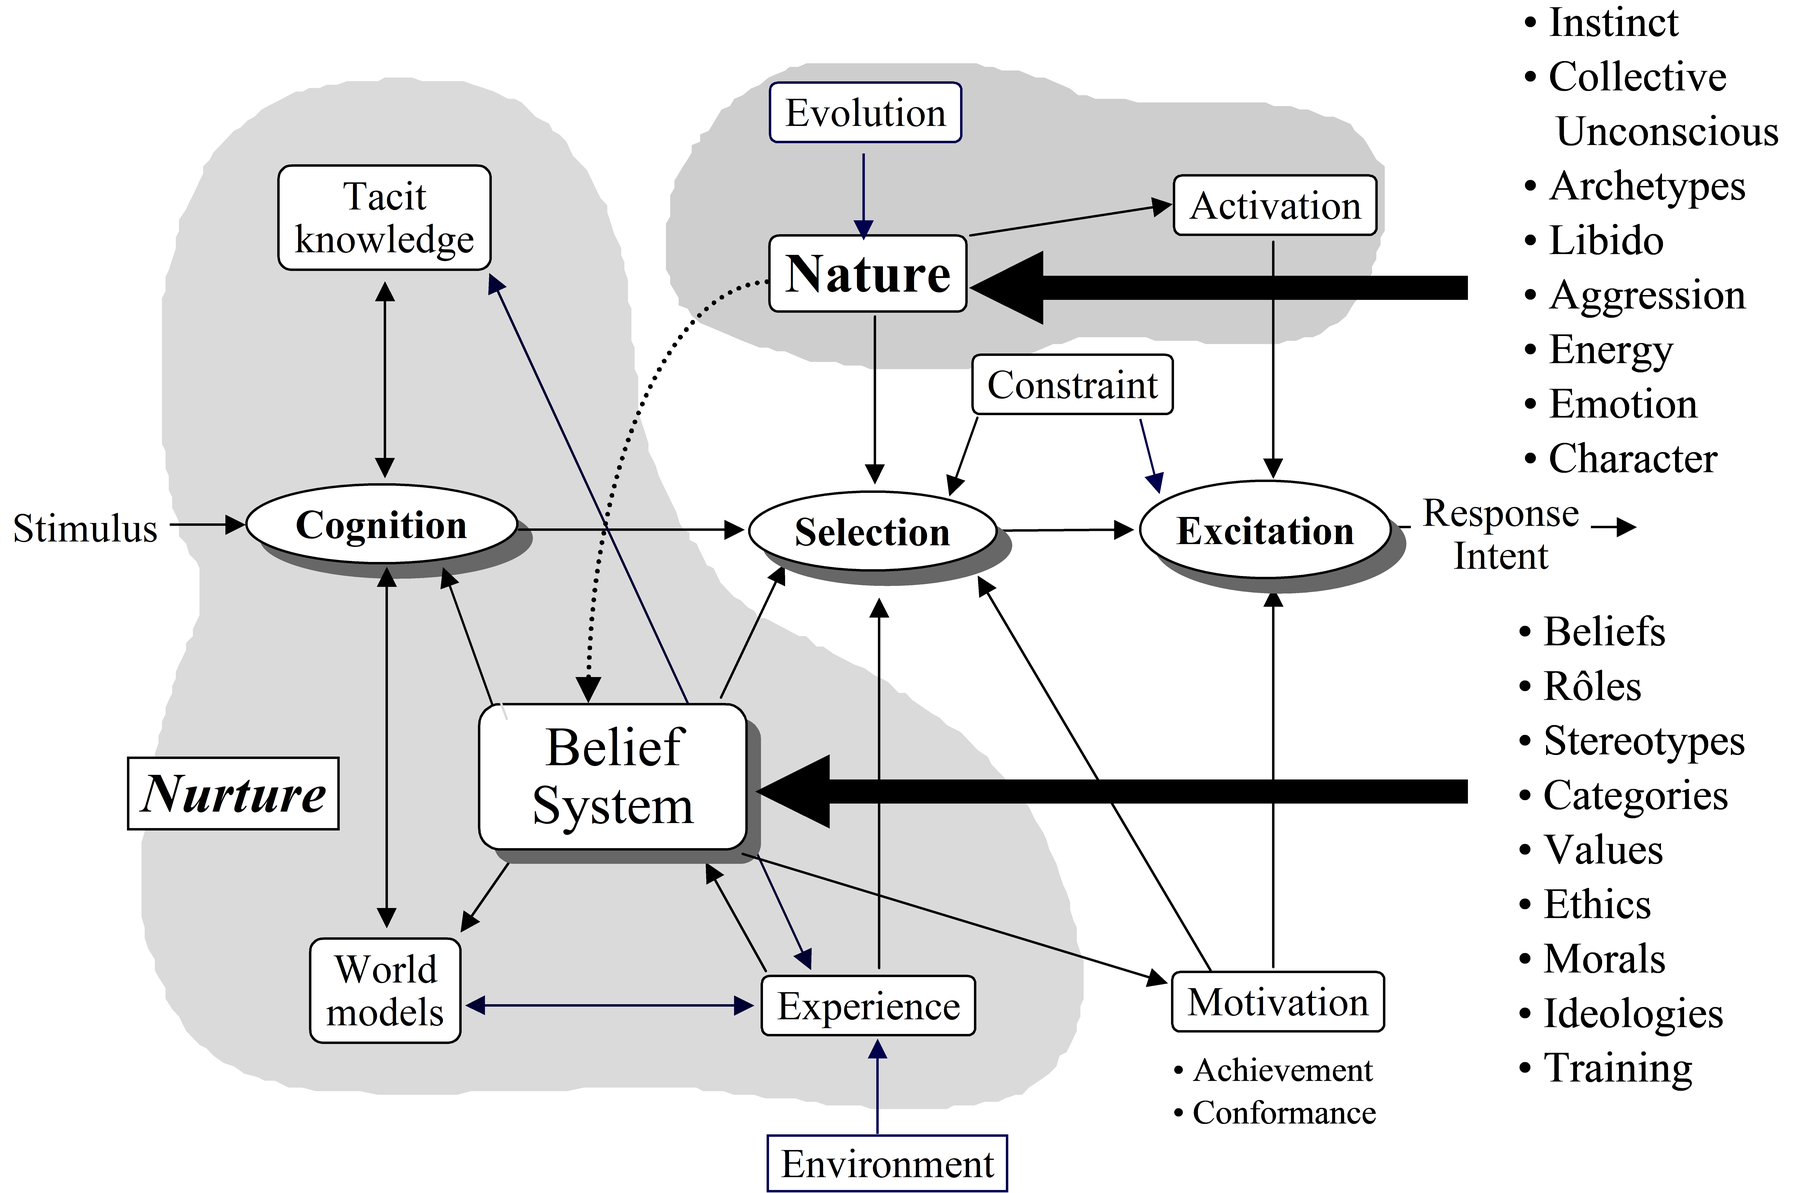
is based on a variety of psychological models,
- proposes ways in which both instinctive and sentient entities respond to stimulus,
- is appropriate for individuals and groups,
- recognises essential nature-nurture conflict, and
- establishes Belief as central to behaviour.
Integrating the lvm with the grm
This process is conceptually similar to providing a skeleton (LVM) with flesh, blood, central nervous system and organs (GRM).
Figure 12 shows the combination of the LVM and the GRM, referred to as the Layered GRM (LGRM). Note that the marriage between the two was not without some problems, and it has been necessary to reduce the resultant model’s complexity whenever possible. For example:
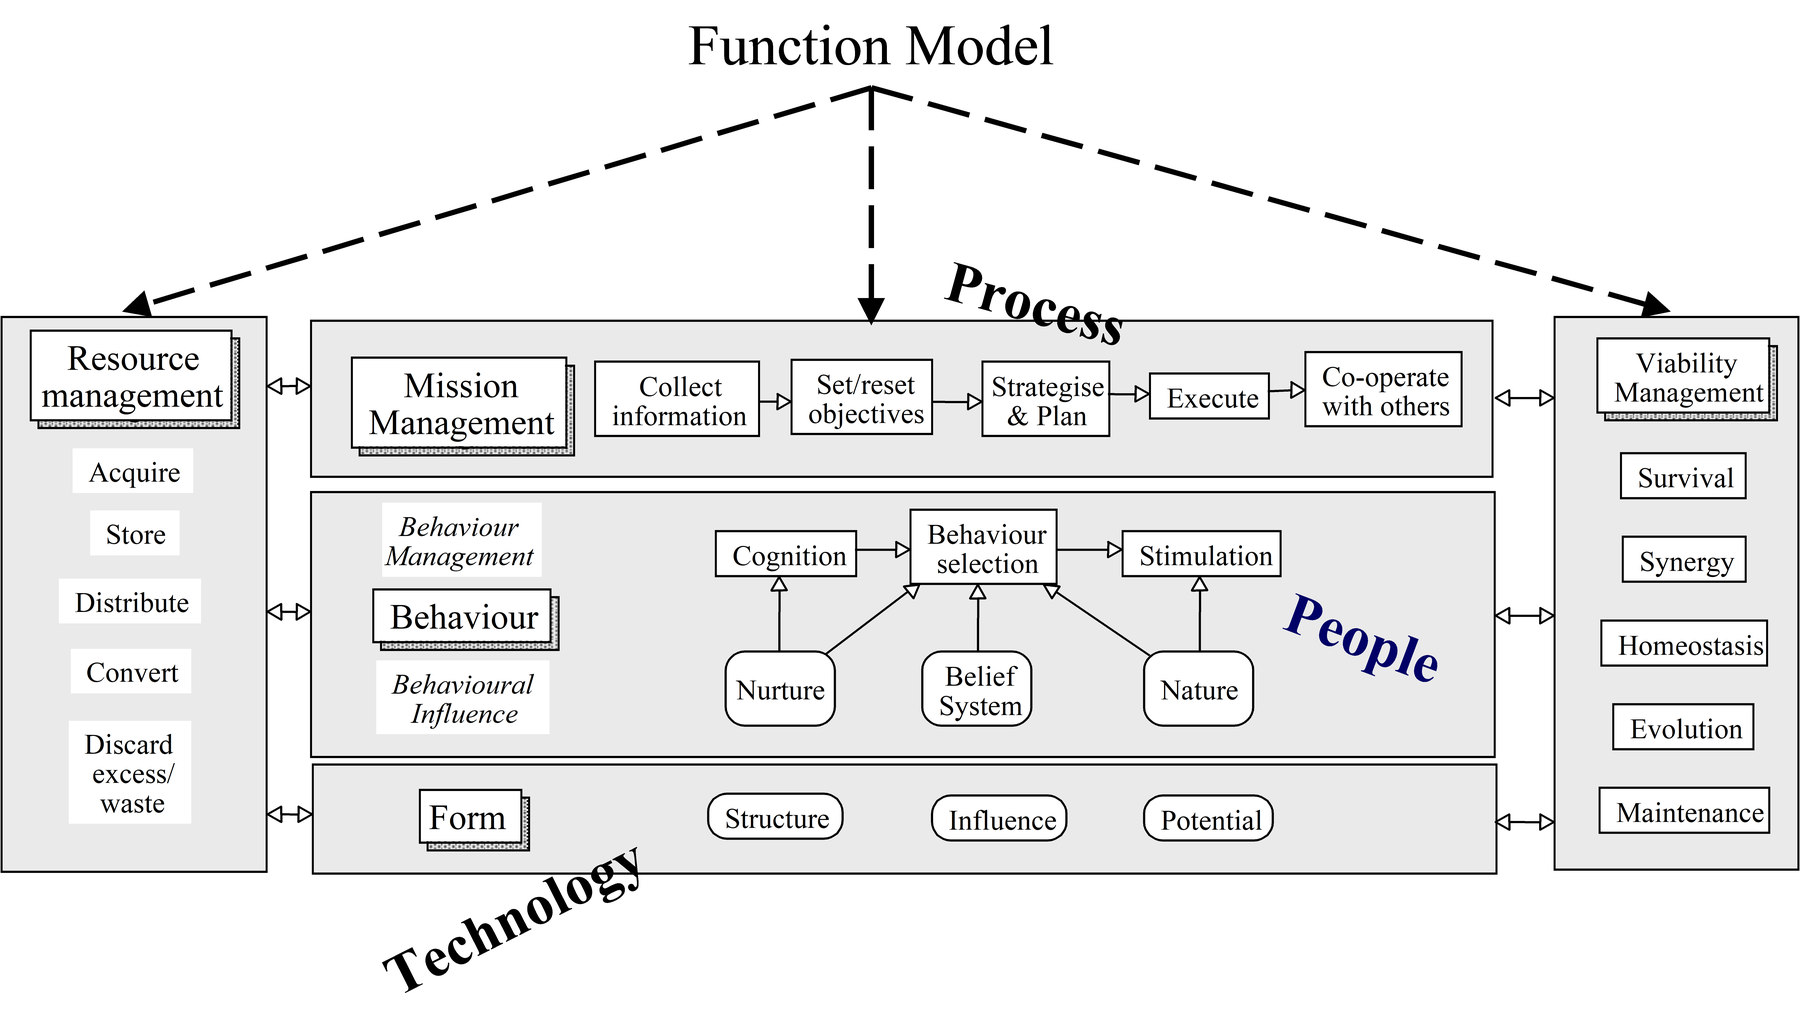
- GRM Function Model is represented in its three parts. Mission Management corresponds to the Process layer. Resource Management and Viability Management apply equally to People and Technology, and are considered to be shared with the Process layer.
- GRM Behavioural Model is considered to be primarily associated with the Human layer, and the Form Model mostly associated with the Technology layer.
- The interconnection between layers is complex and application-dependent; it cannot, therefore, be shown in the generic form of Figure 12. Figure 13 shows the intra-connections that are suitable for an instantiation of the LGRM for a C3I system.
Using the LGRM – a case study
The LGRM is a general-purpose tool. The immediate research goal was to study the impact on naval C3I of introducing COTS equipments. The next stage, then, was to develop a representation of naval C3I system in operation, to use as an experimental laboratory, using the LGRM as a tool.
The plan went as follows:
- Establish a scenario. For example, two identical ships, 100 nautical miles (nm) separation, engaging, weather affected. No other participants.
- Install identical technology in each ship - radars, jammers, ESM, navigation, engines, weapons, situation displays, battle damage displays, maintenance, and so on.
Install identical people in each ship – identical in training, cognitive abilities, experience, learning capability, behaviour, and so on.
- Establish identical C2 processes in each ship - assess situation, identify threats, and so on.
- Make decisions in each ship - engage, withdraw, fire, repair damage, and so on.
- Underpin with comprehensive cost models for each ship - capital, maintenance, operating, damage repair, people…costs.
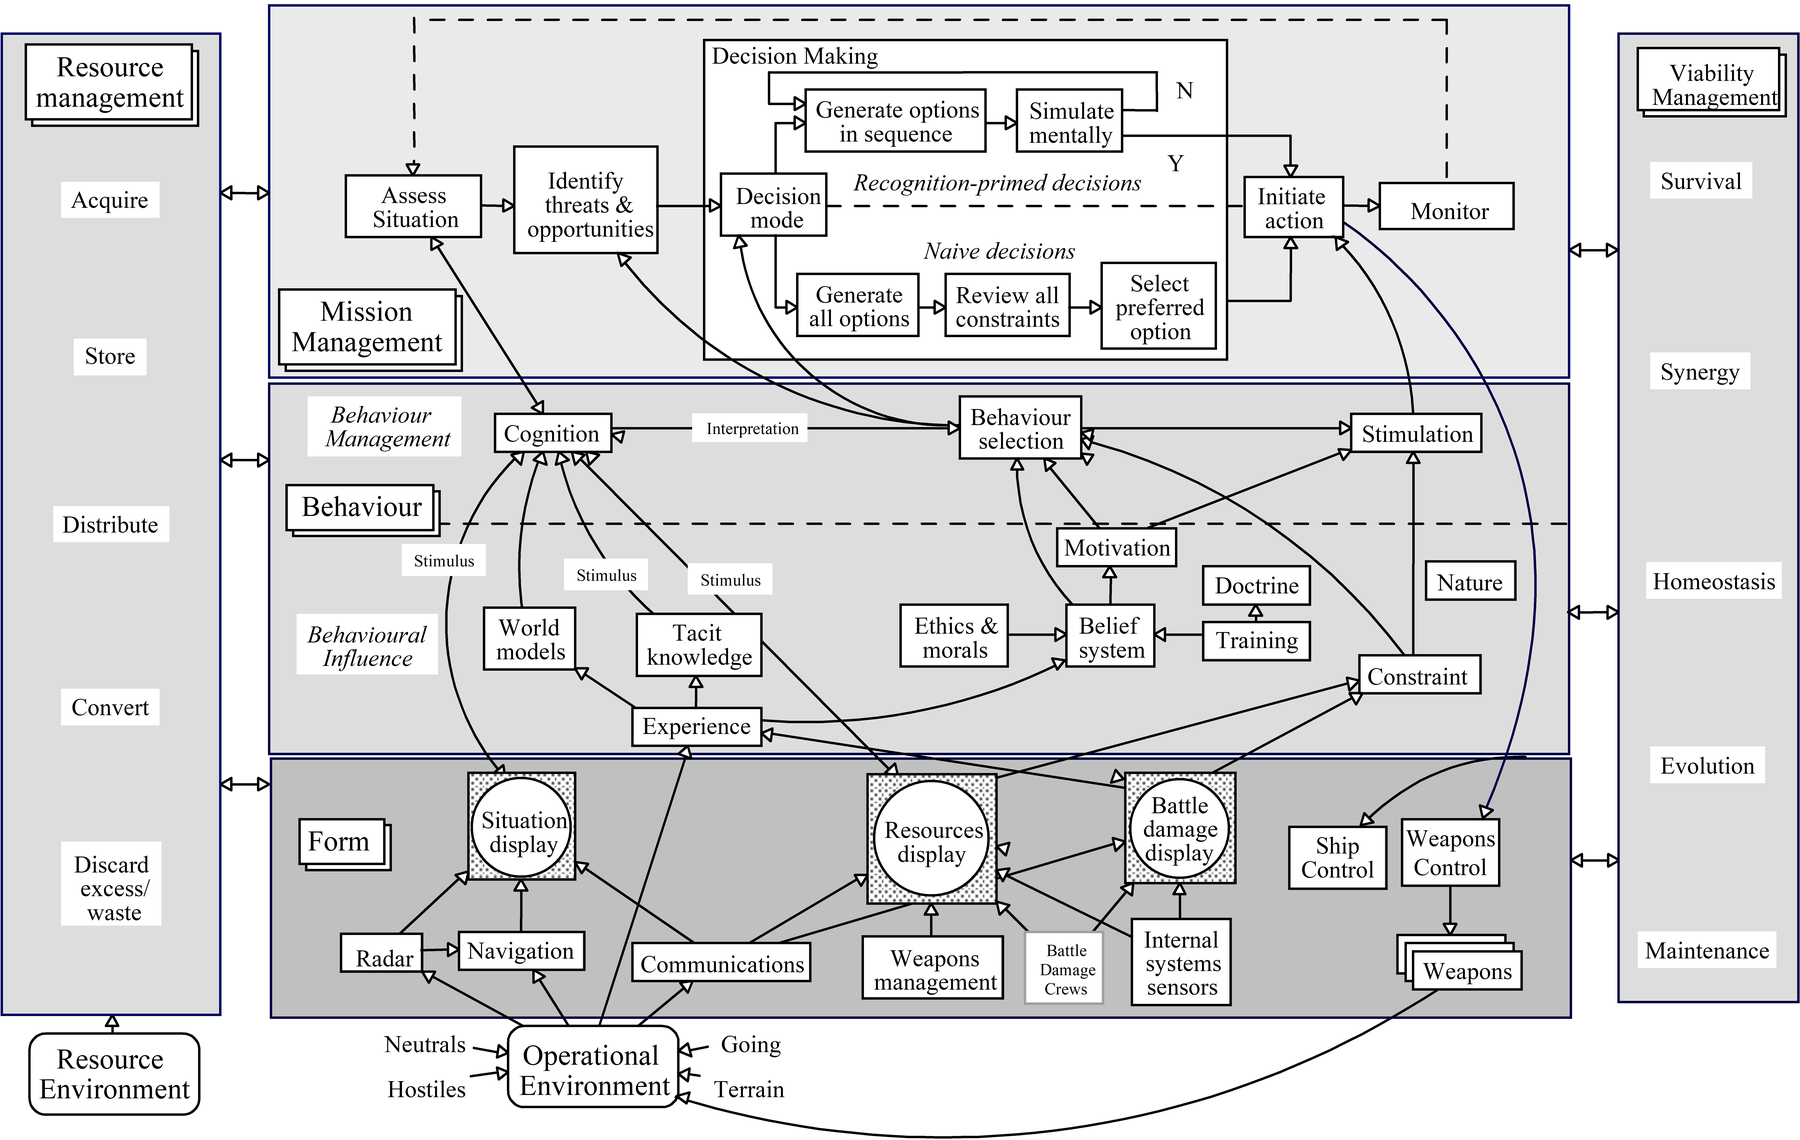
Figure 13 shows the LGRM, now mapped to represent a naval C3I system, so that it is possible to include many of the interconnections. The full model comprises two such LGRMs, one for Blue Ship, the other for Red ship, interconnected.
- The Form layer contains the technology as a number of "stovepipe" equipments such as sensors, processors, displays, weapons, and ship's controls.
- The Behaviour layer shows the GRM Behaviour Management model rearranged into a sequential process at the top of the layer, with a variety of inputs at the bottom of the layer. This arrangement facilitates joining downwards to Form, and upwards to Mission Management. Note the presence of Experience, connected to the outside world, and Doctrine. This enables the crew to learn, and to change their behaviour, within doctrinal rules, according to how much damage the ship is suffering, for example.
- The Mission Management layer shows a generic Command and Control (C2) decision-making process, with a difference. The conventional C2 Process is shown: assess situation; identify threats & opportunities; generate all options; review all constraints; select preferred option; initiate action; and monitor. In addition, Klein's Recognition Primed Decision-Making (RPD) is included, too [6]. Conventional decision-making is thorough, but can be slow. RPD is experience-based and very fast. RPD is the mode employed by an expert under time pressure. In the model, when the time available for decision-making is small, Mission Management switches from conventional to Recognition-Primed decision-making.
Using the model
The static model, part represented in Figure 13 was developed as a dynamic model using STELLA™ as a convenient modelling medium, with a near one-to-one correspondence; that is, for every item, process or connection in Figure 13, there is an equivalent in the STELLA™ model.
The dynamic model was set up so that Blue ship could detect Red ship as they closed, could fire when within range, could inflict damage and casualties and receive damage and casualties, and could repair damage. If equipments failed during the engagement, they would be repaired using spares and test facilities. Resources were limited: there were limited spares, limited weapons and limited damage repair crews, for example. Each equipment could be either COTS or bespoke, by selection, so a ship could be set up all bespoke, all COTS, or any combination. Initially, both ships were set to all-bespoke equipments, and engagements simulated, closing from 100nm.
Identical ships engage, score identical results, measured as:
Cost effectiveness, cost-exchange ratios, casualty exchange ratios or Return on Capital employed (ROCE) – all four measures were calculated continuously, although ROCE proved erratic in practice.
Damage could occur to weapon systems, sensors, displays, engines, and the ship could also be sunk. Damage, casualties, and damage repair contributed to combat costs.
To determine the impact of COTS on C3I system effectiveness, hold Red ship constant, all bespoke. Change only one item on Blue ship, say from bespoke to COTS weapon.
Run the model again.
Any difference in the effectiveness measures is due to the single change - changing from bespoke weapon to COTS weapon makes… δE difference to overall effectiveness (E) in that scenario against that opposition.
Takes account of all interactions, dynamics, costs, and so on.
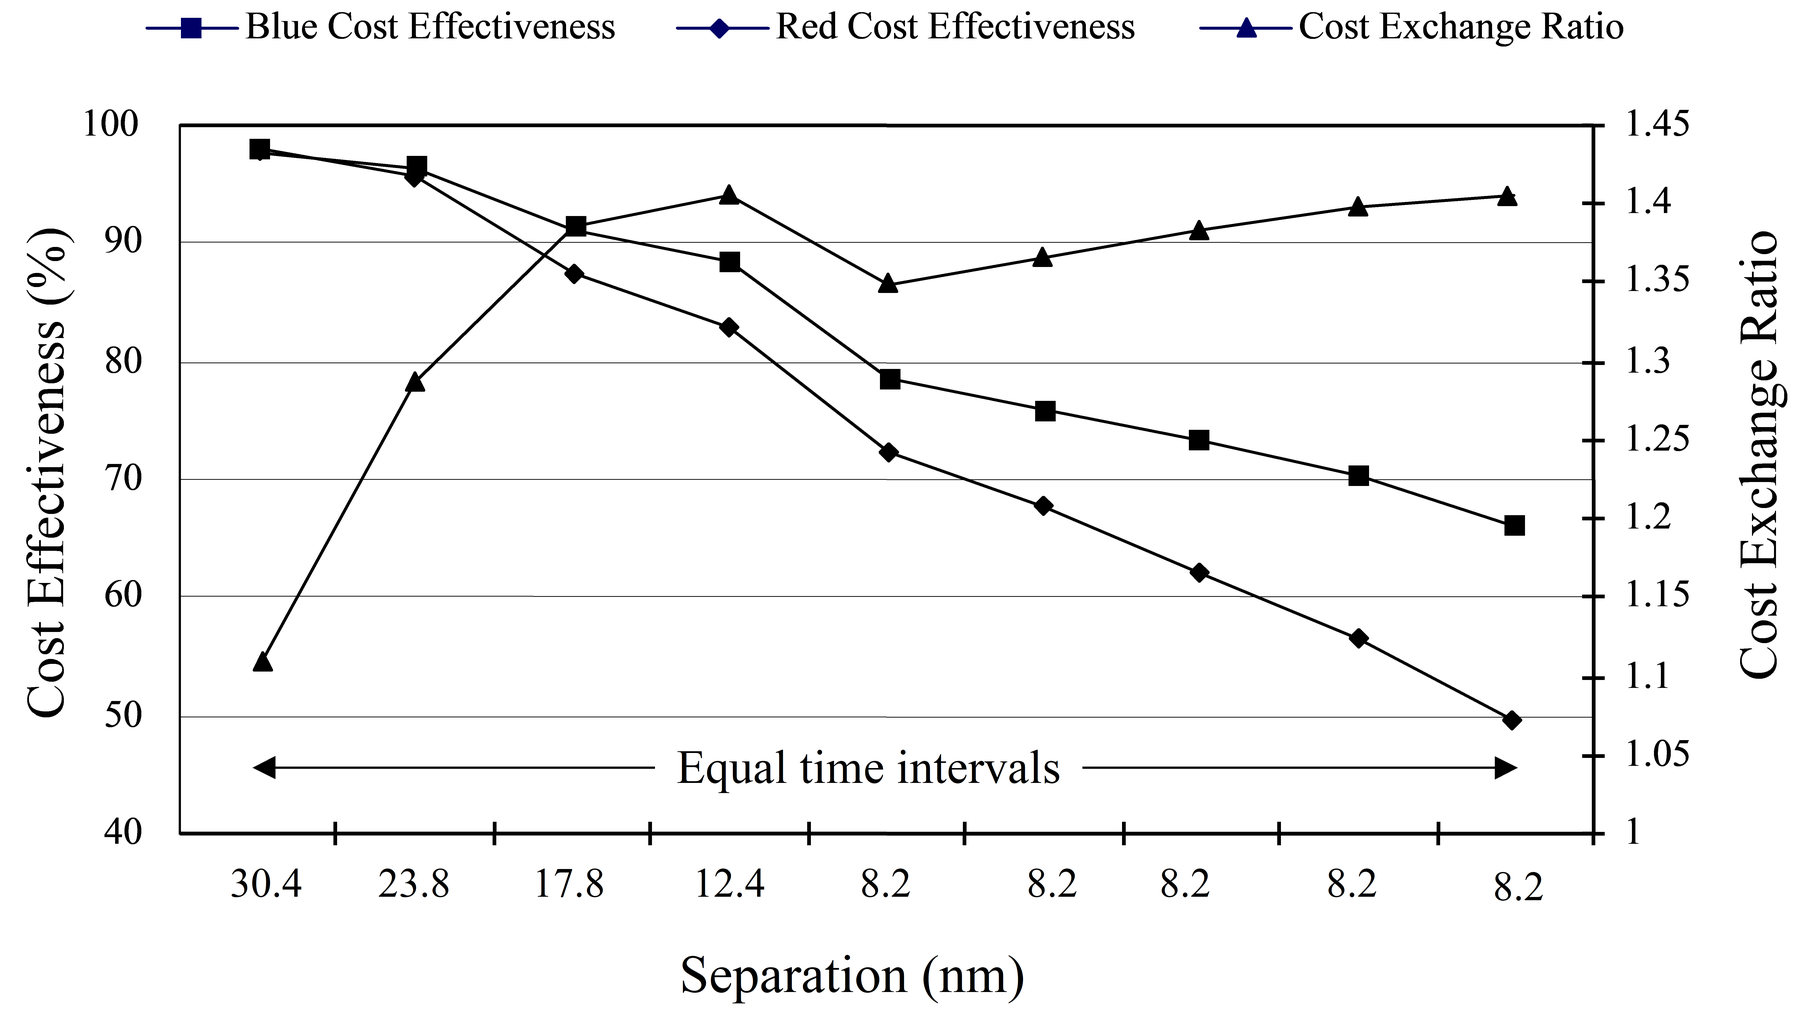
See Figure 14 which shows the relative cost effectiveness measures for COTS versus Bespoke weapons as Red and Blue ships close. For this run, weapon performance was presumed identical in each case, while the COTS missile was cheaper. The difference in cost effectiveness between the ships is marked in this instance because many missiles are fired by both ships, and Blue's are cheaper. Notice that the separation stalled at 8.2 nm; this occurred because both ships had their engines damaged, were dead in the water and, unable to withdraw, had little choice but to fire until their magazines were exhausted.
Maintenance & Logistics
Different support was provided in the LGRM for COTS and bespoke equipments:
- COTS equipment was provided with “repair by LRU replacement”, throwaway spares, little test equipment, less training; and
- bespoke equipment was supported by repair by module replacement, repairable modules, full test equipment, more training.
The following were provided for each technological system:
- spares for consumption during operations,
- test facilities, and
- trained technicians.
Finally, the overall costs were calculated as:
Capital outlay + routine running costs + combat costs + damage repair costs.
Using the model to optimise mops
The model can be used to optimize one ship’s technology against given opposition in a given scenario:–
- Hold Red Ship constant with all of its equipments set to nominal performance levels.
- Vary performance of each Blue ship component: improve – measure – degrade – measure and restore.
- Repeat for all Blue ship components – install single change that made biggest increase in, say, cost exchange ratios.
- Repeat process until no further increase is observed (for example, for 20-30 cycles)
This process is cumulative selection, by analogy to the way Nature selects beneficial traits. The result is an optimum set of technologies, with ideal MOPs, taken not as separate pieces of equipment, but as part of an integrated whole. This appears to be the best way to derive performance requirements, since it takes a true systems approach, addressing the interactions between the constituent parts of the system, and optimizing the whole system by varying the parts.
Establishing requirements
Figure 15 shows the effects of varying Blue ship’s radar transmitter power from a low to a high value, while Red ship’s was held constant at nominal performance. (The modelled radar was a simple, pulsed radar without spread spectrum, frequency hopping, chirp, and so on.) Some of the results of this simple experiment were counter-intuitive.
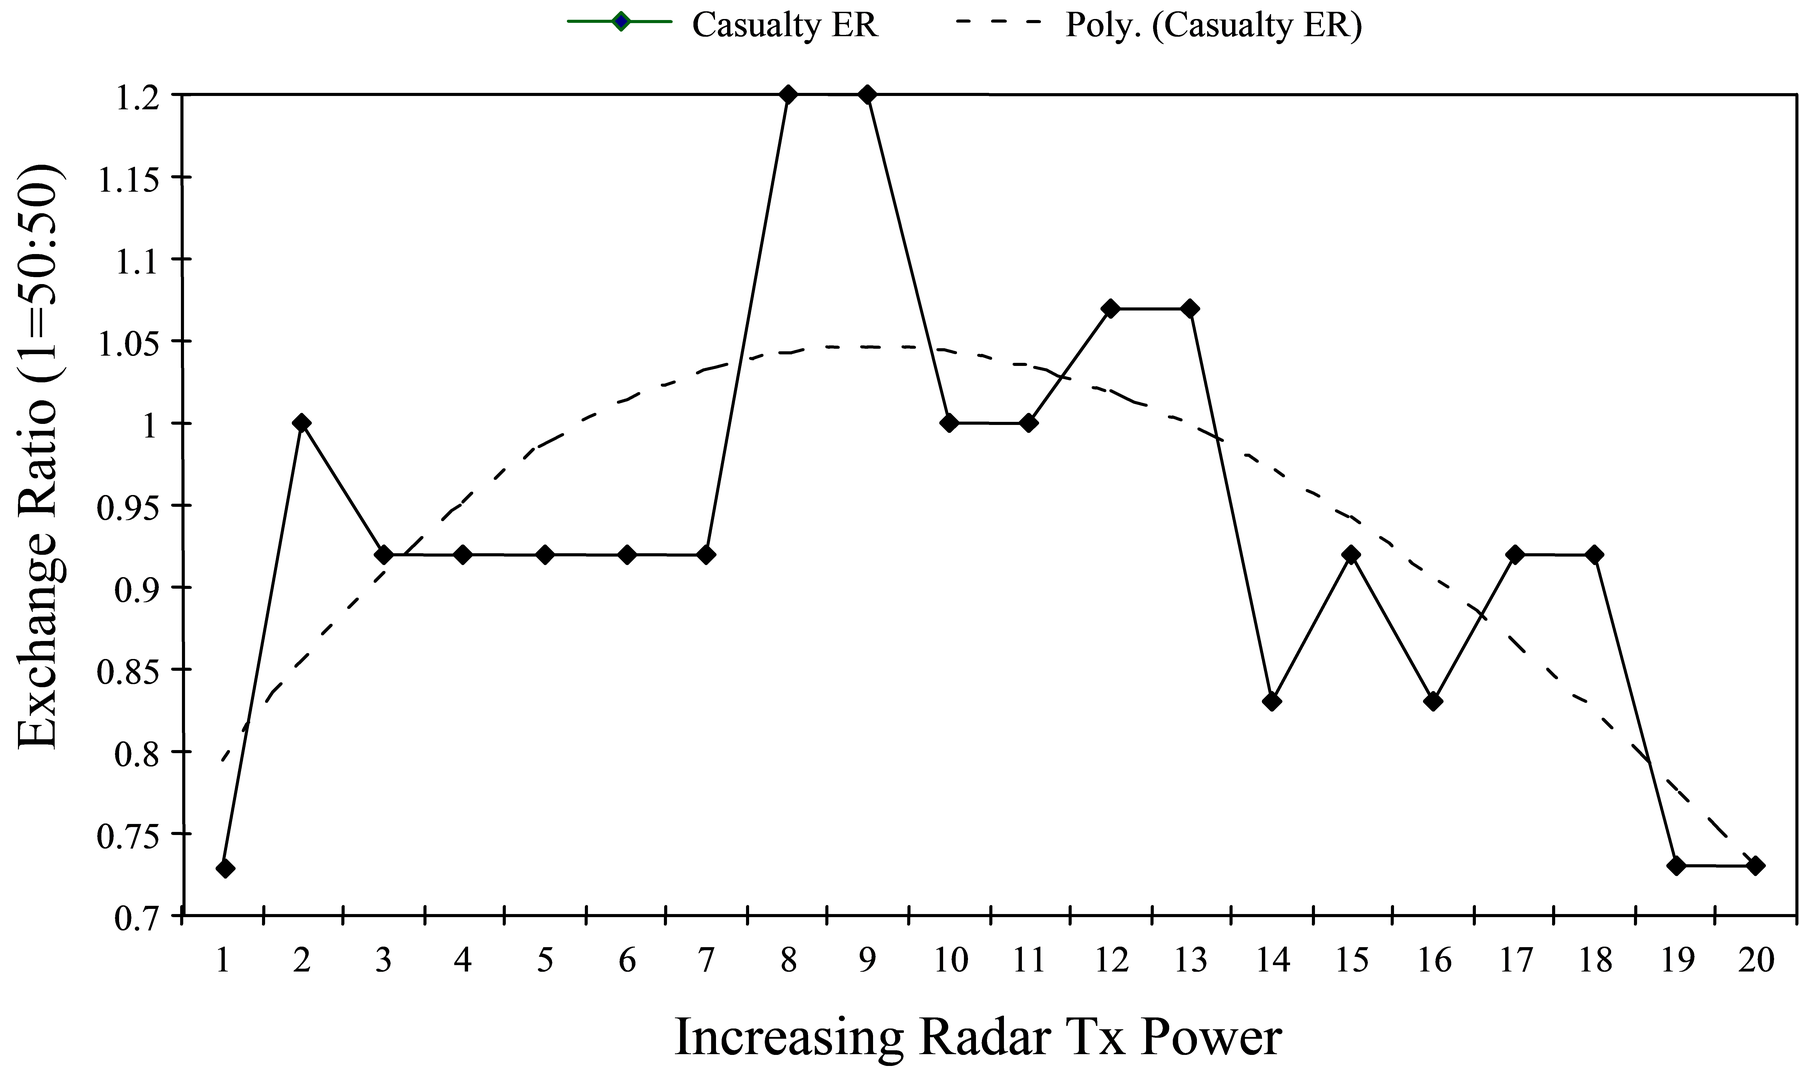
As expected, low Blue transmitter power resulted in an adverse Casualty Exchange Ratio (CER); that is, less than '1' (= 50:50). This is because Blue ship, with low transmitter power, cannot see Red ship, which is able to see and, therefore, fire first.
Unexpectedly, high Blue transmitter power also resulted in adverse CER, this time because the high power alerted Red ship's ESM, giving it early intelligence and again allowing it to fire sooner.
The model, in this very simple case, suggested that there was an optimum Blue radar transmitter power - a factor which will come as no surprise to any naval tactician. It is, however, reassuring to see the model producing such sensible system behaviour.
Evolving COTS in Service
One of the potential values of COTS equipment, in keeping with its relatively short life time, is the potential to upgrade it regularly. Bespoke equipments are upgraded occasionally (for example mid-life upgrades) but COTS are often designed for greater ease of upgrade, not unlike personal computers (PCs).
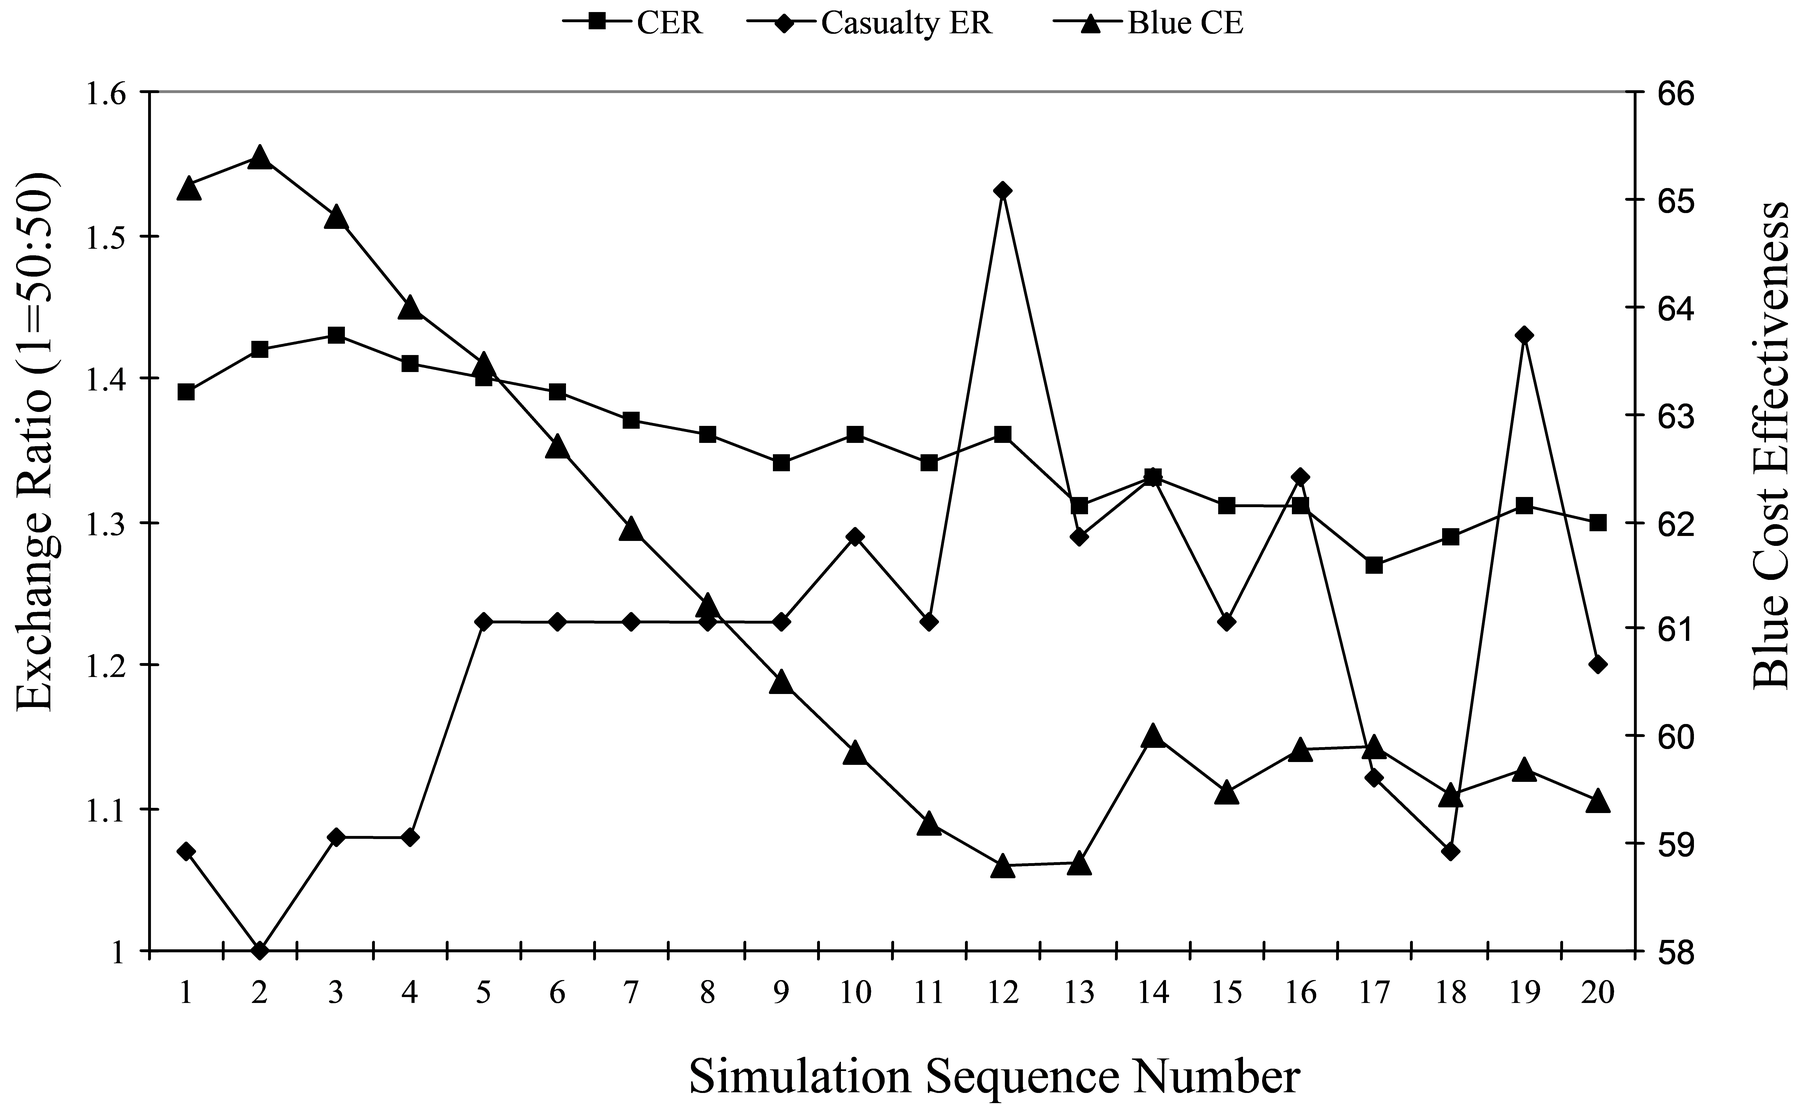
Figure 16 shows the results of an experiment in which Red ship was held constant throughout, and all bespoke. Blue ship was also all bespoke except for the weapon, which was COTS. The COTS weapon had its performance (probability of hit) increased in equal amounts over a simulated 20 upgrades (20 years?), and each upgrade was accompanied by an incremental price increase. The three effectiveness measures for each upgrade represent the outcome of one full engagement, so this graph represents the results from 20 engagements. The cost exchange ratio varied little over the period. The casualty exchange ratio, starting at '1' (= 50:50), gradually climbed, as expected.
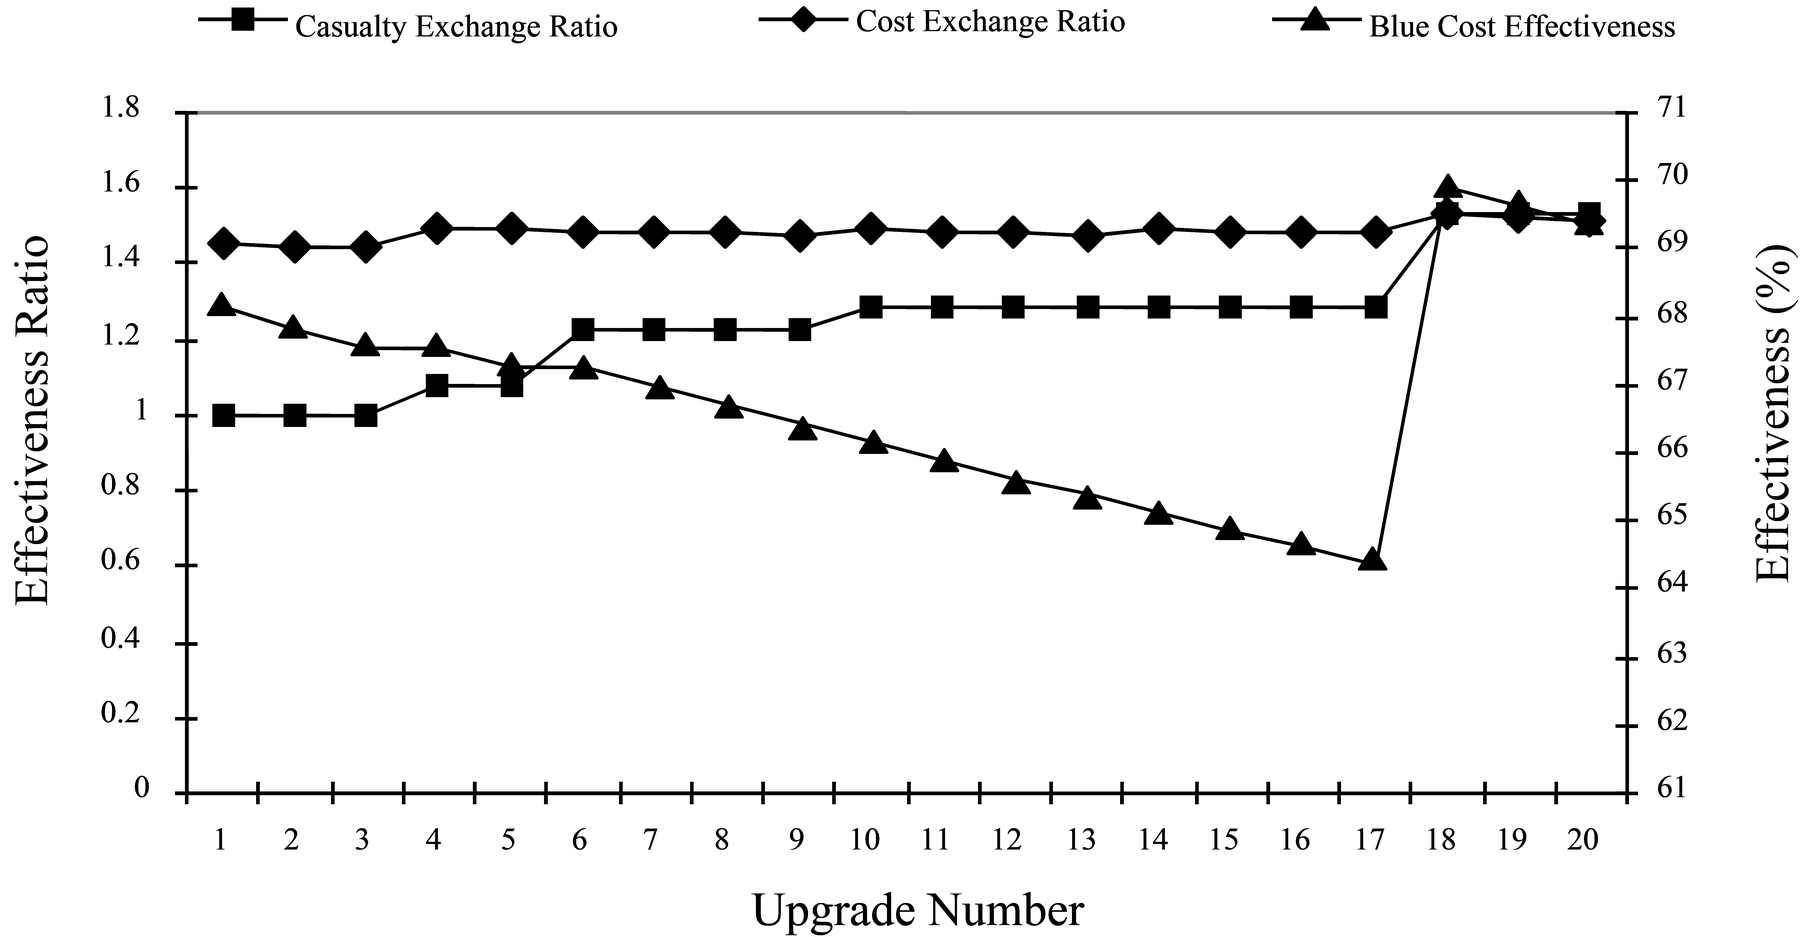
Blue cost effectiveness fell for the first 16 upgrades, then jumped to a high point and subsequently started to fall again. This counter-intuitive behaviour derived from the way cost effectiveness is measured in the model:
Cost Effectiveness = [(Capital Costs – Combat Costs) ÷ Capital Costs] x 100%
For Blue Ship, the Combat Costs increase because the weapon gets more expensive each upgrade, and the effect is marked because of the large number of missiles fired in combat. As the weapon performance is progressively improved, it eventually reaches a level at which it damages Red ship sufficiently so that Red ship is no longer effective. At this point, Blue Combat Costs fall, because it is no longer sustaining damage, and it does not need to fire so many missiles.
This approach, then, permits long-term evaluation of COTS and, in particular, would enable value-for-money of an imminent COTS upgrade to be assessed.
Figure 17 extends the idea that was explored in Figure 16. In Figure 17, not only are the COTS weapon performance and cost increased over 20 periods, but at the same time the amount spent on training the Command and Control team is progressively reduced. In the model, training has several effects: it improves cognition, so that the operators are better able to comprehend what they see on the sensor displays; and training also reduces decision time, so that a trained team responds faster, makes decisions faster and fires weapons sooner. The experiment examined the notion that, with a better weapon, the command team did not need to be quite so sharp, perhaps. The postulated situation is complex.
The graph suggests that different measures of C3I effectiveness might lead to different conclusions. Cost Exchange Ratio falls steadily as missile cost and performance rise. Casualty Exchange Ratio is variable, suggesting that, as the training level falls, random forces are taking over, and there is reducing situation control. Blue Cost effectiveness falls steadily, as the cost of missiles increases. This is one of several areas for on-going research.
Figure 18 illustrates the importance of looking at a variety of effectiveness measures. In this experiment, a COTS weapon was evolved over 20 periods (years). Over that time its performance, measured as Probability of Hit, doubled. Each increment was accompanied by a price rise. The price increment was chosen to make the Cost Exchange Ratio remain at or near unity (50:50) - which it does in a saw-tooth fashion. This was done to establish how much it would be sensible to pay for each performance increment.
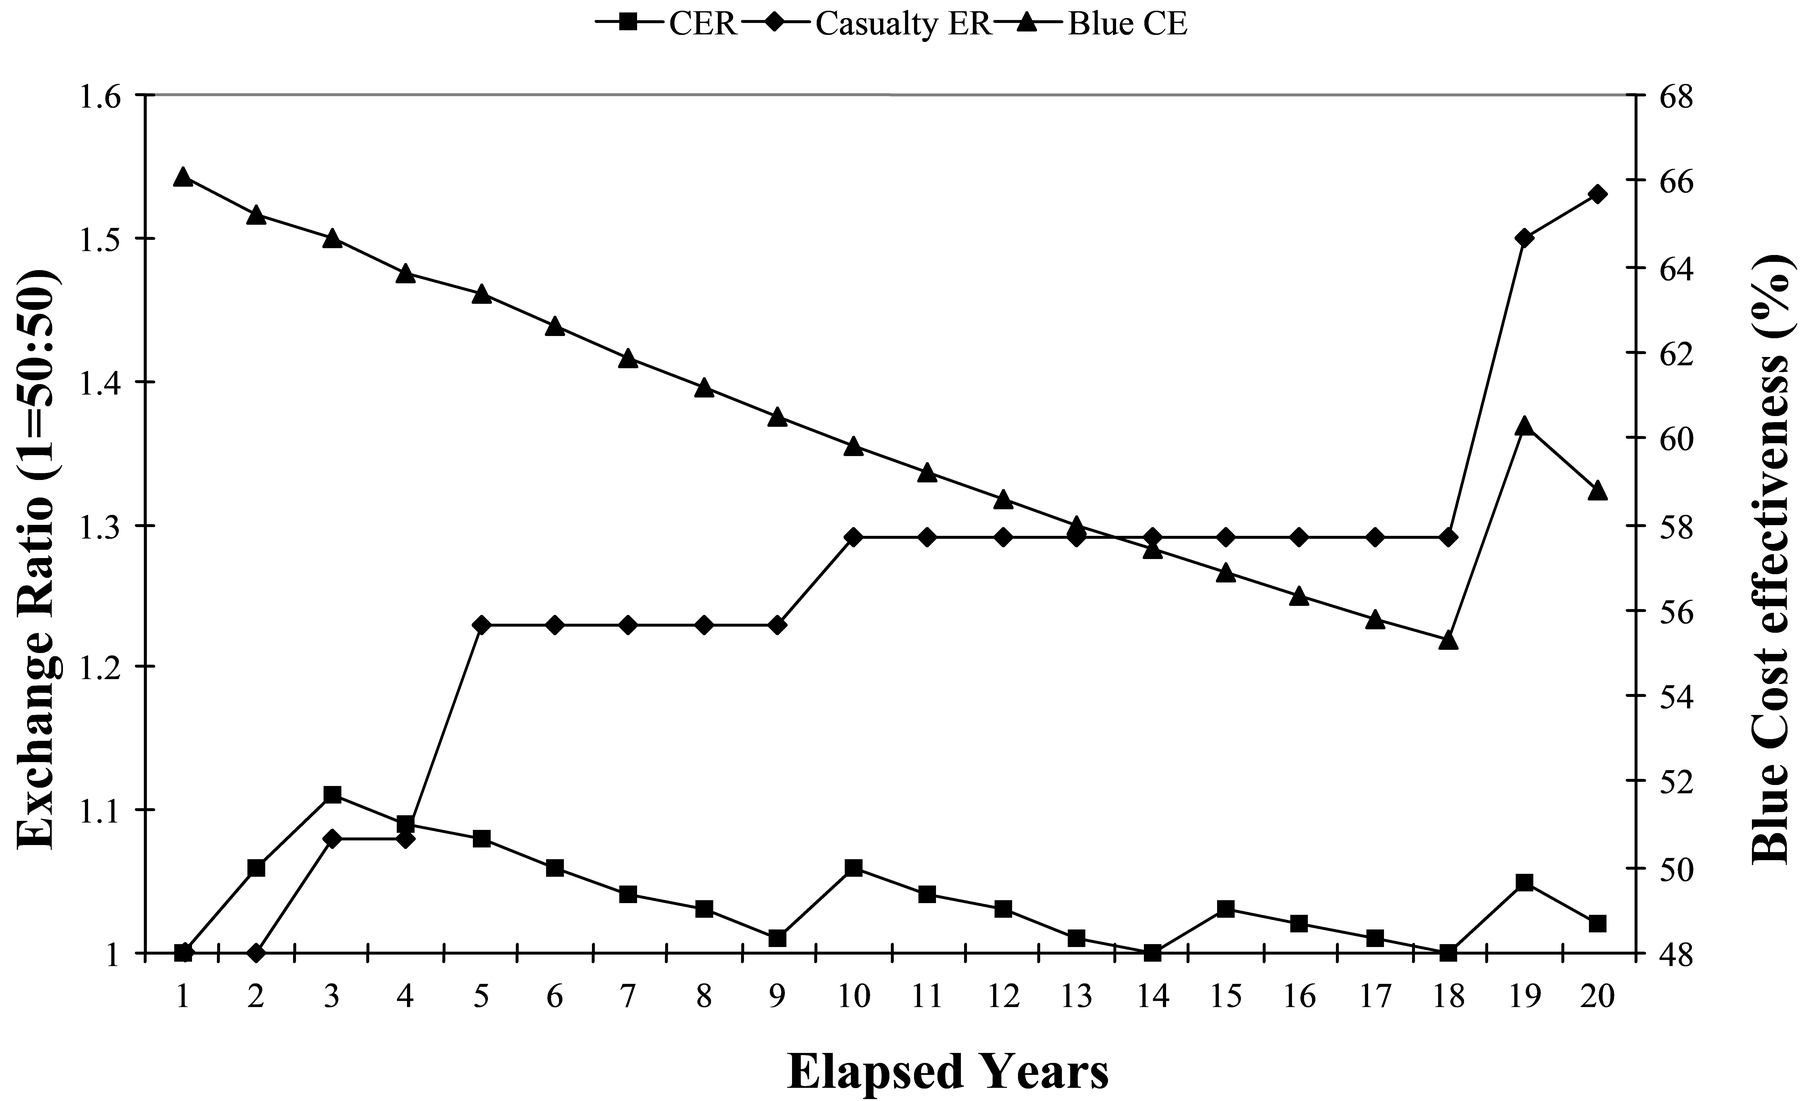
Meanwhile, casualty exchange ratio climbs steadily from unity (50:50) as the weapon performance increases, and Blue Cost Effectiveness falls as Blue ship fires increasingly expensive weapons. At increment 19 there is a discontinuity, as the performance of the weapon goes through a threshold and damages Red ship so that it can no longer inflict damage on Blue.
Observing such threshold effects emphasises the non-linear, counter-intuitive nature of the model. The model produces unexpected results, but these may be traced back to their root causes and explained.
Cautionary note
The approach used here establishes a pair of interacting systems, and holds one of them constant, as a dynamic, interactive reference for the other; their mutual interaction is, nonetheless, complex and varied.
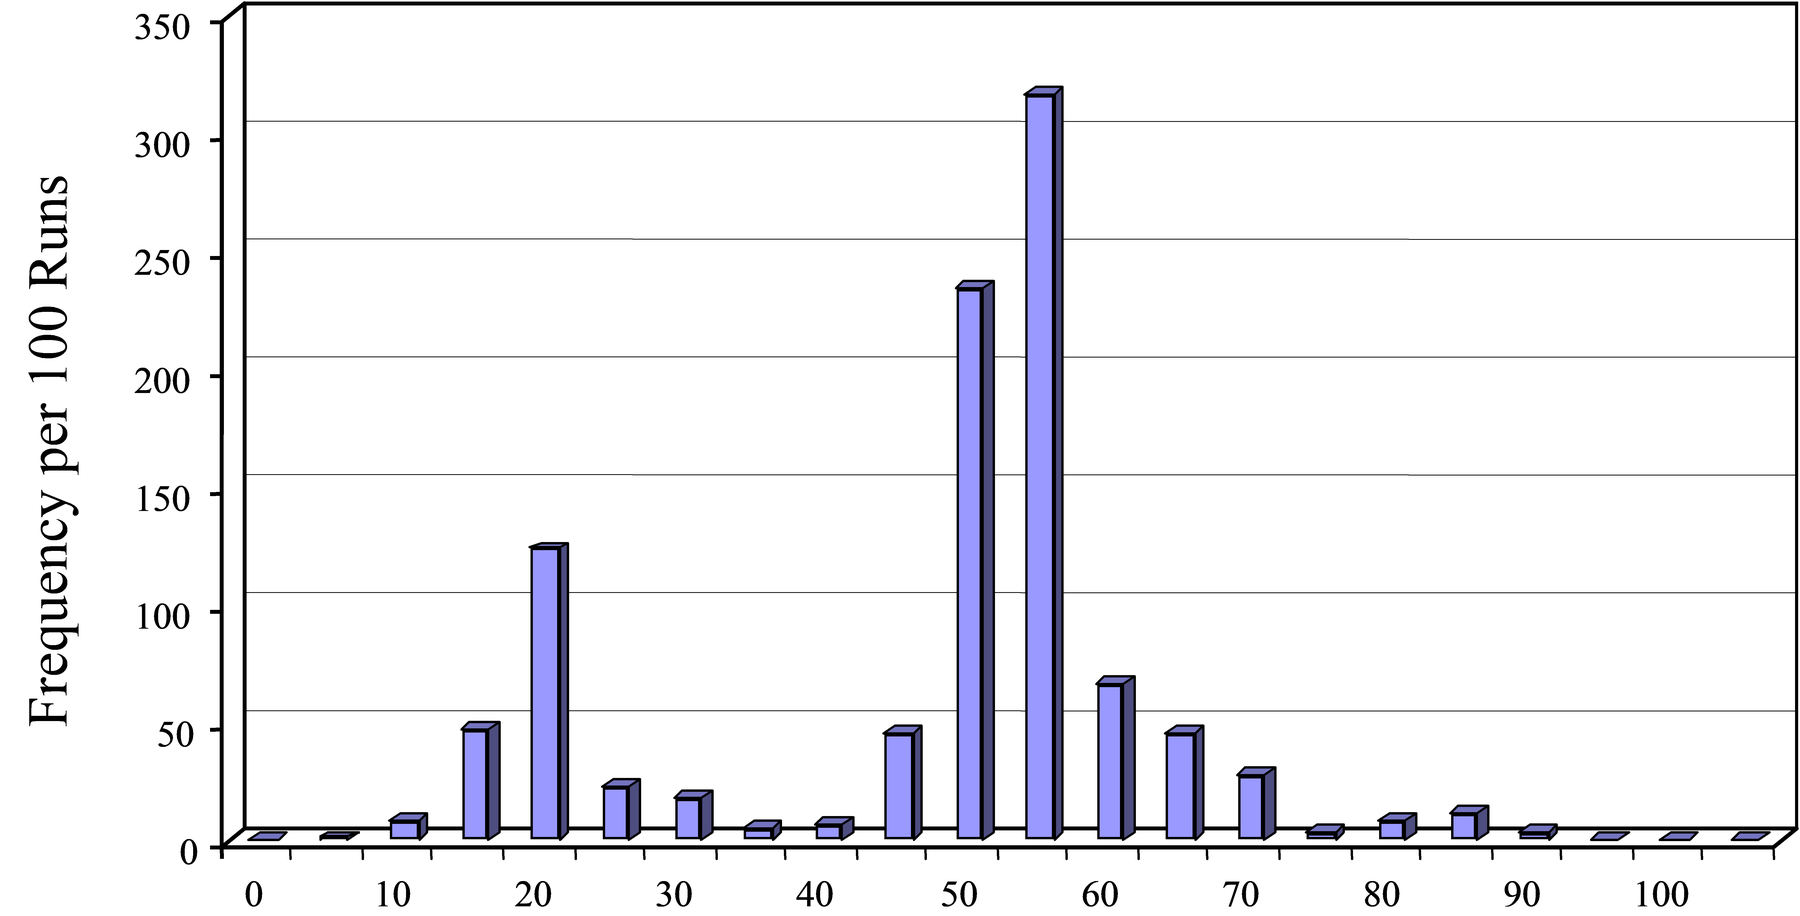
Figure 19 shows the results from 1000 runs of combat between 2 identical ships. The variability evident from the histogram arises from the random pattern of weapon hits that each can inflict on the other. Certainly, the mean, mode and median of such histograms are identical for identical ships, but individual runs could turn up anywhere in the pattern outlined by the graph. The histogram is bimodal because there is a low probability of the ship being sunk. On those few occasions when it sinks, the cost is very high, so the cost-effectiveness is low.
So:
- Each measure of effectiveness is a complex emergent property of the interaction between Red and Blue ships in a particular scenario and environment.
- Combat unpredictability is exacerbated by the complex interactions taking place within and between ships.
- This is not a suitable application for weighting and scoring methods.
Conclusions
Although our work, reported above, has essentially been of an exploratory nature, we believe that it provides the following important insights.
Effectiveness & Emergence
- Effectiveness is a dynamic emergent property, not an arbitrary static property.
- Effectiveness is an emergent property of complex intra-actions (that is internal) and interactions (that is external).
- Effectiveness is sensibly measurable only under dynamic, interactive conditions.
- Different measures of Effectiveness behave differently, and often counter-intuitively.
Specifically, our research results suggest:
- Introducing COTS may benefit one effectiveness measure, but not another.
- Many “improvements” expected from introducing COTS equipment appear marginal, at best, except where the COTS is a consumable; that is, it will be used and replaced in significant numbers.
- The effects of COTS versus bespoke are generally swamped by:
- unpredictability inherent in combat
- human operator/decision-maker performance.
Procurement
For a given battlespace scenario, it would appear possible and practicable to:
- Calculate the optimum mix of COTS/Bespoke.
- Calculate the optimum maintenance and support.
- Calculate the optimum spares holdings
- Too many = high cost = lower cost effectiveness
- Too few = shortage = lower combat effectiveness = lower cost effectiveness.
The method employed accounts for relative contribution of different technology and equipment to success – for example, greater contribution → greater support investment.
Overall, we suggest that the novel white-box modelling approach outlined in this paper provides a valuable scientific way to determine C3I system effectiveness, establish performance requirements necessary to achieve that effectiveness, and calculate maintenance and logistic needs to support that effectiveness. This open, verifiable, system-scientific approach does seem to be both eminently practicable and a reasonable way ahead in an area that has remained vexed for decades.
References
[1] D. Hitchins, Putting Systems to Work, Wiley and Sons, Chichester, UK, 1992.
[2] V.Belton, Multiple Criteria Decision Analysis Practically the Only Way to Choose, Strathclyde University, Glasgow, 1990.
[3] S.Allworth, Introduction to Real-time Software Design. The Macmillan Press Ltd, London, UK, 1981.
[4] A. Jaber, Commercial-Off-The-Shelf (COTS) Procurement for Military Command, Control, Communications and Intelligence (C3I) Systems. MPhil-to-PhD Transfer Report (Supervisor: Professor M. R. Moulding) CISE/DOIS, RMCS, UK, 1999.
[5] D. Hitchins, Systems Thinking, http://www.hitchins.co.uk.
[6] G. Klein, “Recognition Primed Decisions”, Advances in Man Machine Research, Vol. 5, JAI Press, 1989.