
Volume 3, Number 2, July 2000
Training Resource Optimisation - The Processes Of Managing Change
Abstract
Managing the process of continual improvement is a difficult challenge for any business. When training management is viewed as a business centre, managers must also continuously balance the available resources and budget while meeting training requirements. Typical process reengineering allows for the process to be reorganised to meet new technologies or efficiencies. Training cycles though, may not allow for re-engineering of the process due to fixed criteria and parallel training programs; yet process modelling can help optimise this “business centre” as well. The key for using Process Modelling is the overall effort’s orientation and the scope or macro view of the contributing factors and constraints. With the emergence of alternative training delivery methods, the effective analysis of the impact to the overall training cycle is crucial to making effective decisions about equipment, facilities, instructional materials and trainers. The impact of taking students from their jobs must also be assessed given other alternatives. Often, quick fixes simply move the problem around. Process Modelling oriented at the training resource issue can effectively provide information on student throughput, required resources, cost analysis and projected economic data to help justify the change. Sensitivity analysis allows for the overall process to be examined for “what-if” scenarios. Ultimately, the acceptance and use of Training Resource Allocation Modelling (TRAM) in support of Business Process Reengineering (BPR) techniques will leave a continuous improvement legacy process for future training managers.
Introduction
Training programs, regardless of their instructional paradigm, must try to optimise their available resources while meeting training demand. To embrace the concept of continuous upgrade or optimisation requires the introduction of both a tool set and governing processes.
Over the last few decades, many different approaches have emerged to the effective management of change with respect to continuous improvement. At the heart of the different approaches were their basic orientations. During the 1980s Total Quality Management (TQM) and Continuous Process improvement (CPI) philosophically embraced customer involvement as a way to transform user-unfriendly systems and environments into efficient yet customer-oriented processes. Many of the techniques such as Quality Circles, Concurrent Engineering Teams, Cross-functional Teams, Joint Technical Interface Teams, and Collaborative Partnership Teams all focused on human interaction to optimise processes. Thus TQM and CPI were more able to deal with interaction issues rather than fundamental process problems [1]. Also, many of these approaches dealt with qualitative aspects that made improvement difficult to measure let alone empirically monitor. The current re-emergence of the return to bottom-line optimisation has seen a drastic departure from customer satisfaction to stockholder commitment.
Whereas, TQM and CPI were the philosophical base for the 1980s and early to mid 1990s, Business Processes Reengineering (BPR) has emerged as an analytical paradigm for measuring the cause and effect existing processes of strategies, changes, and technology infusion. Yet in reality, until BPR itself adopted the use of simulation-based analysis, BPR itself fell short of the promised goal to re-invent business. Due to the tool set initially used by BPR practitioners, BPR programs could only deal with a limited set of issues over a small percentage of the business enterprise. Embedded within successful BPR programs of today are simulation tools that provide the broader-based quantitative analytical reference required to support decision makers in their effort to chart the course for the next round of “improvement”.
While in actuality both TQM/CPI and BPR may look to improve the same process, each approach uses different criteria to define successful process improvement. Unfortunately, neither is the optimum solution given the exclusion of the other. As is the nature of opposing approaches, both TQM/CPI and BPR practitioners are now starting to realise that it through the combination of qualitative and quantitative solutions by which the bottom line can be impacted while the customer orientation is maintained. Currently, BPR enterprises are beginning to use discrete event simulation (DES) as the fundamental analysis tool. DES can capture existing processes and allow for the inclusion of change or “what-if” scenarios. Through the use of DES, process improvement can focus on both customer satisfaction as well as requirements or bottom line efficiency.
Currently, simulation techniques are being embraced to provide insight over a range of systems and problems especially in actual training environments such as computer-aided instruction, distance learning and Distributed Interactive Simulation (DIS) training systems. Interestingly though, simulation has been slow to be embraced as an alternative to other less-robust and less-accurate decision-support mechanisms within the training management community. Many reasons exist for this. At the heart of the matter are two basic issues: unfamiliarity with simulation-based analysis for BPR; and the perceived risk associated with departing from old analytical techniques and embracing new approaches. In essence the very problem the plagues updating any process also plagues the process improvement paradigms as well—risk and pragmatism.
This paper therefore focuses on both the use of simulation tools to support training management reengineering processes and the governing process that could be utilised to help the training community better plan to meet current needs and forecast future requirements.
Background
The use of tools to support training analysis is not new to the training community. Typically though, flow chart and/or spreadsheet analysis is the analytical tool used for determining the required resources for a particular process as well as forecasting overall “system” capability. Unfortunately, both of these types of approaches have severe drawbacks when used to determine the optimum mix of resources to meet a particular training demand. Figure 1 depicts the actual domain for which these tools can effectively support analysis.
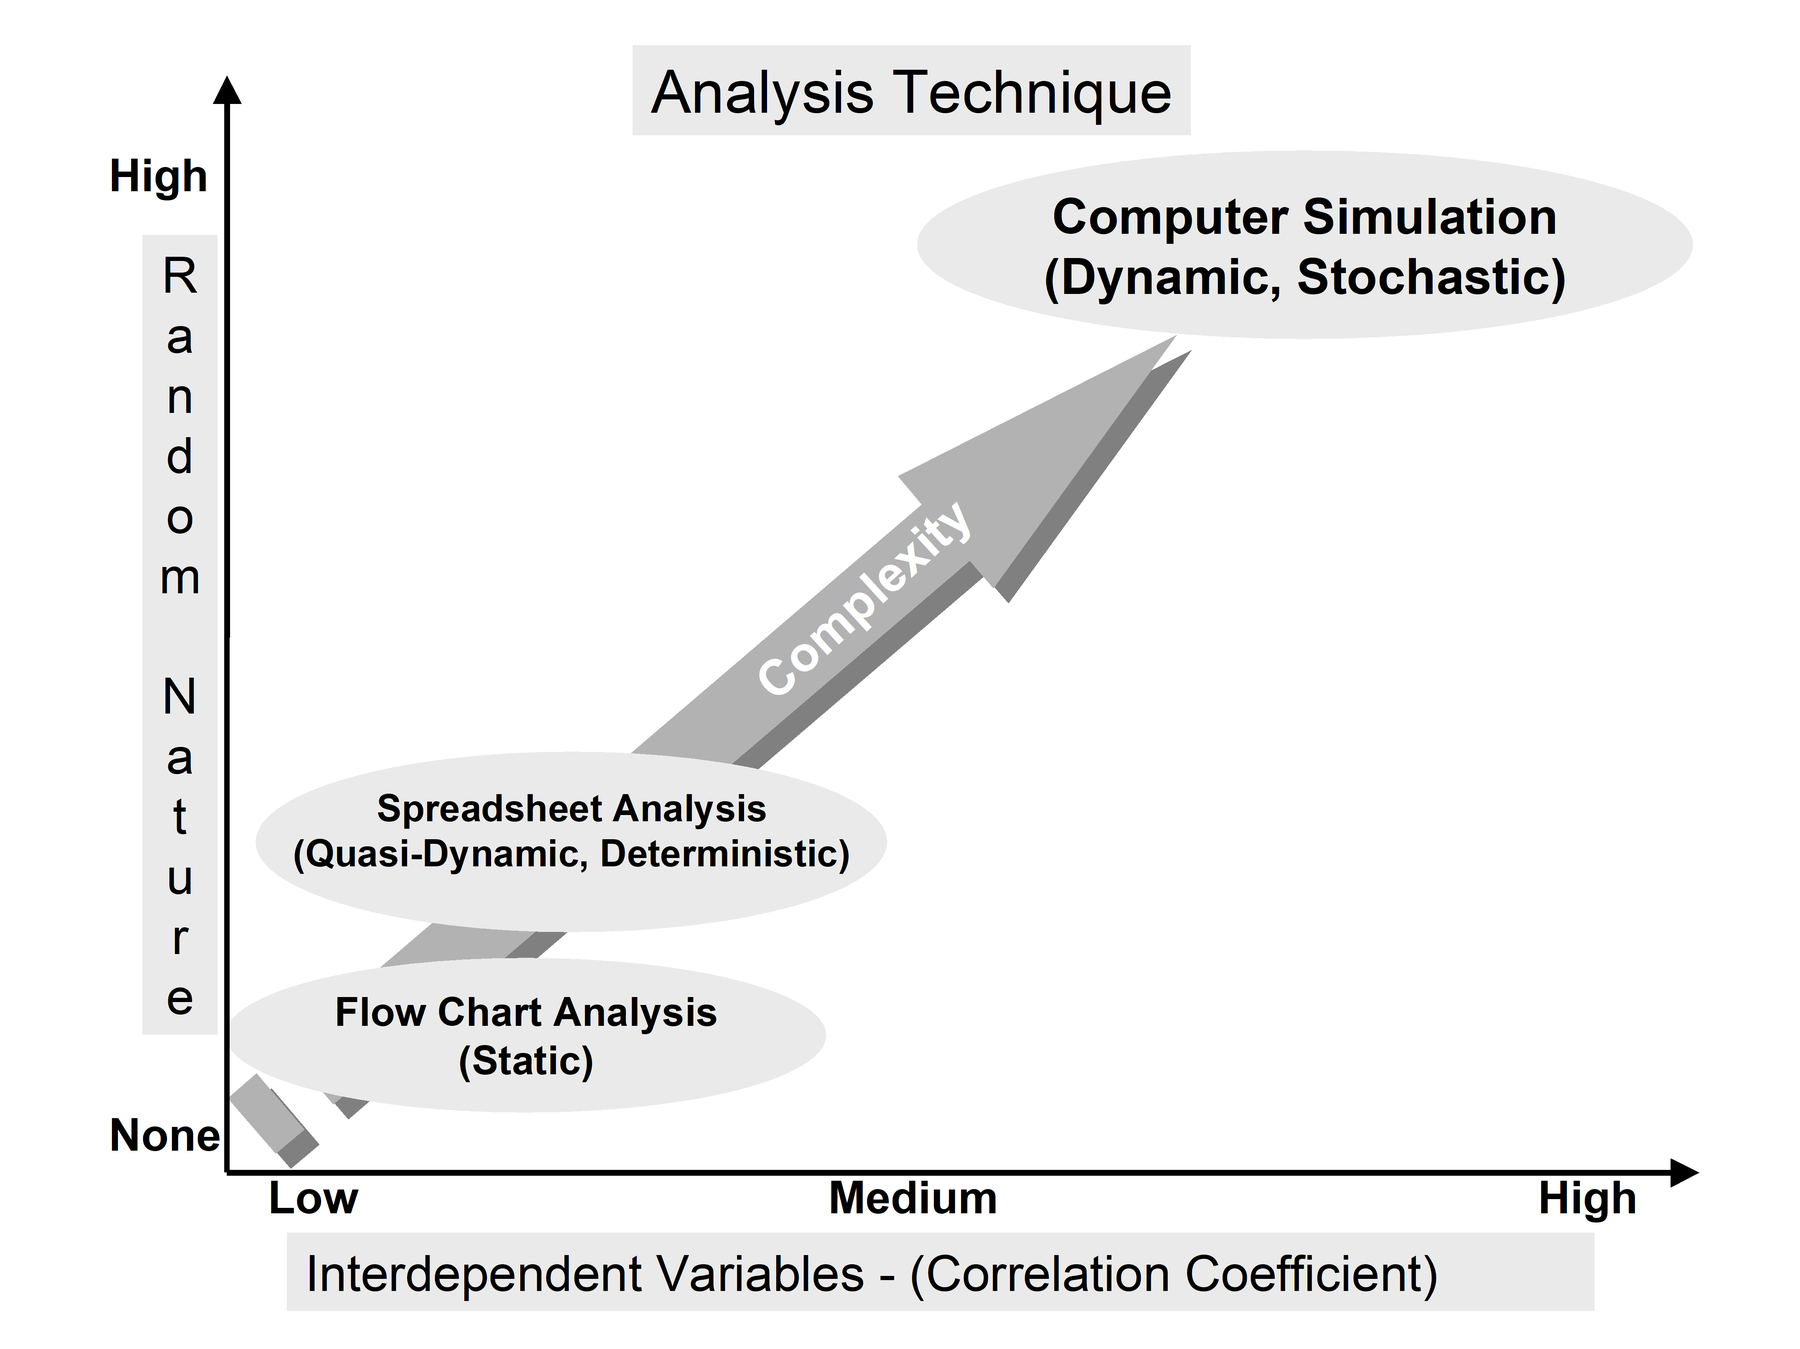
Optimisation issues though, tend to require more analytical capability than can be supported by either flow chart or spreadsheet programs. At the core of the matter is the issue of deterministic versus non-deterministic data. Analysis data can take the form of influences, constraints and requirements. Whereas spreadsheets can represent deterministic quantitative data and their relationships fairly accurately, these same programs can not represent non-deterministic qualitative data and their effect on a training environment. As shown in Figure 1 the more random the influences and interdependent the constraints, the less probable it is for spreadsheet or flow chart analysis to measure alternatives and recommend change, let alone predict capability of a given process.
The challenge of managing change
Managing change more often requires the acceptance of new approaches and technology. Inherent to making changes to a process is the fear of the unknown or associated risk involved. Therefore the acceptance of new technology into a process is directly linked to the perceived risk and conviction of the decision-maker. Moore [2] represents the Technology Adoption Life Cycle as a somewhat skewed bell curve due to a period of time called The Chasm, which represents the reluctance of the majority of the “community” to embrace the new technology. Moore, as represented in Figure 2, was simply explaining that technologists are more willing to embrace new approaches than non-technologists or as he refers to them—Pragmatists.
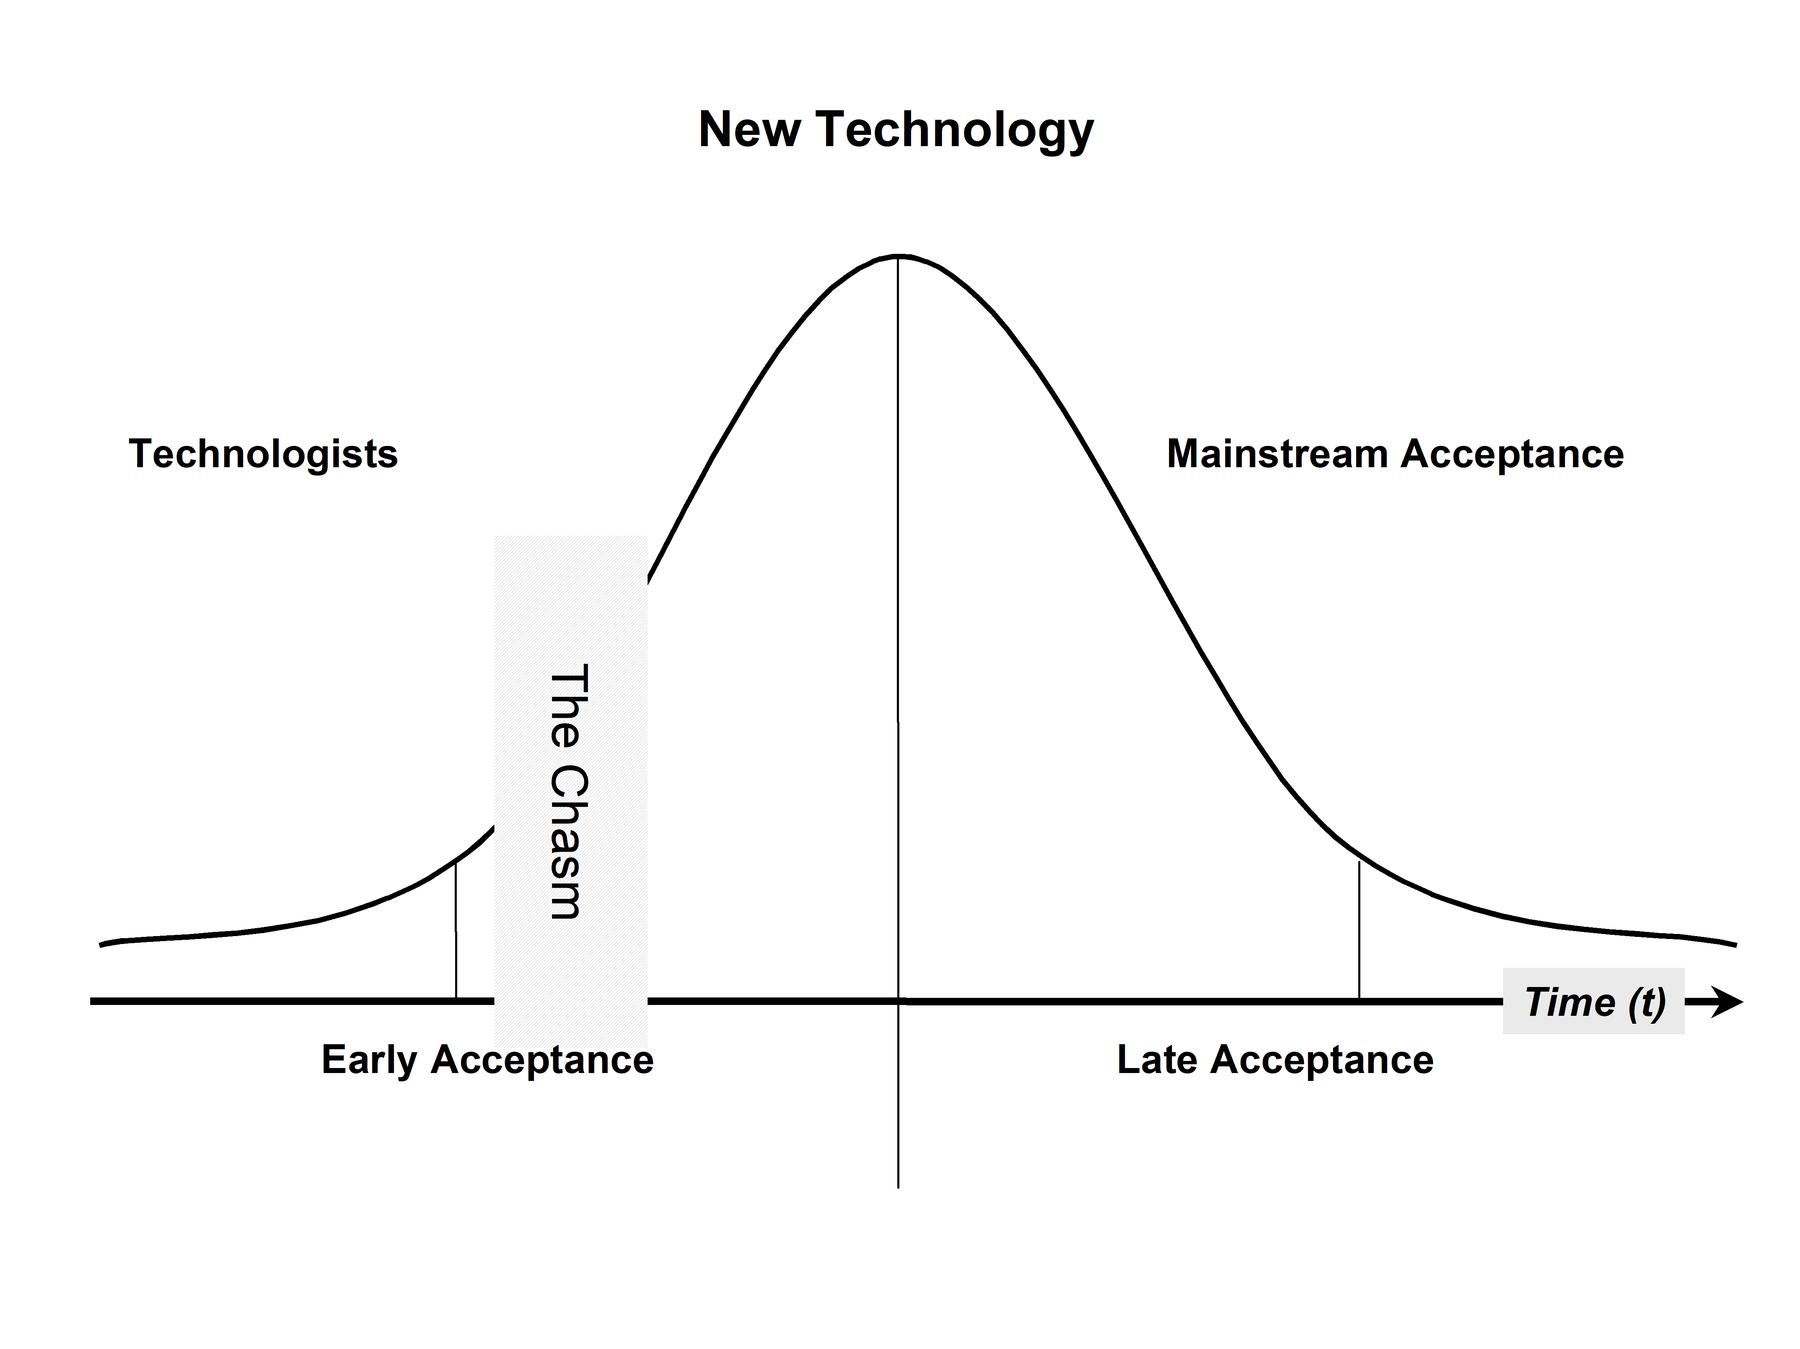
There are many reasons therefore, for the existence of The Chasm or this resistance to change. Central to this reluctance is the perceived risk associated with making a change versus the understanding of the proposed technology. Pragmatists by nature are unwilling to embrace any concept of which they are unfamiliar and for which they must assume both risk and a degree of trust. Some are concerned that the bottom line will be impacted and that they will fail if they embrace a technology or approach of which they do not fully understand. Probably most important, pragmatists are happy with status quo (if it is not broke don’t fix it) and if change must occur, only want to use proven technologies or methods. In reality, all managers must exercise a degree of pragmatic caution rather than leaping to the forefront of a shift in policy or management practices. It is the degree of pragmatism allowed though, that separates avoidance to reaction given a potential solution.
Furthermore, when the basic tool set used to analyse the next step for improvement of a business process is the actual target for that new technology, managers are doubly concerned, if not wary to accept the responsibility for implementing them. Hence the acceptance, understanding and use of simulation as a fundamental analytical business tool faces many challenges.
Managers must first recognise the need for optimisation and thus be willing to embrace a process that brings focus to the effectiveness of a given training program. This crucial first step will institute a legacy process for others to use as managers rotate to other positions. More importantly, the process will establish a baseline for how analysis is to be collectively conducted, and the results reviewed and suggestions implemented. The process itself to include tools will thus be improved over time.
Given the recognised need for an improvement process, managers and decision-makers must then become familiar with what tools support which optimisation techniques. Manager must become familiar with the strengths and weaknesses of the range of tools available to aid in a given decision process. Each of the techniques has both strengths and weaknesses for a given analytical environment. As Figure 1 shows, the increasing level of non-deterministic data coupled with the need for the inclusion of random behaviour impacts the range of tools that will meet the analytical requirements.
Philosophically, managers must gain rewards for practising cost and risk avoidance rather than risk management. Unfortunately, it is actually more difficult to measure quantitatively the impact of risk avoidance than it is to assess risk management activities once an issue has risen. Typical risk management practices dictate that problems are isolated when encountered so that cost and time can be allocated against risk resolution. It is difficult to determine the impact of such programs without a philosophical change to how data is gathered and processed to capture the savings through risk avoidance.
Decision-makers controlling processes must be willing to investigate alternatives to current process management techniques. Managers familiar with alternative approaches are better prepared to implement change prior to a problem arising which may force the issue.
Finally, managers must have faith in their technologists and frontline managers thereby developing a common ground for analysis and acceptance of a given analytical approach. Force feeding technology either up or down the chain of command tends to always return negative-to-marginal results.
Business process reengineering (bpr)
In order to adapt BPR to the training domain, a better understanding of what has been the traditional characterisation of a business process is a fundamental first step. An all-encompassing business process definition is difficult to capture given the varied types of businesses as well as the multiple functions that create a particular business hierarchy. To that end there have been many attempts to define a business process within a general text to include:
A [business] process is a course of action, a series of operations, or a series of changes. Concise Oxford Dictionary
Every organisation exists to accomplish value-adding work. The work is accomplished through a network of processes. Every process has inputs, and the outputs are the results of the process. The structure of the network is not usually a simple sequential structure, but typically is quite complex. International Standards Organisation (ISO) 9000-1
A set of partially ordered steps intended to reach a gaol. A process is decomposable into process steps and process components. The former represents the smallest, atomic level; the latter may range from individual process steps to very large parts of processes. Software Engineering Institute at Carnegie Mellon University (CMU/SEI-93-TR-23)
Processes affect entities. Attrition, communications, and movement are examples of processes. Processes have a level of detail by which they are described. [3]
It is clear that each of these definitions attempt to capture the essence of a business process with respect to a particular perspective. It is also clear that what is missing in the scope of these definitions is additional terms, which also define a business process. These terms include identification of measures of performance and effectiveness with respect to process constraints and influences of a given enterprise. It is these additional attributes required to quantitatively characterise and measure improvement of a given business process that differentiates BPR from TQM or CPI.
BPR supported by simulation-based analysis or process modelling has thus emerged as the combination of the TQM metrics and quantitative analysis. Through hierarchical decomposition, process steps can be captured as well as associated constraints and requirements. Process modelling provides visualisation of a particular hierarchical level of a given set of activities and can thus be used to break down barriers from horizontal or peer organisations and the vertical management structure.
It has been noted that TQM and CPI [1] focused on customer satisfaction. Unfortunately the techniques used were not as much concerned about process efficiency with respect to the bottom line as they were about the customer’s perspective of a given company. Much was done to lower wait times in Banks for example while little thought given to keeping the customer out of the bank through automation or simpler processes.
This is not to say that customer satisfaction is not important, but its relevant importance is based on the business type. Service-oriented businesses have a difficult challenge of both providing customer satisfaction as well as a product that meets expectations for a given cost. It is the combination of customer satisfaction and product value that contributes to a particular business’s survival. Whether the business is a bank of the business of training defence force personnel, satisfaction is shifting to getting the most value for the dollars invested. BPR focuses both on the bottom line—as defined by a particular business centre—and on optimising a given process by including constraints such as cost, resources, time and output requirements.
“continuous” training system improvement
Training centres and individual managers are faced with the daunting challenge of maximising available resources while meeting training requirements. The training process is even more constrained to stay within a budget that was projected possibly some years earlier. Processes within training programs can thus benefit from using simulation-based process-modelling techniques to help optimise current constraints as well as determining the impact of changes resulting from new requirements or technology.
Recent process studies have shown that many of the training centres have fragmented control of the training process and ensuing curricula, thus allowing for the use of different tools and techniques across a given training command. Different managers may use different tools and approaches to assess their part of a program making overall correlation of information impossible. Therefore, it is difficult to assess centrally the impact of changes caused by new technology, changing doctrine, shifting constraints, and/or change in training requirements (let alone coordinate changes and measure results). Couple this with changing operational equipment that must be mirrored by the training equipment and it becomes evident that the typical training environment is a dynamic continuously evolving process or set of processes.
Many of the training challenges centre on the issue of resource constraints. Training resources such as instructors, classrooms, airspace, aircraft, fuel, runways, controllers, instructor pilots, time, available dollars, and training equipment, have a finite availability that is stochastic or random in a given time frame. The overall training process is further impaired by level of random uncertainty caused by scheduled maintenance, un-scheduled down time, sick leave, weather, and so on. While the availability of resources presents a somewhat quantifiable challenge, the actual real-world situation must include overall influences that not only impact resources, but also students and the broader training program itself. If we also take into account available billets, counsellors, textbooks, parking, transportation, or the basic infrastructure we start to get a broader picture of the capability of a training system to support a given throughput.
Simulation-based analysis
In as much as BPR has made great strides in providing a set of supportive methodologies and tools, as noted by Hammer and Champy [4], only 30% of process re-engineering endeavours succeed. The reason they note is that many use ineffective tools to support analysis of a dynamic stochastic process. Another reason noted is the failure to treat a process as a simulation from the very beginning [5].
Simulation techniques provide a valuable alternative to typical analytical approaches to resource allocation problems. Through process abstraction [6], a formalised development step for model development, the analyst is forced to methodically determine the bounds of the process domain and then determine the influences and parameters. In the past, simulation has been viewed as the approach of “last resort” owing to its hidden processes and conflicting results. Today though simulation has evolved to an approach of first resort partially due to the complexities of systems and the interdependencies of their attributes and variables and partially due to the increase in simulation tools and the broad acceptance and legitimisation of simulation techniques and methodologies. The very nature of simulations is to provide basic information that supports:
- Describing Behaviour—explaining the behaviour of a real-world system [7].
- Prescribing Behaviour—describing optimal behaviour for real-world systems.
- Predicting Behaviour—describing or forecasting future states of real-world systems.
- Emulating Behaviour—respond as the real-world system in responding to a range of stimuli [8].
Of particular interest to analysts wishing to understand the nature of a process is the Modelling structure called Process-interaction Method [7]. This methodology maps the movement or flow of an entity through a set of sequential states, which completely define the entire process for that entity.
Process modelling allows for representation of people, processes, and technology as specified by a dynamic set of functional, physical and interaction relationships. The evaluation and trade-off analysis of competing approaches and resources solutions render the use of static flow charts and complex spread sheets as virtually useless. Furthermore, these tools are devoid of any dynamic demonstration or presentation of cause-and-effect issues resulting from point solution changes within an overall process.
Training re-engineering process modelling
With training programs though, both budgets and throughput are often fixed constraints. If we define Training Re-engineering as the continuous improvement of training environments, process modelling also can be utilised to take into account fixed constraints and provide information on how to optimise resources and budgets.
The basic process that underlines a given BPR approach also provides the basis for defining the fidelity and resolution of both the study and the underlying tools. In quantifiable and measurable terms, a governing process specification should capture the nature of the undertaking in terms of Measures of Effectiveness and Performance (MOE/MOP). If the actual measuring metrics can not be defined and agreed to, then save your self the aggravation and money of a costly enterprise whose results will typically be the right answer for the wrong problem.
Once the MOE/MOP have been identified then a BPR formalisation process can begin. This is an extension of the abstraction process defined by Zeigler [9]. Although other authors characterise the modelling process as system simplification, data collection and finally output analysis; this simplistic approach does not capture the required balance between system fidelity and data resolution. That is to say, capturing a real world system in an analytical computer model must undergo an abstraction process that compares influences and constraints with the required degree of quantitative clarity and entity interaction to support the defined MOE/MOP. The basic decision as to what data at what resolution is to be captured at each state change defines the overall utility of the given process to represent a system to support change analysis.
Training resource allocation model (tram) - a praticum
Many training centres are faced with a complex set of problems requiring them to balance constraints such as limited or fixed resources and budget while meeting training requirements. Also the training budget is set well in advance of actually knowing the realities of the actual circumstances in which the solution will be executed. This uncertainty is exacerbated by the types of scheduling and predictive tools typically available and used by the training specialists.
TRAM, as presented in this paper, is intended to show by example how process analysis utilising a simulation tool can visually and analytically aid in understanding the impact of resource constraints resulting from external changes. Although resource modelling can be used for any resource-constrained training program, this example focuses on the dynamics of flight training. This example will allow for the exploration of a possible set of procedures and tools that can in fact help remove the uncertainty from a given training process by representing process activity to the lowest required level. Also, trade-off or “what-if” analysis is also supported so that an optimal solution resulting from a proposed change may be reached.
Tram introduction
In this example, process modelling using a Commercial-Off-The-Shelf (COTS) simulation product [10] has been oriented at analysing the impact of changes on the complete flight-training program. The flight program example includes both academic and flight components and can include multiple training centres as well. The purpose of the model is to help determine the current cost of the training program and the impact of technology changes on resources, throughput and budget.
Hierarchical visualisation
A major advantage of a tool like TRAM is the ability to view the “world” through a set of top-down hierarchical views. Each level can be organised to represent different budget centres, training commands, and/or training programs. Through visualisation, each stakeholder can intuitively understand the represented process and help determine its “correctness” without an in-depth knowledge of the underlying analytical techniques. Instead of having to wade through reams of spreadsheet results, the training manager can actively participate in the up-front development thus helping to insure the accuracy of the represented process. Figure 3 represents the initial top level screen of TRAM for our example. Hidden or underneath each of the major processes is the detailed analysis required to support the decision-maker at each level.
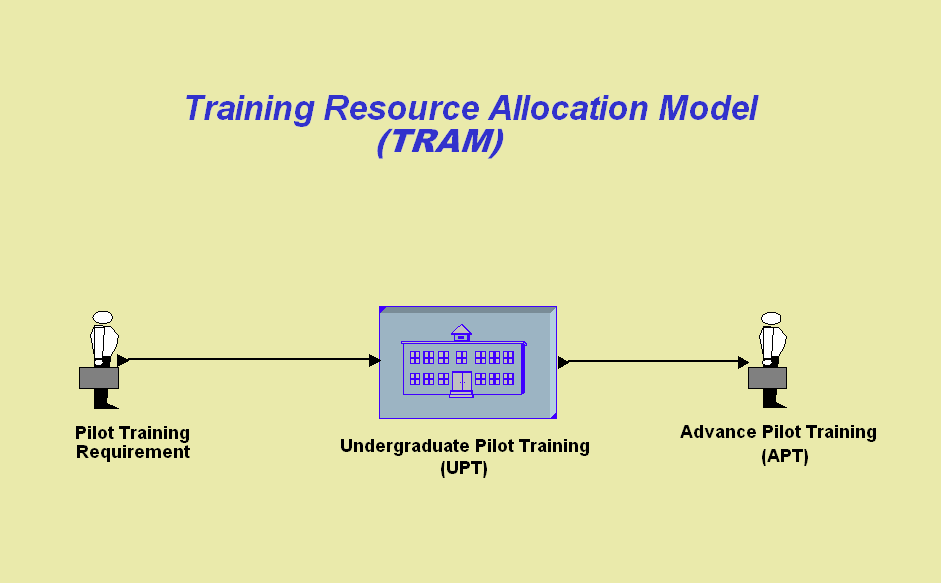
Whereas the top level as shown in Figure 3 sets the analytical bounds (that is, students arrive at a location, undertake training at that location and then depart), the next level (Figure 4) begins to break down into more detail the “undertake training” cycle.
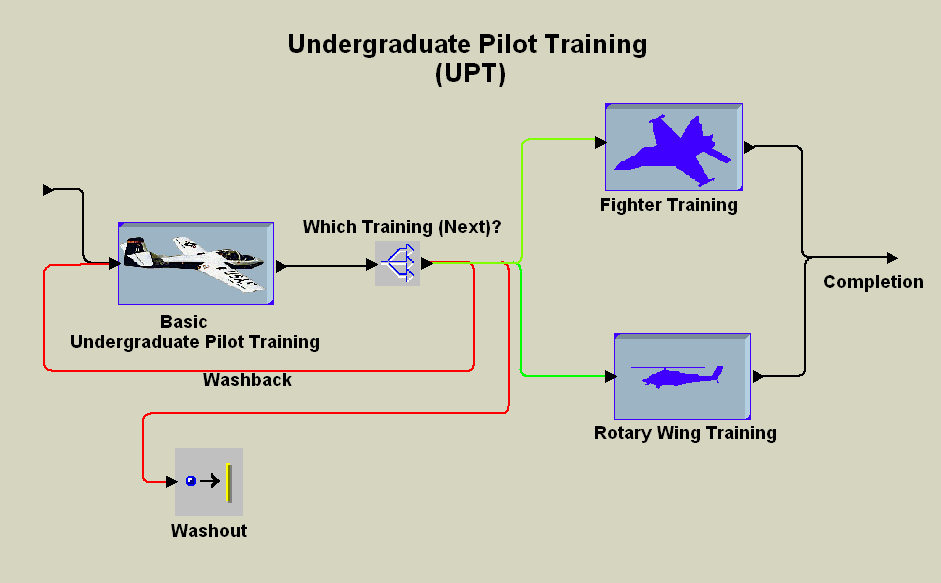
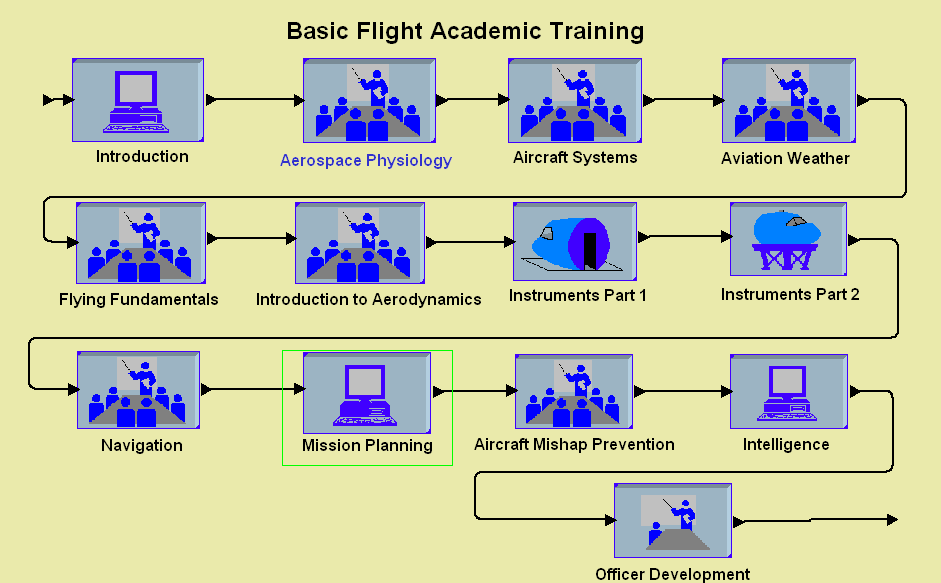
Figure 5 shows the collection of academic classes under the high-level process Basic Undergraduate Pilot Training from the previous figure. As represented each of these processes represent an academic training class that can be joined in a system of priorities and pre-requisites if required.
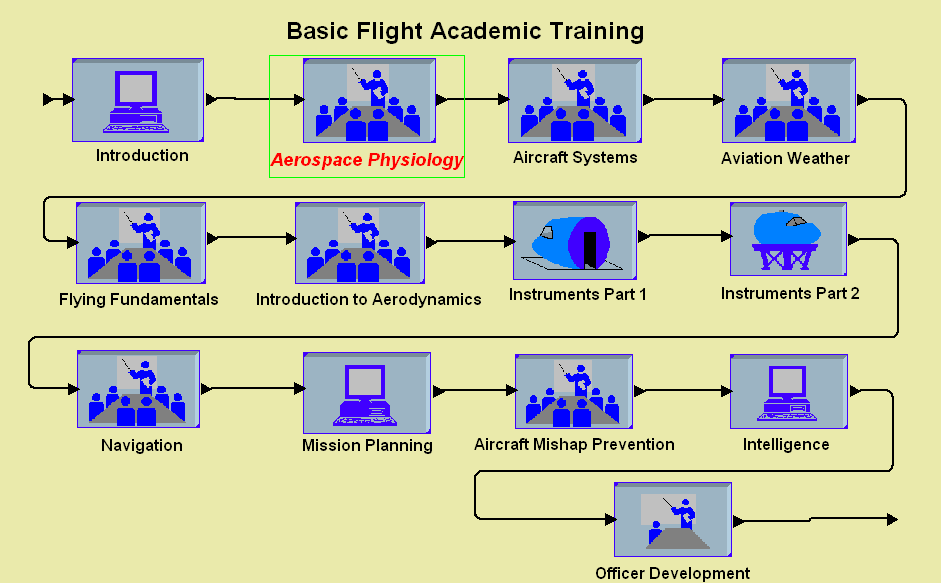
Ultimately each of the processes can be decomposed to the smallest controllable element such as individual learning objectives as shown in Figure 6. The more detail entered into the model, the less variance or uncertainty with respect to the constraints and requirements. More importantly, decisions are thereby based on an ever-increasing level of accurate information.
Resource allocation
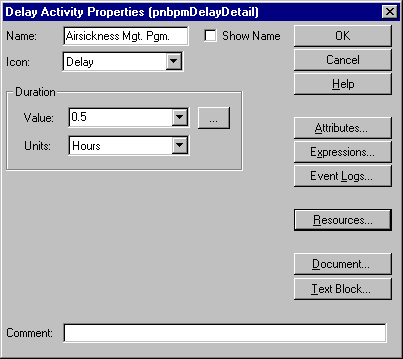
Once a given process has been decomposed to its basic elements, these elements can then be assigned resources that must be available for the particular activity to proceed. Classes of different sizes based on resource constraints can be assembled and then disassembled into individual students for the purpose of tracking training requirements at the individual level. Figure 7 shows the associated time delay screen for the training activity Airsickness Management Program. As can be seen this class is allocated .5 hours for the classroom instruction.
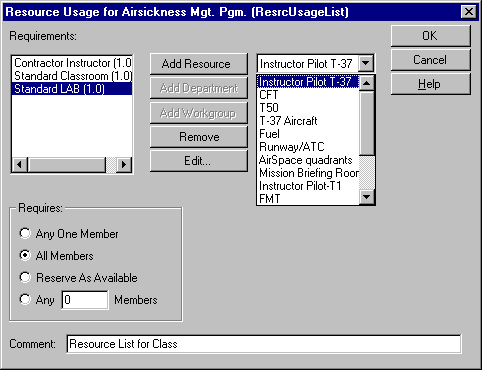
The associated resource screen that allows for controlling and tracking usage of any identified resource is shown in Figure 8. Resources can be characterised by type, amount, cost, and consumption rate if applicable. Priorities can be set too first available or a particular named resource within a group. Our example shows that an Instructor, Standard Classroom and Standard Lab are required for this lecture to be conducted.
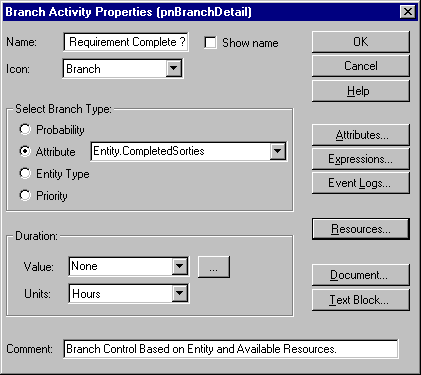
Finally, control within the process can be supported by the use of decision branches (Figure 9). Depending on the decision criteria, applicable next phases are executed as determined by the branch statement. The decision criteria controlling the branch statement can for example, be based on the availability of resources and the success (or failure) of the student event.
Analysis support
Ultimately, any tool selected for supporting a BPR enterprise must supply the user with the required information in a form that is both understandable and defendable. It is therefore helpful to select a toll that can support both a cursory analyses for presentation as well as detailed back-up information for more detailed analysis.
Figure 10 depicts the report menu function for this tool. Since TRAM was intended to support resource management and budgeting it is important to note that the report function menu is oriented at all resource costs over a period of time. Also cost can be either captured vertically (that is, cost per student), or horizontally (that, cost for a given resource over a training period).
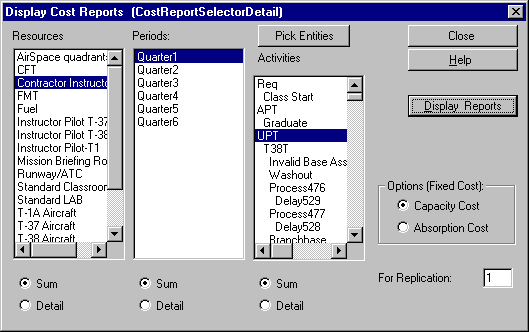
Figures 11 and 12 represent the types of report that this particular tool is capable of producing. This tool can display results in both graphical and report formats. As shown in Figure 9, results can be captured over any defined period of time such as quarterly (weekly, daily). Associated costs can be rolled up or aggregated to any higher level process thus allowing for analysis at any desired fidelity of detail.
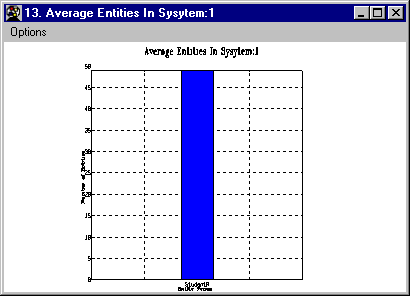
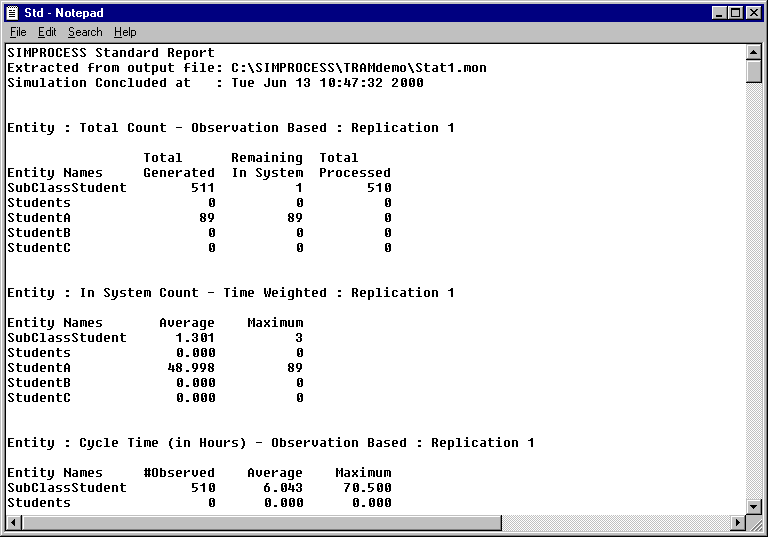
Typically, detailed reports will provide the actual simulation information such as number of Students in system, delay and usage information, length of run, and a range of simulation statistics focused on the variables of interest.
TRAM Summary
Resources consist of physical assets that must be effectively managed to support training requirements. Idle assets as well as overworked assets both can impact quality of students and the overall budget constraints. Typical spreadsheet analysis relies on a list of assumptions about a process that can be lost once a spreadsheet is “inherited” by another manager. Other influences impact training availability that can not be included into spreadsheets thus creating a level of uncertainty or inaccuracy in the output.
TRAM allows for the inclusion of both quantifiable and qualitative data. Both deterministic and stochastic data can be accounted for thus showing the impact of related influences on the overall program.
This example was intended to show that through a commitment to process improvement through simulation-based analysis, decisions resulting from a change in training requirements, resources and other constraints can in fact be captured and analysed in a user-friendly collaborative environment. Although the creation of the initial process model may require specialised support, the up-keep and configuration management of the model can be done by anyone that understands spreadsheet analysis.
Analysis tools
There are a number of simulation tools with graphical interfaces that support business process reengineering and allow for capturing processes and constraints. The specific tool used for this paper is a CACI Products Company tool called SimProcess®. The use of a tool such as SimProcess® allows for the complete representation of a training program and all of the influences, which impact both the students as well as the required resources.
Although, identifying a dynamic tool for use in reengineering programs is essential, the tool itself is not the complete answer. Training improvement processes to be effective must be an integral part of the overall training program and underlying philosophy. Decisions made today must be analysed for their impact on the future. By embracing simulation-based analysis, problems can be identified prior to actual occurrence using “what-if” analysis thus providing a cost avoidance and risk reduction mechanism rather than a risk management or containment process.
Conclusion
Continuous Process Improvement (CPI)/Total Quality Management Techniques (TQM) techniques have traditionally targeted the actual organisational structure of a given set of processes to improve efficiency. The traditional “tool set” was the use of process or product teams to determine the cause of a problem and the best probable fix. Process relationships and interfaces were analysed to determine a more efficient way to “process” a particular activity. BPR techniques, on the other hand, are beginning to use simulation programs to support the analysis of process interactions. Normally, the output variable of interest is time, which implies that lower cycle time is itself the essence of efficiency. While in it may be true that time is money, training management in many cases has a fixed time element and budget. Class schedules are set and student availability fixed to the schedule. Therefore, to support training management, BPR techniques must focus on other issues to support training process improvement.
TRAM has been introduced as an example of how simulation-based analysis can serve as the fundamental decision support tool embedded within an overarching BPR process. New technology, shifting requirements, and budgetary constraints all impact the “quality” over the entire spectrum of training programs. Decisions involving the utilisation of Distance Learning (DL) techniques, Internet-based delivery approaches, Computer Aided Instruction (CAI) to include highly accurate Distributed Interactive Simulation (DIS) environments must be supported by an understandable, repeatable and defendable analysis process. The reliability of the analytical information is essential in order for decision-makers to have the necessary accurate information to support their decisions.
Acknowledgment
The author also wishes to recognise the contribution of Lt. Col. George Selix of the US Air Force Air Education and Training Command (AETC) at Randolph AFB, Texas for his initial support in the proof of concept utilising simulation-based BPR techniques for curriculum analysis and improvement.
References
G. Hansen, Automating Business Process Reengineering, Prentice-Hall, Inc., 1997.
G. Moore, Crossing the Chasm, Harper Business, New York, 1991.
US Department of Defence, A Glossary of Modeling and Simulation Terms for Distributed Interactive Simulation (DIS), August, 1995.
J. Champy and M. Hammer, Reengineering the Corporation: A Manifesto for Business Revolution, Harper Business, New York, 1993.
D. Profozich, Managing Change with Business Process Simulation, Prentice-Hall, Inc., 1998.
B. Zeigler, A. Praehofer, and T. Kim, Theory of Modeling and Simulation – Integrating Discrete Event and Continuous Complex Dynamic Systems, Academic Press, pp. 329-365, 2000.
J. Banks, Handbook of Simulation – Principles, Methodology, Advances, Applications, and Practice, John Wiley & Sons, Inc, New York, 1998.
M. Darby, “Simulation Based Training – Beneath the Shroud”, Journal of Battlefield Technology, Vol. 3 No. 1, pp. 42-53, March 2000.
B. Zeigler, Theory of Modeling and Simulation, Wiley, New York, 1976.
SimProcess® is a registered product of CACI Products Company and integrates Icon-Based process flowcharting, hierarchical event-driven simulation, activity-based costing, and data analysis capabilities into a tool for Business Process Re-engineering.