
Volume 2, Number 1, March 1999
Systems Thinking and System Dynamics Modelling - Aids to Decision Making - A Case Study in Reliability Prediction
Abstract
Sound engineering design, careful component selection, and effective quality management are essential ingredients in the manufacture of reliable equipment. Unfortunately, assemblages of ‘reliable’ equipment can have disappointing reliability in service. Systems thinking, system dynamics modelling and simulation techniques are used to explain this apparent paradox. A satellite communications project is used as a case study to highlight a number of specific reliability prediction issues, and draw out general lessons in strategy development and decision-making.
Background
It is hardly surprising that stochastic processes, those involving chance events, are poorly understood when traditional teaching places so much emphasis on static snapshots of what are essentially dynamic processes. In operational, command and control, or strategic management settings we need to be vitally aware of changes that occur over time if we are to be prepared for future events.
Timing of a future event is not determined by what has passed, and so it is for prediction of failures in systems. A failure today does not preclude a failure tomorrow. Further, Mean Time Between Failures (MTBF), the fundamental parameter used to describe chance of equipment or system failure, can be quite misleading. It is a static parameter, which, by itself, has questionable intrinsic value to aid failure prediction.
This paper examines a high technology project to illustrate that the ways we think about dynamic situations and stochastic processes can be quite inappropriate, and that human perception and predictive skills are poor when it comes to dynamic complexity, especially when systemic feedback is involved.
Managing high technology projects or bringing new systems into service involve a myriad of complex and dynamic factors [1], many of which are stochastic in nature. Even the best-informed commanders or managers can fall into traps when they do not fully understand either stochastic processes or dynamic complexity.
Some 38 years ago Jay W. Forrester, electrical engineer and acknowledged founder of the system dynamics discipline, observed that when feedback structures exist, dynamic behaviour can be difficult to understand or predict [2]. Further, it is the feedback structure itself that is the most important determinant of dynamic behaviour [3]. To make informed decisions we need skills in investigating and understanding these structures and patterns of change over time. These patterns of change become the reference modes of behaviour for study and comparison purposes [4,5].
If feedback loops and how they operate over time are not recognised, are not understood, or are ignored, then managing complex and dynamic systems becomes a hit-and-miss affair. Further, there is ample evidence that human understanding and prediction of behaviour of systems involving feedback is a cause for concern [6,7,8].
This human weakness can lead to serious threats to decision-making, especially when exacerbated by misunderstandings of dynamic complexity and time-dependent stochastic processes.
In high technology and materiel acquisition projects, such threats frequently result in massive cost or schedule over-runs, and failure to achieve required performance. Examples in materiel acquisition include B2 Bomber (US), JINDALEE (AS), and NIMROD (UK). The Channel Tunnel project might be cited as a non-military example [1].
These projects have common characteristics of:
- involving leading-edge technology;
- being dynamic - they involve change over time;
- being complex - they involve a large number of factors and when operating in a dynamic, systemic manner have a propensity for counter-intuitive behaviour;
- being risky- they involve chance events; and
- are subject to political intervention or scrutiny.
It is a matter of history that strategies for managing such projects ignored dominant factors as well as their dynamic and systemic effects so that, at some stage or other, poor strategic decisions were taken.
This paper is not intended as a post-mortem to seek out reasons for failure or poor performance of specific projects but, given the pivotal role of strategic decision-making in large complex projects, it addresses how such decision-making may be improved. Gains accruing from improving strategic decision-making skills could be measured in millions of dollars.
The author has conducted extensive research into decision-making and decision-support in areas such as defence preparedness, materiel acquisition, and management of high technology projects [9]. This paper draws upon research, experience and current work and demonstrates a practical framework and powerful techniques for improving both understanding and decision making, noting that understanding is an essential pre-cursor to informed decision-making.
The case study starts by analysing the reasons for differences between predicted and in-service reliability of a strategic communications network. It demonstrates how systemic factors must be taken into account to provide a complete understanding of the forces at work. When systems thinking and system dynamics techniques are used the picture becomes clearer, and this permits development of better-informed strategies.
SATELLITE PROJECT CASE STUDY
A number of satellite links are currently being installed to form a dedicated regional and international communications network. Satellite links will replace terrestrial bearers that are either unreliable or costly. Each remote earth station is to be configured as shown at Figure 1.
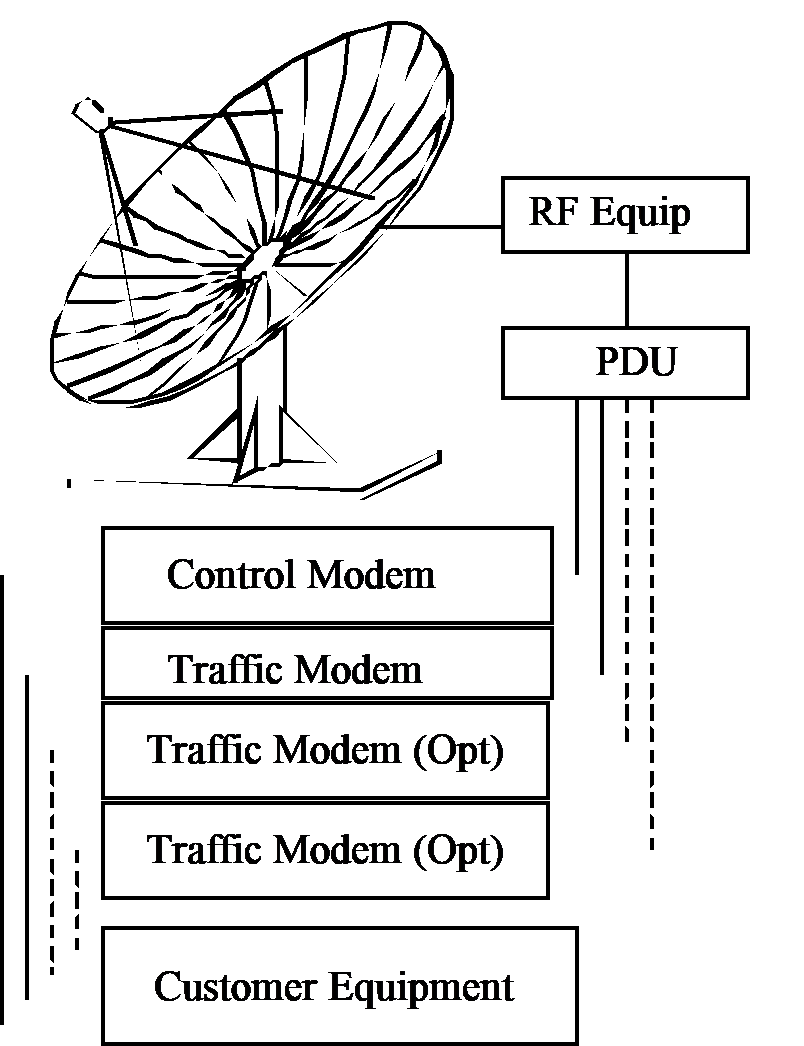
RF equipment shown as an integrated block (RF Equip) incorporates Mil-Spec Low Noise Amplifier, High Power Amplifier, Up Converter, and Down Converter. The Power Distribution Unit (PDU) provides both power and signal to modems and RF equipment. Two types of modem are used, one for monitoring and control, and the other for traffic. For cost reasons and because of a temporary shortage of items off the production line, modems indicated as optional are not being installed in the initial rollout. They may be fitted at a later date.
The project business case requires annual operating costs to be less than extant costs for leasing terrestrial bearers. Early estimates suggest that costs can be contained as proposed in the business case, contingent upon achieving the specified 99% operational availability. Rationale was as follows: if equipment failure puts a station off-line, and this outage might be prolonged, communications will revert to leased lines, for which an additional premium will be paid. Significant re-connection delays would be inevitable. Clearly, the way to avoid additional costs, and to achieve required system operational availability, is to ensure reliability.
A preliminary design review considered system availability and reliability issues and, based on Mean Time Between Failures (MTBF) figures furnished by the original equipment manufacturer (OEM), concluded that a 99% system availability was achievable.
Some scepticism about MTBF figures claimed by the OEM remained in some quarters. Fuelling this scepticism was knowledge that modems delivered were first off a new production line and, hence, were unproven. This scepticism contributed to doubt about achievement of operational availability. These commercial-grade items were neither burnt-in nor stress-tested as part of OEM production acceptance testing.
The temporary shortage of spares meant only six complete sets of spares (excluding satellite dishes) would be available for the first six months of the rollout programme. In this period some 16 stations would be commissioned.
The OEM claimed an MTBF of greater than 10 years as the worst case for a single point of failure, that being the traffic modem. This claim, combined with the shortage of spares mentioned led to a decision not to fit optional modems. Further, initial reliability calculations were interpreted as low risk that available spares would be consumed in the rollout period. Instead, a complete set of spares would be pre-positioned at selected ‘critical’ remote sites for a few months in case of premature failure.
Whether a site was critical or not was a subjective judgement made by the customer. Of course, this meant most sites would not have spares allocated to them. Further, because no spares were to be held centrally, re-distribution of spares was inevitable if failures occurred at sites where spares were not held. This had the knock-on effect of leaving critical sites without spares.
It was also decided early that the logistic support strategy for the next phase of the project would be based on failure patterns that emerged during the initial rollout period. Later, as spares became available, priority would be allocated to retrofitting critical stations.
In the event of a failure, restoration would be undertaken as quickly as spares and availability of technicians would allow, noting that few sites actually had technicians available on a full-time basis. Given that all stations were located at remote sites, with some quite difficult to access, it soon became obvious that if a number of failures occurred in quick succession, spares would have to be relocated rapidly.
As the rollout progressed, a surprising number of failures occurred. Increasing numbers of factors began to influence both operational and logistics aspects of the project. Concurrently, increasing numbers of stakeholders began to exert their influence. The length of this paper precludes full and detailed enunciation of all factors and stakeholders involved.
However, it was evident that operational and logistic strategies were influenced by much more than engineering considerations: politics and, potentially erroneous, intuitive reasoning were beginning to dominate. Nutt (1989) makes the clear point that applying intuition and judgement in such situations is inappropriate and greater use should be made of analytical techniques, even though managers often have an aversion to, or mistrust of, structured analytical techniques [10]. The challenge became to apply techniques that would uncover the underlying issues and their influences over time, especially those that have real impact on achieved reliability.
Methodology in brief
A series of discussions, interviews and workshops were conducted. Decision-makers and stakeholders were invited to take part. Detailed descriptions of the processes involved are covered in research by various authors, notably Vennix [11], Andersen and Richardson [12], Eden, et al [13]. The aim was to elicit domain and operating knowledge, experience, and views from key stakeholders and decision-makers, and to surface their underlying assumptions: techniques are outlined in notable works by Eden [14], Eden, et al, and [15] Mason and Mitroff [16].
All factors considered to have an impact on system reliability were identified and recorded. The interrelationships and influences of these factors were analysed using concept-mapping techniques. A concept or cognitive map [14] is a ‘fuzzy logic’ diagram [17] used to record both causality and stakeholder views for further analysis.
This map and its derivative, the influence diagram [5], informed the process of building a series of system dynamics models.
Applying iterative and interactive strategy development
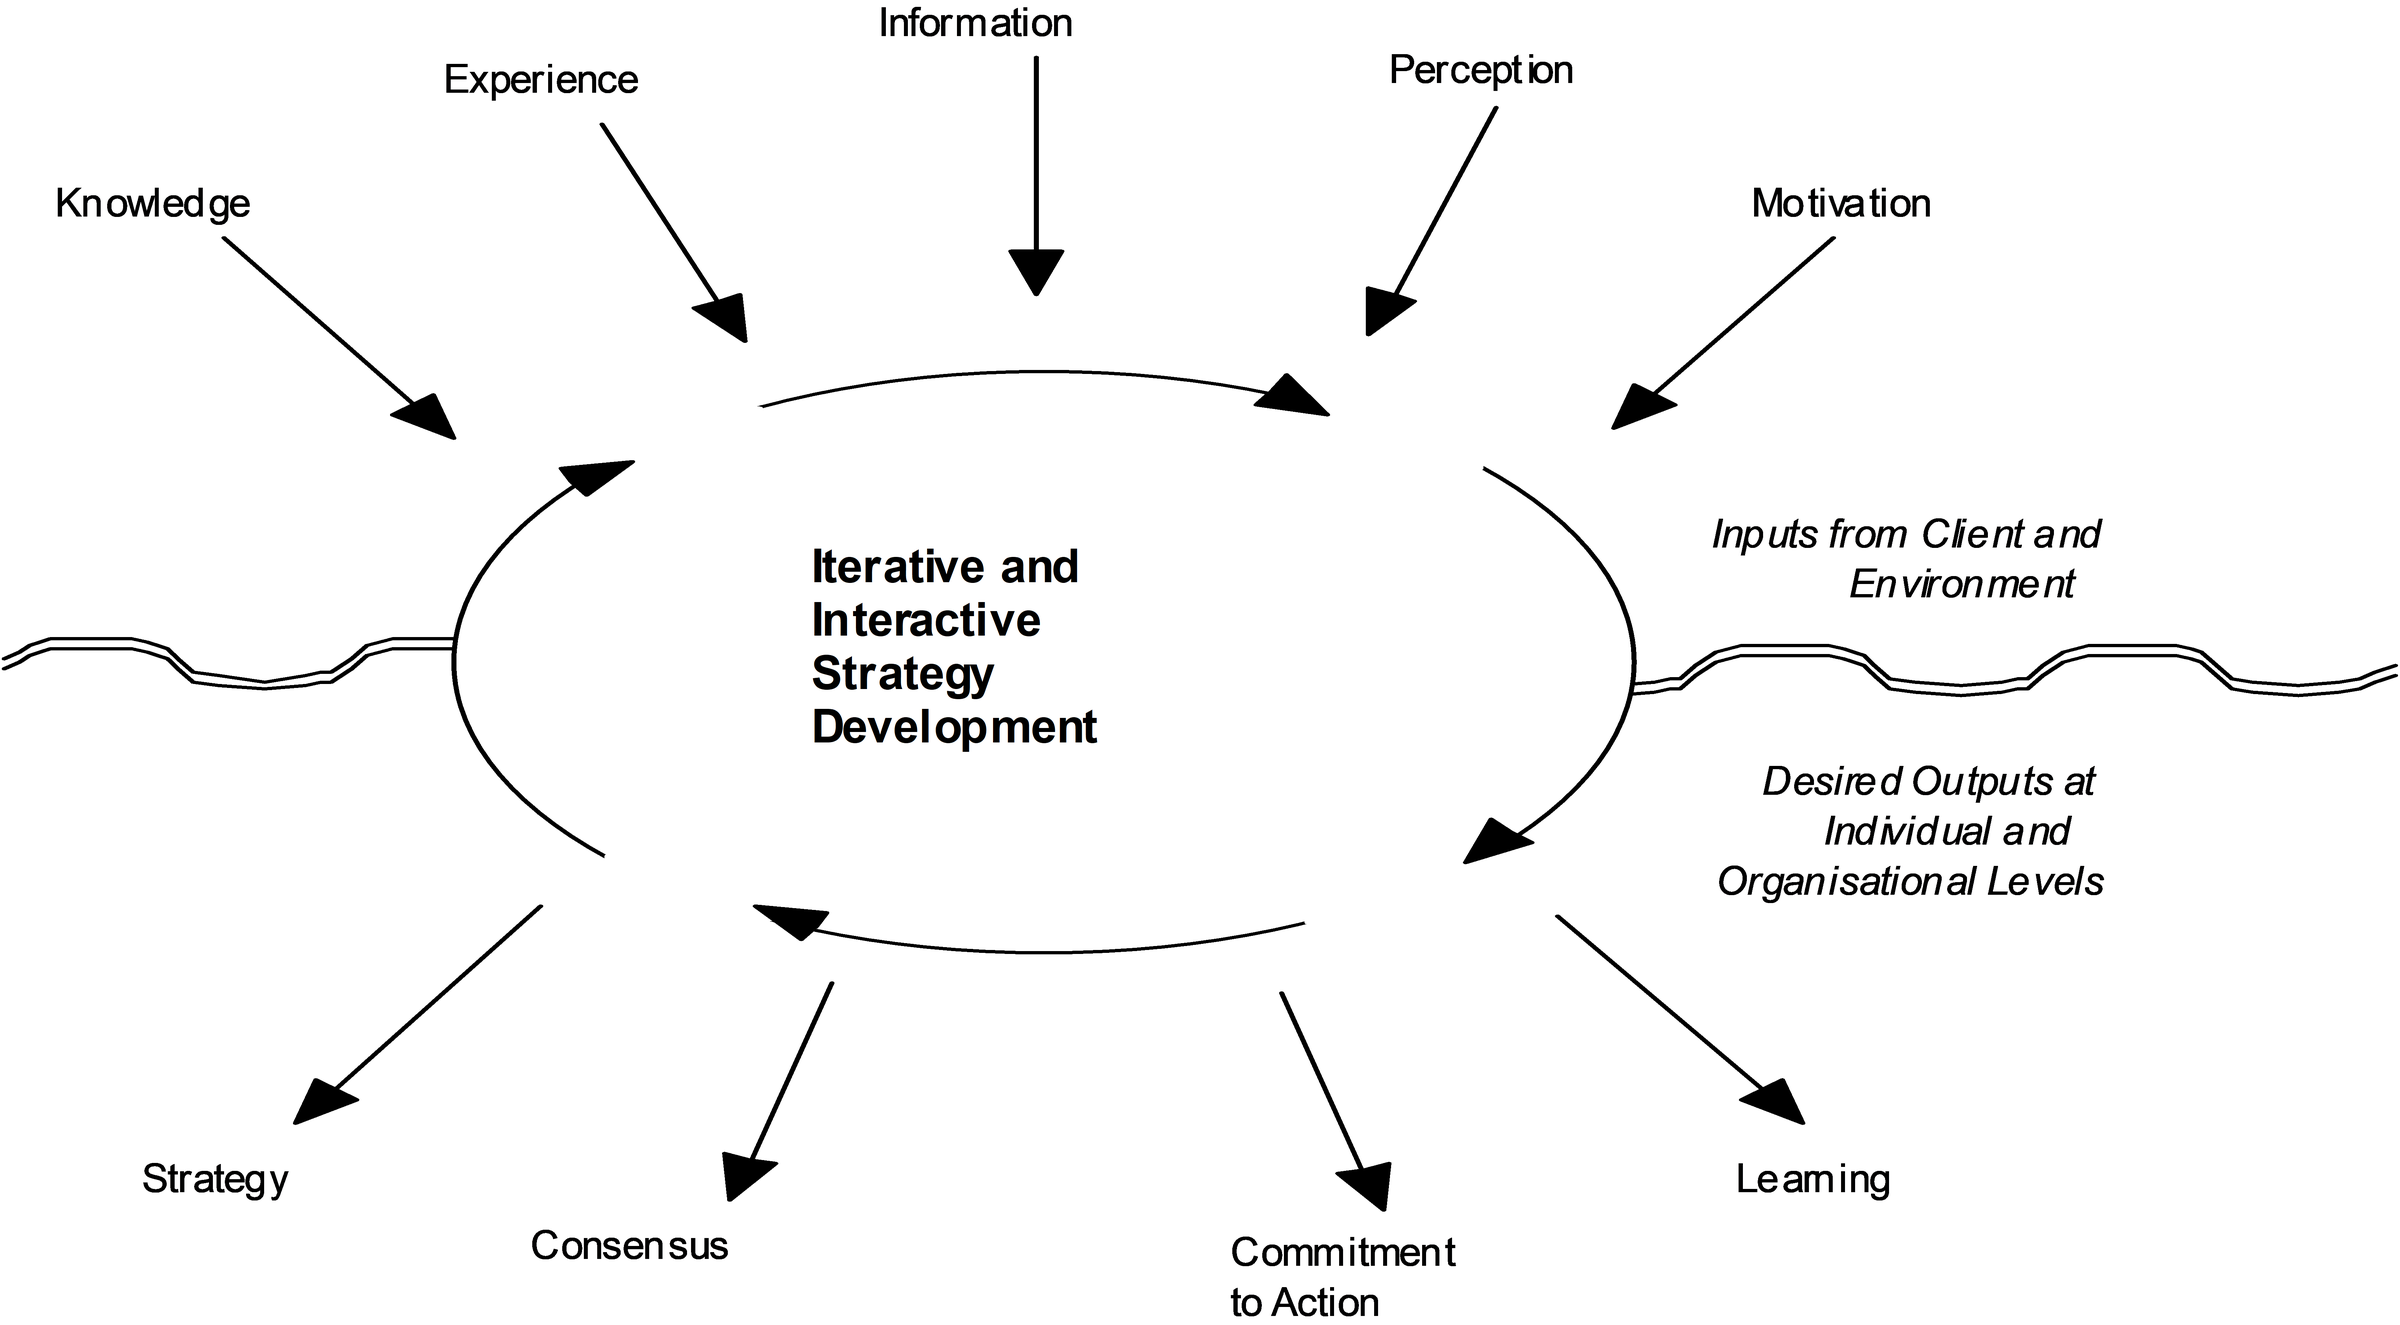
Stakeholders already had quite different perspectives of the problem and there was disagreement that a problem actually existed. These are characteristics of ‘difficult’ or ‘messy’ problems [11,18,16]. Such problems require surfacing and detailed analysis of stakeholder views and assumptions [9,18]. The framework chosen to facilitate this was Iterative and Interactive Strategy Development (IISD) [9,19,20] illustrated in Figure 2.
From the interviews, workshops and discussions a series of cognitive maps, such as that shown in Figure 3, were developed. Whilst cognitive maps for individuals typically contain 30-120 concepts, it is not unusual for cognitive maps constructed during group workshops contain 150-200 concepts [9]. Recording and manipulating large numbers of concepts demands computer-aided recording and analysis. Banxia Decision Explorer™ was used for this purpose. Figure 3 depicts only part of a typical cognitive map.
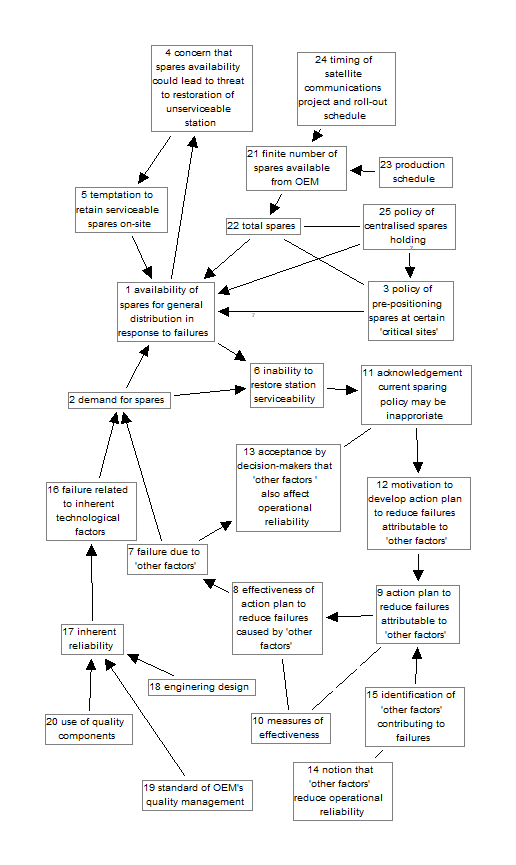
The cognitive maps were used to record the proceedings of meetings, interviews and workshops, and provide the basis for analysis of problematic structure. Lines and arrows represent ‘fuzzy logic’ relationships between connected concepts. An arrow should be read as ‘leads to’ while a line suggests two concepts are linked in a manner that is uncertain, or direction of causality changes with time. A question mark (?) denotes conflict between two concepts. Strength of causality of any link can change over time. Concepts 1-4-5-1 form a simple feedback loop. A more complex loop is 2-6-11-12-9-8-7-2. Concept 1 ‘availability of spares for general distribution in response to failures’ with seven arrows, in or out, is clearly an important node. Models developed from these maps incorporating the most significant and most influential structural elements, such as nodes and feedback loops highlighted here.
These cognitive mapping and system dynamics modelling techniques have been used successfully by Ackermann, Eden and Williams [1] to defend a litigation case in relation to the Channel Tunnel Project.
The next step involved building system dynamics models to replicate the ‘reference modes of behaviour’ [4,5] for system reliability. An overview of the system dynamics modelling approach is shown at Figure 4. Each model was progressively validated and refined, and dynamic behaviour compared with the reference modes. Models were built using Powersim™. When the model was verified and validated, a ‘flight simulator’ interface was built onto it.
![Overview of the system dynamics modelling approach [4].](/journals/journal-of-battlefield-technology/volume-02/issue-02/assets/2-2-5-mclucas/figures/figure04.png)
A flight simulator presents patterns of behaviour in a dynamic and graphic way. It presents to the player only those read-outs and controls critical to the game. This is analogous to a pilot being presented with an altimeter, artificial horizon, airspeed indicator, and joystick. Exposing decision-makers to dynamic behaviour via the medium of a flight overcomes the time-consuming and hazardous task of explaining how the algebra contained in the model actually works [12]. Further, decision-makers’ intellect is best applied to observing time-dependent patterns of behaviour [4].
Each player concentrates on:
- controlling only those parametric values to which the model is sensitive,
- observing behaviour patterns during each simulation, and
- interpreting these behaviour patterns.
The flight simulator proved a valuable tool enabling decision-makers to play out alternate strategies they thought would improve system reliability, without the need for those strategies to be foisted upon the real world.
A fundamental tenet of IISD is that decision-makers are involved as far as possible in the validation process. This involvement commences with validation of the individual cognitive maps, influence diagrams (when they are used), models, and finally the flight simulator.
Close involvement is vital to individual learning and ownership of both models and strategies. Involvement also aids in melding individual perceptions, and is important to building a ‘shared reality’ [21,22] and organisational learning [22,23].
System dynamics modelling and simulation
A modular approach to building system dynamics models was employed: it is as essential here as when building quality software code. One basic module was designed to replicate component equipment failures over time. Virtually any probability density function could have been built into this basic module. A Weibull distribution was most appropriate because in this case study our concern is with the ‘infant mortality’ period. As many of these modules as are needed can be connected in series, parallel, or series/parallel combinations.
Modules, and then complete models were built. These were progressively verified and validated. The modelling goal was to produce a flight simulator which decision-makers could use to learn about the dynamic and stochastic nature of reliability and failure prediction. Armed with this experience and understanding, decision-makers could experiment with the simulator to build and test strategies in a virtual world.
During validation, the OEM was asked to provide latest estimates of equipment reliability. MTBF for the critical single point of failure, the traffic modem, was revised downwards by two years. For some stakeholders, this caused concern whilst others argued that the OEM was being optimistic. Design of the model permitted MTBF estimates ranging from 8-12 years (approx 70,000-105,000 hours) and, again, this permitted players to experiment with parametric values across the range.
The model’s flight simulator interface is shown at Figure 5. Four gauges ‘ALPHA’, ‘BETA’, ‘MTBF_Years’ and ‘Risk_Surges_Spikes’ permit player input. ‘Composit_Weibull’ provides an instantaneous display of the probability of failure for the cumulative number of stations as they are rolled out, compared to the steady state probability of failure, which is given a unit reference value. ‘Composit_Weibull’ also appears as the top curve graphed against time. ‘Total_Fails’ are instantaneously displayed on the gauge, and over time on the graph. These are visible as individual spikes along the time axis. The model pauses and sounds a warning when ‘Total_Fails’ reaches six, signalling that available spares have been totally consumed. The graph labelled ‘Infant_Weibull(1) ’ shows the probability of failure for the first remote earth station with respect to time.
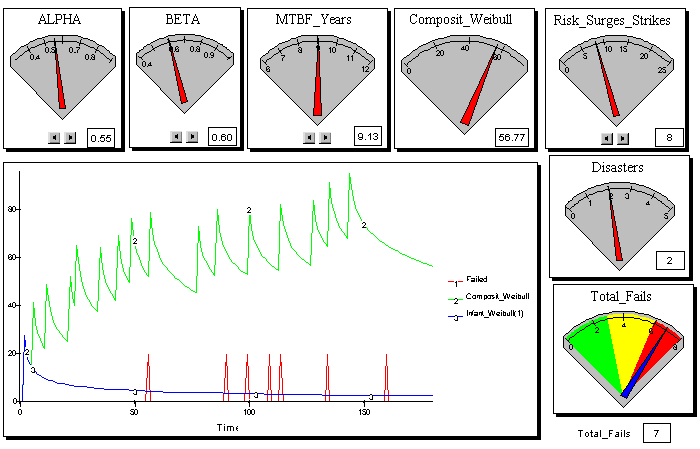
Decision-makers were free to fly the simulator as often as they chose. The simulator demonstrated what failures might be expected during the first six months of the rollout.
The player was challenged to choose sets of parametric values with the aim of keep the number of ‘Total_Fails’ to a minimum. Parameters that could be varied by the player were:
- α and β, the shaping factors for the Weibull Distribution. These determine the magnitude of first part of the 'bathtub' curve, that is, the height of the side of tub, its slope, and how quickly 'steady state' failure rates are reached.
- MTBF.
- An aggregated parameter 'Risk_Surges_Strikes' allowing for the influence of environmental risk factors and chance events on reliability, such as:
- lightning strikes on the satellite dish;
- spikes through mains power supplies;
- potential difference between earths for racks containing customer equipment and satellite terminal indoor equipment;
- induction in long cable runs; and
- loss of satellite transponder.
Play and learn
Those who played the simulator would learn several important lessons, which, in turn, would shape systems integration, installation, and logistic-support strategies:
- Transient early failure rates are affected more by the shaping factors and rather than MTBF per se. and are influenced, for example, by physical state of the equipment on delivery, care during installation, and the extent to which equipment was burnt-in before delivery.
- Environmental risk factors and chance events remain constant throughout life. These are site-specific.
- As equipment matures, transient early failures will diminish whilst environmental risk factors and chance events will remain constant. The latter will dominate in the long-term.
After a series of games, each player was asked to explain:
- how they believed parameters, acting singly and in combination, affected reliability;
- practical implications of their ‘preferred’ combination of parametric values, that is, those best representing their preferred strategy;
- what, in practice, might be done to achieve lowest failure rates;
- the advantages and disadvantages of centralised versus dispersed spares holdings;
- the effect that availability of spares might have on achieved reliability; and
- given no shortage of spares, what priority they would allocate to providing redundant modems, and why.
Players' answers to these questions provided a basis for logistics strategies both for the current and future phases of the project.
At the end of each IISD iteration, stakeholder cognitive maps were reviewed and updated, and models enhanced to enable further analysis and testing of strategies, and the cycle continues ...
Conclusions
Judgement and intuition are inappropriate when dealing with complex, dynamic and systemic problems, particularly those involving stochastic processes. Instead, decision-makers need effective tools and techniques to enhance understanding.
Understanding of systemic behaviour over time is a critical pre-cursor to strategy development and decision-making.
The case study presented in this paper demonstrates how systems thinking and system dynamics modelling, including the use of flight simulators, can facilitate understanding, and aid strategy development and decision-making.
Flight simulators are particularly valuable in providing insights into stochastic processes and facilitating testing in a virtual world in anticipation of real world implementation.
References
[1] F. Ackermann, C. Eden, and T. Williams, ‘Modelling for Litigation: Mixing Qualitative and Quantitative Approaches’, Interfaces, 27, pp. 48-65, 1997.
[2] J. Forrester, Industrial Dynamics, Productivity Press, Portland, Oregon, 1961.
[3] J. Forrester, Principles of Systems, Productivity Press, Cambridge, Massachusetts, 1968.
[4] G. Richardson, and A. Pugh, Introduction to System Dynamics Modelling, MIT Press/Wright-Allen, Portland, Oregon, 1981.
[5] R. Coyle, System Dynamics Modelling: A Practical Approach, Chapman and Hall, London, 1996.
[6] J. Forrester, ‘Counter Intuitive Behaviour of Social Systems’, Technology Review No. 73, January, pp. 52-68, 1971.
[7] J. Sterman, ‘Misperceptions of Feedback in Dynamic Decision Making’, in Milling, P. and Zahn E. (eds), International System Dynamics Conference: Computer-Based Management of Complex System, International System Dynamics Society, Stuttgart, pp. 21-31, 1989.
[8] J. Sterman, ‘Modeling Managerial Behaviour: Misperceptions of Feedback in a Dynamic Decision Making Experiment’, Management Science, Vol. 35, No. 3, pp. 321-339, 1989.
[9] A. McLucas, Integrating Hard and Soft Systems Analysis: Seeking a Practical Framework for Addressing Strategic Issues, ME Thesis, UNSW College, ADFA, 1999.
[10] P. Nutt, Making Tough Decisions: Tactics for Improving Managerial Decision Making, Jossey-Bass, San Francisco, 1989.
[11] J. Vennix, Group Model Building: Facilitating Team Learning Using System Dynamics, John Wiley and Sons, Chichester, UK, 1996.
[12] D. Andersen and G. Richardson, ‘Scripts for Group Model Building’, System Dynamics Review, Vol. 13, No. 2, Summer 1997.
[13] C. Eden, S. Jones and D. Sims, Messing About in Problems: An Informal Structured Approach to Their Identification and Management, Permagon Press, Oxford and New York, 1983.
[14] C. Eden, ‘Cognitive Mapping’, European Journal of Operational Research, Vol. 36, No. 1, pp. 1-13, 1988.
[15] C. Eden, ‘Cognitive Mapping and Problem Structuring for System Dynamics Model Building’, System Dynamics Review, Vol. 10, No. 2-3, pp. 257-276, 1994.
[16] R. Mason and I. Mitroff, Challenging Strategic Assumptions: Theory, Cases and Techniques, Wiley-Interscience, New York, 1981.
[17] B. Kosko, Fuzzy Thinking: The New Science of Fuzzy Logic, Harper Collins, London, 1993.
[18] H. Rittel, ‘On the Planning Crisis: Systems Analysis of the First and Second Generations’, Bedriftsokonomen, NR8, pp. 390-396, 1972.
[19] A. McLucas, ‘Integrating Soft and Hard Systems Analysis: Seeking a Practical Framework for Addressing Strategic Problems’, Proceedings of SE’98: Systems Engineering Pragmatic Solutions to Today’s Real World Problems, Systems Engineering Society of Australia, Oct 1998.
[20] K. Linard and A. McLucas, ‘Addressing Complexity and Systemic Behaviour in Engineering Management: A Tutorial for Real-life Problems’, UICEE Proceedings of the 2nd Asia-Pacific Forum on Engineering & Technology Education, July 1999.
[21] R. Espejo, ‘What is Systems Thinking’, System Dynamics Review, Vol. 10, No. 2-3, Summer-Fall, pp. 199-212, 1994.
[22] P. Senge, The Fifth Discipline: The Art and Practice of the Learning Organisation, Doubleday, New York, 1990.
[23] J. Morecroft and J. Sterman, Modeling for Learning Organizations, Productivity Press, Portland, Oregon, 1994.