
Volume 2, Number 1, March 1999
Overcoming the Limitations of Imaging in Hot Climates
Abstract
This paper discusses techniques for overcoming two problems associated with detecting and classifying small targets in tropical environments on hot sunny days. The first problem is associated with ground-based imaging through a turbulent atmosphere, rising up from the sunlit hot ground. Of interest are ways of reducing the level of apparent shape distortion and motion, and blurred edges. The second problem is the daytime detection of targets in cluttered sunlit woodland. Targets dwelling in the shadows are obscured in scenes dominated by the sunlit foliage and sunlit ground. A method of filtered thermal imaging suppresses the sunlit and sun-heated features and provides a means of detecting thermal signatures of shaded objects.
Introduction
Electro-optic sensors, such as infrared and visible cameras, provide a means for target detection and classification. This is usually achieved through recognising the shape of the target features or other signature characteristics, such as hot spots or movement. Recent work has focussed on the problems associated with detecting and classifying small targets in tropical environments on hot sunny days. This paper discusses two techniques that have been developed to overcome some of the worst effects of atmospheric turbulence and scene clutter.
The first addresses the limitations in image resolution caused by heat-related atmospheric turbulence, which is often faced by ground-mounted sensors. In arid semi-desert and savanna-like regions, where the open ground is flat and strongly solar heated, a heat haze forms above the ground during sunny days. This turbulent air structure severely limits the ability to detect and recognise shapes at distances longer than a few hundred metres. The image in Figure 1 shows the effects of shape distortion and blurring at 500m.
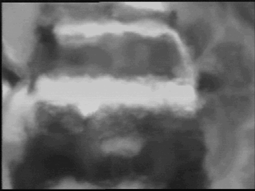
This paper discusses the means of overcoming the worst effects of heat haze.
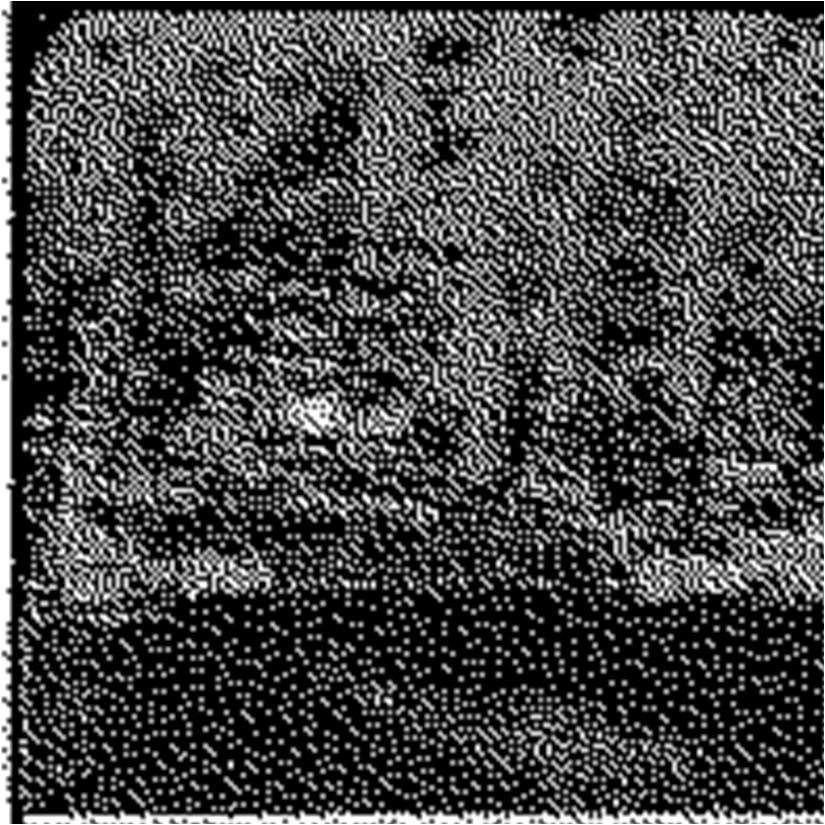
The second problem of interest is the daytime detection of targets in cluttered sunlit woodland. During hot sunny weather, people often keep themselves and their equipment in the shaded regions of woodland, for the simple reason of comfort as well as for concealment. This behaviour makes target classification, for purposes of identifying friend, foe or neutral, very difficult. Normal daytime TV suffers problems associated with searching the wide expanses of woodland, the partial obscuration of target shape by the sunlit foliage, and attempts to image objects underneath the foliage within the shadows. Thermal infrared imaging, which at night-time can detect unusual thermal contrast within a cluttered scene, is however swamped during daytime by widespread brightness associated with solar heating of vegetation, rock and soil, as well as reflected sunlight. An example of a daytime thermal image on a hot day is shown in Figure 2. The absence of cool regions makes the raw image look washed out. The shaded areas are warm and the sunlit regions are hot. A vehicle within the trees lies undetected in this raw image. This paper shows how the application of a filter process can detect the vehicle’s location.
Strong turbulence
In regions where ground forces may regularly experience a long line-of-sight, such as within savannas and semi-deserts, the effectiveness of their binoculars and cameras is often severely limited by the turbulent atmosphere rising from the hot sunlit ground. Distant objects cannot be clearly identified during the time from mid-morning through to late afternoon as they can in early morning. Instead there is substantial shape distortion, apparent motion and edge blurring.
In Figure 1, the shape distortion and edge blur effects are evident for a vehicle at 500m. This image was taken in mid-day, 41°C, in the Kimberley region of northern Australia. The level of distortion increases with range. At 2km the vehicle appears as a quivering white ball, with sometimes the shape breaking up. A scientific study of the phenomena requires the development of the relationship between the image resolution, the atmosphere, and the local hot environment. The basic relationships are outlined in the following sections.
Fluctuations in the refractive index
The image degradation in an active atmosphere follows from fluctuations (dn/dT) of the refractive index, n, with temperature, T. The atmospheric structural effects are described in terms of the refraction structural parameter, Cn2. The basic equation [1] is:
(1)
where Q is the upward heat flux from the sun-heated surface, h(x) is the height above the surface and u is the characteristic frictional velocity of the surface. This equation describes the fluctuations in Cn2 at each point of the line-of-sight {x} from the target (position xo) to the observer at a distance xo + R away. Large values of Cn2 are predicted by Equation (1) for observation near the ground (small h), and large values of Q (very hot sunny days in near-equatorial regions).
The value for the effective Cn2 through an active medium is given by the expression [2]:
(2)
It is important to note that the factor ((x-xo)/R)5/3 strongly weights the contribution of the line-of-sight close to the camera. Simplifying Equation (1) by Cn2(x)=Cn20 h(x)-4/3 gives:
(3)
Image distortion
The spatial resolution of the imaging device is described by the modulation transfer function (MTF). The MTF is expressed as an explicit function of spatial frequency ν. It also implicitly depends on a range of other parameters, including range R. The MTF has values between zero and one. High values of ν correspond to fine spatial detail and the MTF describes the ability of the system to reproduce detailed features and the sharpness of edges. The concept is illustrated in Figure 3.
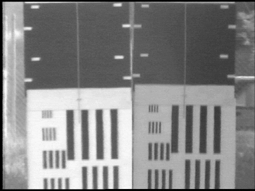
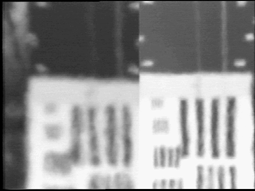
Figure 3 shows two images of a bar chart, one on the left and the other on the right, taken simultaneously by two similar cameras and telescopes from 500m. The white background is a metre square and this square therefore subtends an angle of 2mrad from the camera. The patterns show bar cycles, which corresponds to a certain number of black and white cycles per milli-radian, otherwise known as spatial frequency. A clear reproduction of the pattern corresponds to an MTF near unity, a uniform grey corresponds to no pattern reproduction and an MTF near zero, while a blurred pattern corresponds to an intermediate value for the MTF. An accurate estimate of the MTF is obtained by a Fourier transform of the black and white edge.
Our interest is directed towards the range of spatial frequencies where the MTF attenuates quickly from turbulence. The component of the MTF due to atmospheric turbulence, MTFA, is given by [2]:
(4a)
(4b)
where the parameters νo, νt and νk are given by the following expressions:
(5a)
(5b)
(5c)
where λ is the light wavelength and is the inner scale of turbulence and has values the order of 2mm to 12mm. We can see from the exponential form that the MTF is near unity for small νand tends to zero for large ν.The parameters νo and νt provide the cut-offs. Equation (4a) applies to severe turbulence and is used for this case. The cut-off νo is small for large values of Cn2 and range R.
Our aim is to determine techniques that increase the cut-off νo, to a higher value. This corresponds to higher resolution, and therefore reproduction of finer detail and sharper edges. Two significant techniques have been predicted and verified. The process of verification uses the two cameras being laterally separated, with one moved to the new position and the level of improvement measured. The range is unchanged. The new positions correspond to lines-of-sight producing smaller values of Cn2 as defined by Equation (2). The sensitivity of Cn2 to the line-of-sight near the camera is important.
Increasing the height of the point of observation
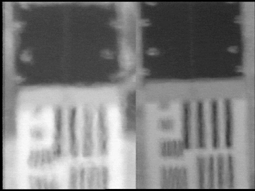
The images shown in Figure 3 were taken in the early morning of a very hot day (maximum of 41°C) with two cameras. Each is an assembly of a “one third inch format” CCD camera and a “one metre focal length” telescopic reflecting lens. The cameras are located side by side and 1.25m above the ground of a flat region. During the morning, solar heating of the ground induced an active atmosphere and severe turbulence, leading to substantial image degradation. Significant improvement was obtained by increasing the height of the point of observation. The slant angle expression for h(x) reduces the value of the integral in Equation (3) and therefore Cn2. The cut-off νo increases and improved resolution results. This was verified for a range of heights. An example is shown in Figure 4 for the right-hand camera at 8m with the left-hand camera still and 1.25m. Less blurring of edges and more regular shapes are seen within the images from the higher mounted camera.
Siting the camera in shaded regions
Significant improvement can also be obtained by moving the camera into shaded regions. This is predicted by Equation (2) where, due to much smaller values of Q, Cn2(x) likewise becomes much smaller for the line-of-sight above shaded ground. This removes the important weighted contribution near the camera. This is verified by field work were the image in Figure 5 consists of cameras at 1.25m height. The left hand camera views across a completely sunlit line-of-sight and the right hand camera looking through 40m of broken shadows due to tree cover. The right hand image contains improved pattern structure and sharper edges.
Figures 4 and 5 illustrate the level of improvement that may be achieved through optimal selection of the points of surveillance for a wide range of surveillance devices, including binoculars and cameras. Further increases in image resolution can be achieved for surveillance cameras through image reconstruction methods [3,4]. The technique is based on obtaining a sequence of video frames of the same scene and using special algorithms to correct for shape distortion and edge blur.
Thermal detection during hot days
In tropical forested areas the daytime sun provides strong illumination of the forest canopy and partially open ground. However the shaded portions are relatively poorly illuminated and are often partially obscured by one or more layers of overhead foliage. People, for comfort as well as low observability, often prefer the shadows for themselves and their equipment. Target detection within broad scenes, at medium to long ranges, is generally very difficult. Visible cameras, such as colour and panchromatic TV, produce imagery dominated by sunlit foliage and ground. However these cameras can provide target classification, through high resolution and very narrow field of view optics, once the target has been located. In this case, the camera effectively zooms in to the specific location, with the brightness adjusted for local light level. The main problem is therefore the initial acquisition of the location within the broad scene through an effective target detection sensor.
Thermal cameras also suffer from the effects of sunlight. In daytime the temperature will vary from 30-35°C for objects in the shade to more than 70°C for sunlit soil and rock. Partially shaded objects have a temperature in between. This range spans body temperate as well as that associated with a recently driven vehicle. This situation is shown in Figure 2. A vehicle within the woodland, cannot be detected within this thermal clutter. Thermal imaging, as a means of detecting and classifying small targets in clutter, is often limited to night-time use. However the current work has produced a technique that highlights the signatures of objects within the shadows during daytime.
The method uses the information from two infrared bands to produce a new image where the sunlit effects are suppressed. A mid-wave infrared (MWIR) imager, operating in the 3-5µm band, produces imagery with brightness according to the scene temperature. While some contributions from reflected sunlight and changes in material emissivity are present, the general landscape image mostly represents temperature. An example of MWIR imagery is shown in Figure 6(a). An example of short-wave infrared (SWIR) imagery of the same scenes is shown in Figure 6(c). The SWIR imager, operating in the 0.9-1.7µm band, produces imagery according to the scattered sunlight. Sunlit objects are bright and shaded objects are dark.
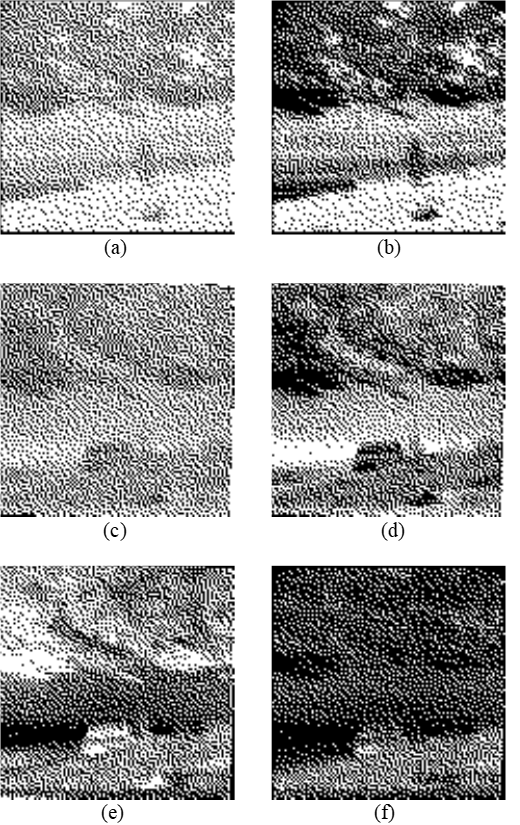
The basic method uses these two raw images as the input. The first stage transforms the image grey scale to cover the full range (from white to black). By undertaking this, Figure 6(a) is transformed to 6(b) and likewise 6(c) is transformed to 6(d). Image 6(d) is inverted to produce 6(e), which is effectively a “negative”. Sunlit objects in 6(e) are now dark (effectively suppressed) and shaded objects are bright (effectively enhanced). Image 6(e) acts as a filter to suppress the sunlit regions and enhance the shaded regions.
Figure 6. Images of a vehicle from 400m. Figures (a) and (b) are the raw and adjusted-grey-scale MWIR images. Figures (c) and (d) are the raw and adjusted-grey-scale SWIR images. Figure (e) is the inversion of (d). The final image, (f), is the multiplication (b) and (e).
Multiplying the pixel intensities of image 6(e) by those of the thermal image 6(b) produced the final image 6(f). The brightest part of image 6(f) is the rear of the vehicle, which includes the portion adjacent to the exhaust, and the tyre (heated by friction). Note that the front of the vehicle is obscured by a small tree and raised ground. The sunlit regions are now relatively darker.
A variation of the method (method II) is to take the difference between image (b) and (d) and use it as the filter image. Sunlit features and shaded features that are common to both SWIR and MWIR bands are suppressed in the filter. Thermal features present in the MWIR image and not bright in the SWIR image are the bright segments in the filter. Multiplying the filter by the MWIR image produces an image enhancing the thermal signatures of objects in the shadows. Method II has been applied to a range of images of unobscured and obscured vehicles and people within a cluttered mixture of sun and shade. In Figure 7(a) an unobscured vehicle can be seen within the shadows of nearby trees in the raw thermal image. However the filtered image, displayed in Figure 7(b), shows the vehicle thermal signature to be the dominant feature. This vehicle, due to its siting in shadows, had low observability in the visible EO band.
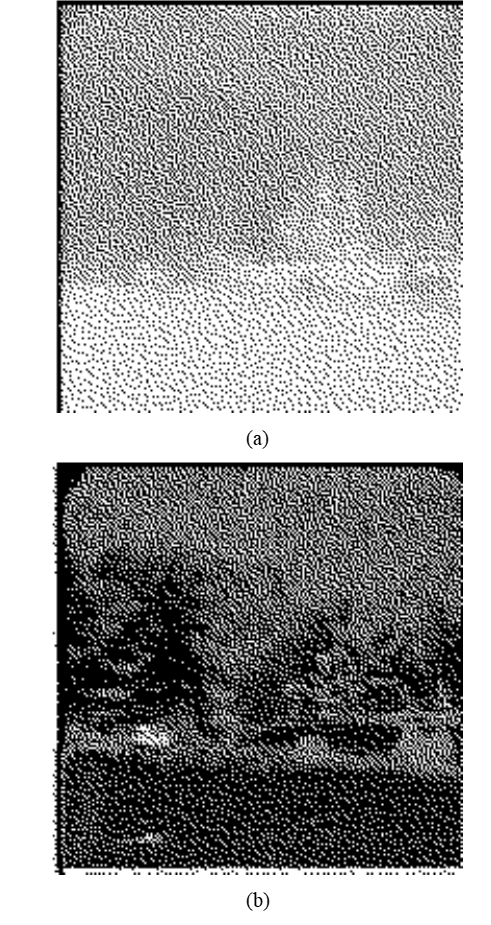
The brightness of the sunlit woodland and open areas within Figure 7(a) has been suppressed by the filtering process. The process has been applied to scenes where the target is embedded within clutter as in the case of Figure 2. The resulting filtered image is shown in Figure 8. Thermal emissions from the shaded vehicle penetrate through gaps within the obscuring foliage to provide target detection. Confirmation and classification would follow the process of the thermal detection cuing a high-resolution colour CCD camera (having a relatively larger focal length telescope) to that particular spot. For example, a thermal camera could have a field of view of 2°, and the colour CCD camera could have a field of view of 0.2°, which implies x10 magnification.
The method has been derived and tested on a system assembled from two separate but closely mounted cameras. A considerably more effective system would use a single “two chip” camera, with one SWIR chip and another MWIR chip, analogous to the three chip (red, green, blue)colour CCD cameras. More precise image registration and signal processing would ensure higher precision and substantially better imagery. An intermediate approach would be the use of a single telescope and a beam splitter.
The process outlined above is one example of an increasing trend in sensor fusion, which will see advances in sensor, signal and image processing technologies, and the development of a wide range of new surveillance systems. Integrated electro-optic sensors [5,6] across the EO spectrum form just one part of the development, aimed at developing new day and night sensors.
Conclusions
New technologies and techniques have been developed to overcome some of the problems currently limiting surveillance in difficult hot tropical environments. More substantial improvements, both in terms of wider applications and increased image resolution, will follow from new initiatives in detector design, sensor fusion, and image processing algorithms.
References
[1] J.Wyngaard, Y.Izumi, and S. Collins, ‘Behavior of the Refractive-Index-Structure Parameter near the Ground’, Journal of the Optical Society of America, Vol. 61, p. 1646, 1971.
[2] M. Belen’kii, ‘Effect of the Inner Scale of Turbulence on the Atmospheric Modulation Transfer Function’, Journal of the Optical Society of America A, Vol. 13, p. 1078, 1997.
[3] M. Alam, J. Bognar, R. Hardie, and B. Yasuda, ‘High Resolution Infrared Image Construction Using Multiple, Randomly Shifted, Low Resolution, Aliased Frames’, Proceedings of the SPIE, Vol. 3063, p. 102, 1997.
[4] G. Thorpe, A. Lambert, and D. Fraser, ‘Atmospheric Turbulence Visualisation Through Image Time Sequence Registration’, Proceedings 14th International Conference on Pattern Recognition, IEEE Computer Society, Vol. 2, p. 1769, 1998.
[5] ‘Pushing the Boundaries’, Infrared Imaging News, (Maxtech International) Vol. 4, p. 1, Apr 1998.
[6] W. Clodius, P. Weber, C. Borel, and B. Smith, ‘Multi-spectral Band Selection for Satellite-based Systems’, Proceedings of the SPIE, Vol. 3377, p. 11, 1998.