
Volume 1, Number 3, November 1998
Development of Antenna Training Aids Using Electromagnetic Visualisation and Other Techniques
Abstract
This paper discusses the evolution of antenna training aids under development at the Australian Army’s Army Technology and Engineering Agency (ATEA) for the Australian Army School of Signals, and HMAS Cerberus Frequency Management School. The training aids rely heavily on the ability to produce high-quality rendered images of antenna radiation patterns using electromagnetic visualisation techniques developed at ATEA. Adjustment of parameters such as frequency, antenna height, slope, configuration, ground type and viewing angle controls the selection and display of the appropriate antenna pattern image. Interactive operation coupled with the high quality images results in an aid that provides excellent insight into the intricacies of antenna radiation patterns. Current extensions to this capability include traditional graph-based display of pattern data, and of antenna footprint maps using a simple ionospheric predictor.
Background
Reliable communications depend on effective use of equipment and exploitation of the communications medium. Communication in the high frequency (HF) band (2MHz to 30MHz) particularly requires attention to matters often considered as part of ‘the black arts’. Both the radio equipment and their antennas are generally required to operate over a wider range of frequencies (15:1) than for operation in other bands. Frequencies are often changed several times per day chasing that elusive optimum working frequency dictated by ionospheric conditions.
For some antennas, particularly wide band antennas, the radiation pattern shape can vary widely with frequency, and other parameters. While the radio equipment - the transmitter and receiver - may function well over the required band, and even match the antenna system, unless due attention is paid to the choice of antenna, its configuration, siting and orientation, the shape of the radiation pattern may make communications difficult if not impossible. The use of low transmitter power to conserve battery life or for covert operation compounds the problem.
Proper antenna training will promote better understanding and exploitation of antenna radiation patterns, leading to improved communications availability and reliability. High performance personal computers, with high-capacity hard and compact disk drives are becoming more readily available and can provide a useful platform for which visual antenna training aids can be developed.
Initial work at ATEA
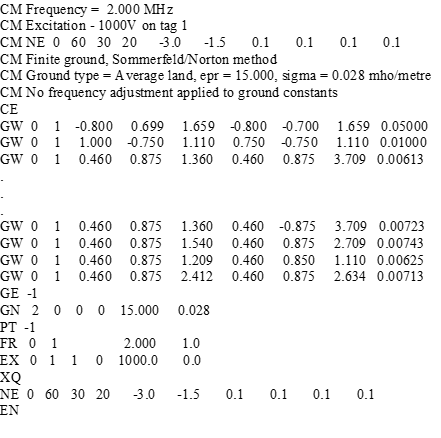
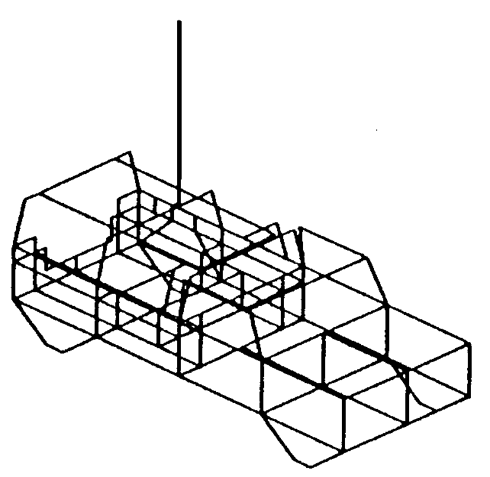
In 1991, ATEA obtained Version 2 of the Lawrence Livermore Laboratory’s Numerical Electromagnetic Code (NEC) for near field assessment. The code was taken from the NEEDS 2.0 package, and although some graphical input and output routines were available, in general they required specialised hardware. Interfaces to AutoCAD Version 10 were quickly written in AutoLISP, a programming language embedded in AutoCAD [1] to allow for three-dimensional graphical examination and creation of NEC input files (see Figures 1 and 2).
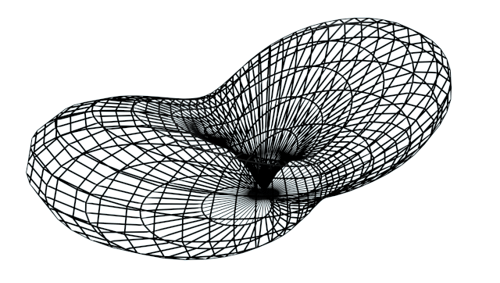
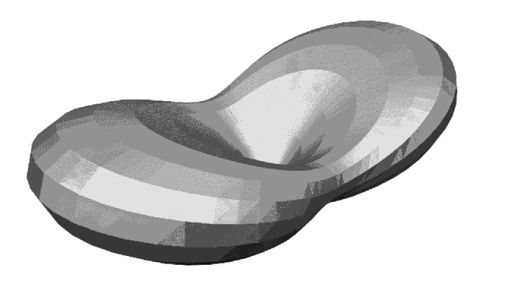
The interfaces were extended to plot contours and colour maps of near field data and to present far-field radiation pattern data as three-dimensional meshes (Figure 3). Using the SlideShow capability of AutoCAD, screen-dumps were saved as .SLD files, and by linking these images together with a script file, animations of field patterns were created. Although these ran fairly slowly, they showed considerable promise as a means of understanding pattern characteristics. An upgrade to AutoCAD Version 12 allowed rendered images to be created (Figure 4). The images were more ‘realistic’, and despite the minimal edge treatment of faces further demonstrated the potential of these techniques.
Based on these successes, the rendering and animation package 3D Studio Version 2 was obtained. In addition to its stand-alone capabilities, it could create ‘photographic’ quality images from the 3D radiation pattern surfaces generated in AutoCAD. Suites of radiation pattern gain surfaces were created in AutoCAD from a series of NEC runs, using a range of antenna variables as the independent parameter. This three dimensional data was written out as .DXF files (Drawing eXchange Format), loaded into 3D Studio and saved as .3DS files, the native file format of 3D Studio. Morphing between radiation pattern surfaces provided a means to create pattern animations. As the independent parameter was changed, 3D Studio provided smooth interpolation between pattern shapes [2].
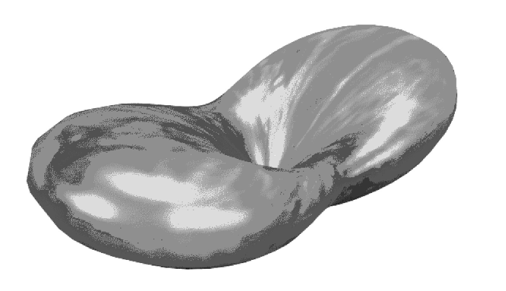
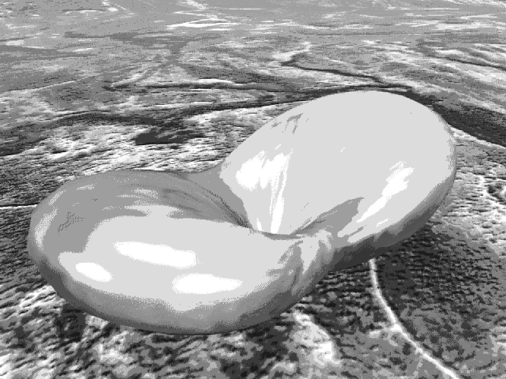
Using the inherent capabilities of 3D Studio, animated frequency and other scales, backgrounds and other objects can be created to annotate the images. Careful attention to lighting, shadowing, camera positioning, the use of fog to suggest distance, choice of appropriate images, colour and textures for backgrounds, and for the representation of the earth and of the antenna pattern itself, can all provide subtle clues which greatly enhance the perception and comprehension of the pattern (see Figures 5 and 6). Creation of good images is not a process to be taken lightly, but requires considerable practice to develop and maintain the appropriate skills.
During the creation of an animation file, a series of keys (commands to move, rotate, morph, and so on) is assigned to each of the objects to be animated. In 3D Studio Version 2, these were created by hand. In one instance over 11,000 keys were created to produce an animation of a HF radiation pattern sweeping from 2MHz to 30MHz, and viewed from 64 different viewpoints - a multi-dimensional set of radiation pattern images. Creation of the keys alone took just over three weeks but yielded an excellent result that could be saved as easily as an animation file, a videotape or a series of still images.
A variety of still image formats is available in 3D Studio, including Tagged Image Format (.TIF), Windows BitMap (.BMP), Graphics Interchange Format (.GIF) and Joint Photographic Experts Group or JPEG (.JPG). To determine the best file format for the application, several runs were made using these formats for a wide range of antenna images. With suitable compression selected, and providing there were no sharp edges in the image (text etc) the JPEG (Joint Photographic Experts Group) .JPG format easily gave the smallest file size for acceptable image quality. Using an image format of 640 x 480 pixels with 256 colours the average file size per image was about 13kByte, allowing some 50,000 images to be stored on a single compact disk (CD). The corresponding average file size for .GIF format was 120kByte, reducing the CD capacity to about 5,500 images.
Neither the animation file, the still images or videotape has a viable capability of interactively selecting the image of interest as a function of the parameters of interest (say) frequency and viewpoint. To do that an interactive viewer was needed that would display the appropriate still image in response to user selection of parameters. At that time the School of Signals was using the DOS 6.2 environment, and a viewer was developed for that system. This raised a number of interesting challenges during development including writing special colour palette handling and mouse driver procedures, as well as writing a JPEG viewer [3]. A demonstration disk for the RAVEN Bidirectional Delta antenna was produced for evaluation by the School of Signals. In anticipation of migration to a Windows environment, work commenced on a Windows viewer.
Considerable effort has recently been spent on reducing the amount of manual effort needed to produce the large number of images needed for the training aids. A single purpose-written program is the starting point of the current process. This program creates a directory structure based on the parameters that are to be adjustable in the final training aid. Typically, these would include ground type and a variety of antenna configurations. The program also writes an index file containing information on generic file names and directory paths and is used to control later processing. At the same time an antenna-specific viewer is written.
The program then writes input files for the NEC modelling program into the appropriate directories, together with a batch file. One input file is used for each frequency, and the batch file calls the NEC processing for each input file within each directory. Finally, a master batch file is written in the root directory to call the individual batch files and run the whole modelling process. The production of a typical training aid requires the creation and running of anything up to 5,000 separate NEC input files. Once the creation program is written, the processes of directory and file creation typically take less than ten minutes. For simple wire antennas (typically up to about twenty wires), the 5,000 modelling runs take about three hours using a 200MHz Pentium CPU. More complex structures such as antennas on vehicles take correspondingly longer times.
Once all the modelling runs are completed a number of processes are run. These use the index file for navigation, reading the NEC output files to create:
- 3D .DXF files of pattern shapes for input to 3D Studio;
- antenna pattern files with data in a tabular form for use in other applications;
- summary data from NEC output files used to verify modelling integrity;
- files containing maximum envelopes of sets of radiation pattern data used to set camera positions;
- .VUE files, which control object positioning and rendering within 3D Studio; and
- batch files to run the rendering process using .VUE files.
To prepare the files to be rendered in 3D Studio, the .DXF files are loaded into 3D Studio and merged with a previously created file containing common elements such as earth, sky, a dummy radiation pattern, lights and a camera. Once this is done, the rendering can be started using the rendering batch file that calls 3D Studio and passes control to the appropriate .VUE file. The current viewers have been designed for 640x480 screen resolution. To make room for the various controls, the rendered image size has been reduced to 430x330 pixels. This also results in faster processing and slightly smaller file size. The typical rendering time is 23 seconds per image - 50,000 images taking some thirteen days to produce.
The creation of training aids using rendered images of radiation patterns relies heavily on the ability to rapidly create and process large numbers of antenna models. Computer generation of modelling input files, and batch mode processing is essential. Manual performance of these actions is not a viable alternative because of the excessive time that would be needed. NEC has well-documented input and output file formats, can readily be run in batch mode and is thus well suited to this application.
Related work
Concurrent with the development of the image creation process, a propagation analysis code was being written to display maps of antenna footprints over the horizon. Modelling of a number of in-service antennas indicated that to capture the structure of patterns, particularly for those antennas that were large or at significant heights above the ground, a minimum resolution of 5º in azimuth and elevation was required. This is the same resolution as used in the process for the generation of the radiation pattern image. For the upper hemisphere, this requires 1,368 points per frequency. In many cases, for adequate frequency resolution across the HF band, 1MHz steps have been found necessary, yielding files of about 160kByte. In order to economically embed this amount of data in the code, a data compression method was developed [4]. Although the compression is lossy, the errors introduced during compression and decompression are restricted to the low gain areas (nulls) of the radiation pattern where they are of little importance to the application. Using the ATEA developed algorithms, the original 160kByte file compresses to a little over 15kByte, while the decompression process intrinsically provides interpolation between the original points. The compressed antenna file format has been extended to include records for textual description of the antenna and geometric antenna data for display of a 3D Wire drawing of the antenna structure. This increases the file size to about 17kByte.
As well as the footprint display, the antenna pattern data stored in this compressed format can be used to display conventional graphs of antenna pattern data such as horizontal and vertical cuts. A demonstration training aid based on this method was also developed for evaluation at the School of Signals, HMAS Cerberus, and elsewhere.
Current work
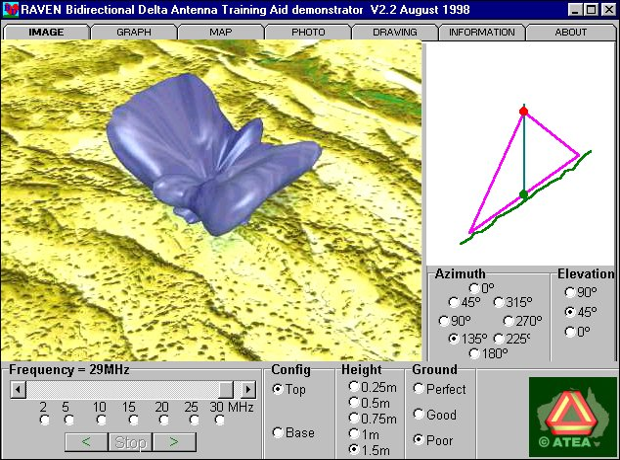
Although the above methods of antenna pattern display were developed independently, work is proceeding on the creation of a single training aid, which embraces all three capabilities together with other antenna information on separate tabbed notebook screens. The three capabilities are:
- Rendered images. These give an easily understood overall impression of the shape of the pattern. The ability to view the pattern from different viewpoints, and to observe the effects of changes of frequency, ground type and antenna configuration provide an environment where the pattern can be readily conceptualised.
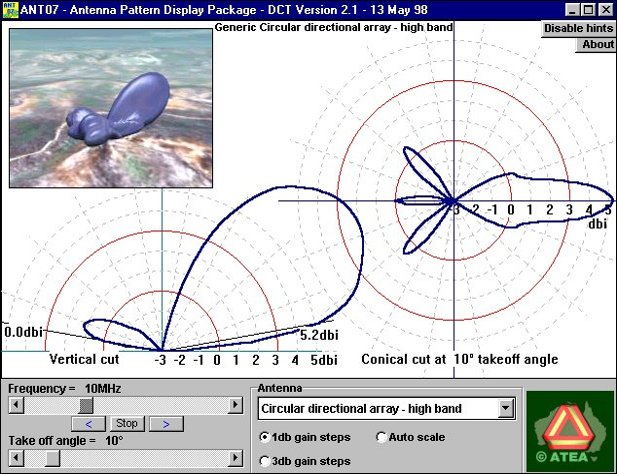
- Graphical display. This displays the pattern data using traditional methods and provides numerical data. A vertical and a conical cut at a user-selected takeoff angle are displayed.
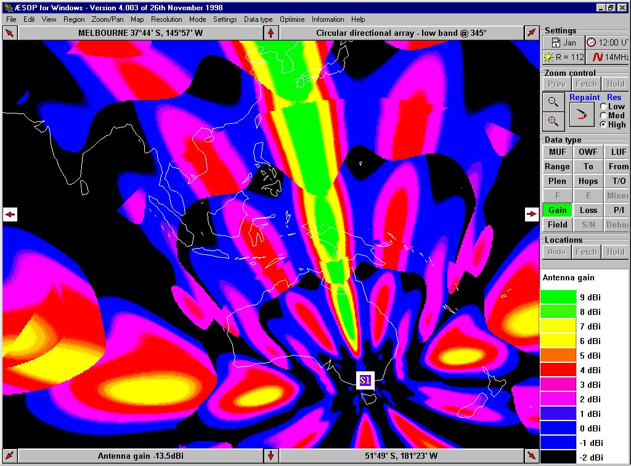
- Map display. This shows the effects of the interaction between the antenna pattern and user-selected ionospheric conditions, and displays the area coverage of the antenna and other communications data.
Figures 7 to 9 show screens taken from the three separate antenna pattern display capabilities.
Documentation
ATEA quality procedures require that software-based products for use outside the Agency be documented in accordance with MIL-STD-498. For the training aid, this documentation currently comprises the Software Development Plan (SDP), Software Design Description (SDD), Software Product Specification (SPS), System/Subsystem Specification (SSS), Test Plan (STP), Software Test Report (STR), and the Software User Manual (SUM), together with a 100-page work instruction on the image creation process and related issues. These documents have been compiled during the development of both the DOS and Windows versions of the training aid for the RAVEN Bidirectional Delta antenna. However as the functionality of the training aids is different for different antennas, these documents will require updating and extension as additional training aids are produced.
Antenna data
In order for the above training aids and related applications to include further antennas, accurate geometric data on in use is required to create the electromagnetic models from which the gain patterns are computed. In the case of fixed installations, this is generally not a great problem, as the antenna geometry and that of the surroundings is fixed. However, in the case of field antennas that are often expedient, obtaining adequate data on such antennas and their range of variants presents considerable difficulty. While antenna handbooks give broad-brush descriptions of antenna dimensions, in practice these are often not adhered to. Wisely applied, changing element slopes or adding a reflector or counterpoise can improve communications performance. In such a case the 'antenna intuition' which the training aids can develop can be of considerable benefit. But in order to provide the maximum usefulness, geometric data on the full range of antennas and variants needs to be captured so that it can be modelled and embedded in the applications. Previous experience suggests that attending Signals unit exercises with a steel tape, a theodolite and a camera might be the only way to obtain this urgently needed data.
Conclusions
This paper has presented aspects of the development of a series of antenna training aids for the Australian Army's School of Signals and HMAS Cerberus Frequency Management School. Strategies have been discussed for the efficient production of high-quality antenna radiation pattern images and of the compression of antenna pattern data based on antenna modelling using NEC. These techniques produce self-contained antenna training aids that are easy to operate and provide excellent insight into the complexities of antenna radiation patterns. To extend the usefulness of the applications, antenna data covering the full range of antennas, particularly expedient antennas, needs to be captured so that antenna the antennas can be modelled. The training aids find application not only in the classroom, but with the increasing availability of field computing, in the provision of guidance on antenna choice, configuration and siting in the field. This will lead to an improvement in communications availability and the development of an 'antenna intuition' at a level previously obtained after may years of field experience.
AutoCAD, AutoLISP, 3D Studio are registered trademarks of AutoDesk Inc.
References
[1] A. Nott, “AutoNEC - A Marriage of Convenience”, Proceedings of the 10th ACES Review of Progress, Monterey, CA, USA, Vol.II, p.380, Mar 21-26, 1994.
[2] A. Nott, “Electromagnetic Visualisation using Commercial Software”, Proceedings of the 12th ACES Review of Progress, Monterey, CA, USA, Vol.I, p.326, Mar 18-22, 1996.
[3] A. Nott and D. Singh, “An Antenna Training Aid using Electromagnetic Visualisation”, Proceedings of the 13th ACES Review of Progress, Monterey, CA, USA, Vol.I, p.41, Mar 17-21, 1997.
[4] A. Nott, “A Data Compression Technique for Antenna Pattern Storage and Retrieval”, Proceedings of the 13th ACES Review of Progress, Monterey, CA, USA, Vol.I, p.56, Mar 17-21, 1997.