
Volume 1, Number 3, November 1998
Architectonics - The Study of (Defence & CIS) Systems Architecture
Abstract
The science of architectonics, the study of architectures, appears to be “missing”. Relatively little attention is paid to overall systems architectures. The paper presents means and methods for identifying and transferring knowledge between different architectural domains, from hill-forts, medieval castles and animal architectures, to SDI and industrial organisation, so as to understand and enhance performance, survivability, effectiveness and efficiency. Isomorphisms and archetypes relating many different kinds of architectures are presented, with examples of architecture evolution using simple genetic algorithms. The paper illustrates some of the simple mathematics of architecture, identifies some invariants, presents hard examples of real benefits to CIS from architectonics, and recommends the adoption of architectonics as highly beneficial to the CIS community, not least in the development of auto-adaptive architectures.
About architecture
The meaning of architecture
Architecture: “the art and science of building; structure; style of building; structures or buildings collectively; overall design of software and especially hardware of a computer or local network; organisation; framework (Greek: architekton, master builder).” Or so says Chambers Dictionary.
The term architectonics has been coined to identify what appears to be a “Missing Science of Architecture”. Within architectonics, it is proposed to widen the definition to encompass architectures/organisational groupings and interconnections
This paper sets out to characterise architectonics, and to ask some pertinent questions:
- can we transfer knowledge and understanding gained from one domain of architecture to another?
- what is it, what can we learn, how can we benefit?
- is there a mathematics of architecture?
- are there fundamental principles of architecture?
- can we measure the “goodness” of architectures?
- are there architectural invariants?
Figure 1 shows the goal of architectonics - to understand how to create robust architectures appropriate to particular problems. This might seem a modest goal, but it is not widely addressed, perhaps because it is a total system issue, and we often seem to find such large, seemingly-amorphous concepts uncomfortable. As the figure shows, there are many precedents from which we can learn, and this paper will address only a few of them.
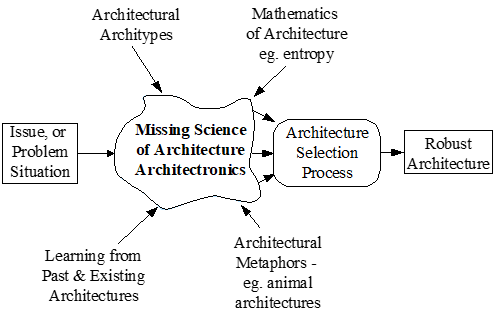
The issue facing architectonics seems straightforward enough, and can be boiled down to challenges such as: given an open set of sinks, and an open set of sources, what is the best way to interconnect them to achieve purpose robustly, securely, effectively and efficiently?
Examples of architectural issues exist in almost any system of even modest complexity. For instance, in communications satellites the smart switching, compression and security protocols might be located either
in the geostationary space vehicles, or in the ground segments. Performance might favour locating these features in the space segment, while factors such as maintainability and network management might favour them in the ground segment. Which is better? How do you judge?
Similarly, overall communications and information systems (CIS) performance is related to the routing by which information travels from source to sink, and may be considerably affected by delays along those routes. Such delays can cause decisions to be taken on outdated data, resulting in grossly inadequate military and logistic performance, even instability.
CIS performance is also affected by what information is made available to various decision-makers. It is entirely possible for decision-makers to make decisions, which are rational on the basis of the restricted information to which they are privy, yet for those decisions to be counter-productive overall.
Looking at an overall architecture, we see many instantaneous sources and sinks, with routes crossing and re-crossing. Is there an optimum set of routes and resources? What would be optimised, and under what conditions?
Systems architecture, then, concerns (or should concern) itself with connectivity, clusters, layers, delays, information loci, and many more. Present CIS practice tends towards letting CIS architectures just “happen” according to the dictates of individual projects, each of which seeks to optimise for its own ends. Convenient though this may be, it cannot, and does not, provide for the most efficient and effective overall performance.
Is architecture, then, something that “just growed, like Topsy…”, or is architecture a fundamental system foundation, determining Performance, Availability, Survivability?
Animal architectures
Biologists study animal architectures (see Figure 2) looking particularly at the changes that arise in animals of different sizes [1]. Very small animals have relatively few logistic problems; oxygen and food can be absorbed through cell membranes, waste materials can be expelled in the opposite direction. With increasing size, the essential issue of waste disposal requires increasing sophistication. Gases and materials have to be circulated from inside to outside.
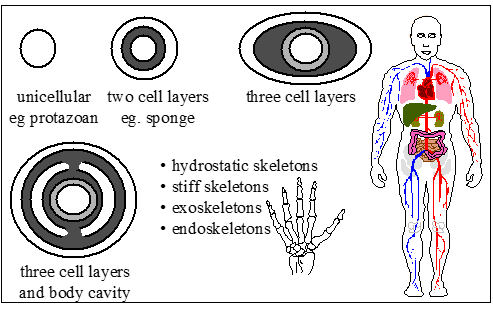
This problem of waste disposal, vitally important to animals, is equally important in other architectural domains. Medieval castles (q.v.), for instance, frequently fell to siege due to an inability to dispose of waste leading to rampant disease. Coming up to date, intelligent blackboard systems, and indeed processing architectures in general, have continuing “garbage collection” and “waste disposal” issues.
Structure does not scale either. For land animals, there are size- and weight-limits on exoskeletons. Endo-skeletons, such as that of most of the human body, become necessary to provide flexibility with acceptable weight.
The human skeleton, typical of endoskeletons, exhibits architectural features, which can be transferred to parallel architectural domains:
bilateral symmetry;
the brain is protected within a hardened (locally exoskeletal) skull;
the central nervous system is encased in, and protected by, the jointed spinal column;
the vital organs are either buried deep within the body, or protected by the spine and rib cage, or both;
high pressure arteries are buried deeper than lower pressure veins; and
nerves, arteries and veins generally cluster around the skeletal limbs.
Evidently much of the endoskeletal “design” supports organic survival as well as performance.
Subtle architecture “constants”
Man has used symmetry and proportion for millennia to characterise sound architecture. The ancient Egyptians constructed enormous buildings including, but far from limited to, the Pyramids, without any sophisticated mathematics.
Ancient Greeks identified the Golden Section, which divides a line into “ideal” proportions - see Figure 3. This ratio appears both in Nature and architecture. The Parthenon uses the Golden Section in its ground plan.
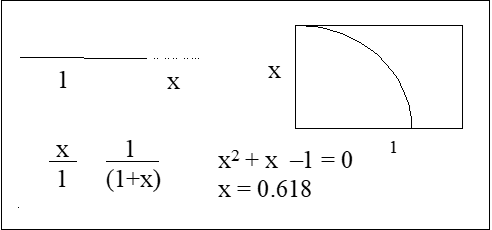
Why should this ratio occur so widely? Perhaps it is something fundamental. Nature generates the ratio in the numbers of bumps on a pineapple, the pattern of seeds in a sunflower, and many more. Renaissance painters rediscovered the ratio and incorporated it into many paintings. It also appears in the Fibonacci Series.
For the nth element from the Fibonacci Series, 0, 1, 1, 2, 3, 5, 8, 13, 21, 34 ...
Golden Section = n/(n + 1) for n > 8 (1)
For example, 21/34 = 0.618.
The reason for this ubiquity is unclear. Before dismissing it, however, one should note that the human cortex discovered pleasing musical tones, chords, and cadences long before the underlying mathematical relationships were formulated. It would seem that the cortex’s continual search to reduce perceived entropy can be a powerful driver towards sound architectural features. Perhaps an architecture that looks right has a chance of being right…and the definition of architecture at the beginning did include “art”.
The essence of architecture - 1
There are many views of architecture. A second set of views will be presented later. First, we may consider the essence of architecture to be concerned with pursuing some purpose:
- worship, funerary rites (for example, temples, numinous cathedrals);
- parliamentary debate;
- terminating railway journeys or carrying vehicles; and
- telecommunications, layered protocols, transport networks, manufacturing plants, defences, refineries.
Distilling the essence from such architectures helps to explain other kinds of architectures, such as:
- co-ordination of co-operating forces, information systems; and
- organisations, socio-economic systems, adaptive/self-healing systems, etc.
Architecture is central to the performance, availability and survival of systems yet, for many designers of so-called high technology equipment and services, it seems barely to be considered a topic of interest or concern. It is not unknown for marketing staff selling complex systems to map out a block diagram with a customer literally on the back of an envelope, creating an “instant” architecture, determined by customer and therefore inviolate.
As this paper illustrates, the proper analysis of architecture promises to be both more demanding and more rewarding.
Architecture is the skeleton of the body. It gives form; it provides locations for parts and functions of the body. It protects, it connects, it hides, it reveals, it stores, it employs, it renews. Architecture reduces entropy, the degree of disorder in things and in the perception of things.
The purpose behind architecture is to enable the many purposes of the body and of the mind. True for the body, these ideas are fundamental to all kinds of architectures - physical structures, intellectual constructs, satellite communications, Desert Storm force structure, and so on.
Architecture, then, is an expression of purpose in man-made systems, the structural framework giving form and substance to a system. But architecture is more - by its very form it expresses viewpoints, contains information, affords adaptability to new purpose, and marks territory.
Figure 4 resulted from stakeholder analysis amongst middle-ranking military users of technological architectures.
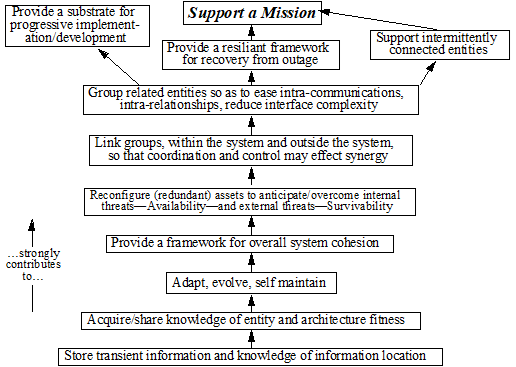
Architectures, as has been said of aircraft carriers, bureaucracies and banks, exist to defend themselves. Defence requires knowledge of strengths, weaknesses, breaches in the structure, and their locations, etc.
In ancient castles, data was carried by messengers or observed from vantage points. In some modern systems (for example, the Internet and the full implementation of ISDN) the architecture stores knowledge about itself electronically. Knowledge of its own condition enables the architecture to maintain and adapt itself.
In castles, men undertook repairs. Today’s advanced architectures are still maintained by technicians and adapted by designers, although self-healing systems and architectures are becoming visible on our horizon.
Architectures provide a framework for overall system cohesion. The parts of a building, and the functions of various rooms, are integrated into one whole through civil engineering architecture. As the chapels in a cathedral all contribute to worship and reverence, so the modules in a computer program all contribute to its overall performance through their architectural relationships. So too the organs of a body interact with each other and, in so doing, contribute to the whole body’s capabilities.
Architecture provides the basis for reconfiguration, the ability to rearrange. As rooms may be converted to increase storage capacity, to house more resources, so extra modules may be added to a radar system to keep it working when parts fail.
Such extra parts may not be in use all the time, but are switched in when necessary, with the faulty part being switched out: this rearrangement is referred to as reconfiguration. The ability to reconfigure is important not only to deal with failures but also to accommodate, or tolerate, damage, and is an important feature of architecture.
As the biological skeleton creates protected routes for nerves and blood vessels, so architecture provides communications and linkages for the various parts within the system to interact. Through this interaction, the parts can co-ordinate, control can be exercised, and synergy develops. Interaction is facilitated if parts that have to mutually interact are collocated, forming groupings of parts, or clusters. Architecture can be formed around such clusters, or the clustering can be enabled by architecture, according to viewpoint.
Architecture provides structural support for resilience, the ability to recover from breaches or “outages” as temporary failures are sometimes called. It also may provide facilities for some parts to be temporarily connected or disconnected for a variety of reasons. In mobile information systems, architecture may support temporary isolation due to lack of radio connection. Living architecture is adaptable to new purpose, and so it should also provide the capability for change, for development as part of its intrinsic structure.
Kinds of architecture
Architecture appears in many forms, with decoration sometimes concealing much underlying structure. Both the decoration and the structure have purpose, the first to impress or otherwise influence the observer, the second to support activity or process. Following topics are concerned principally with structure.
Structure offers two main archetypes:
- Layered architectures, enabling or resisting passage through a structure comprised of successive layers, perhaps undergoing transformations, and finally exiting. This is the basis of process oriented architectures used in manufacturing; communications; defence and security; social beehives; trees and plants; the Sun; alimentary canal; and so on.
- Clustered architectures, where architectural components form into groups, perhaps with a view to reducing energy of, or time taken for, interaction between the components. This is the basis for architectures used in human organization; circuit board and microcircuit design; some evolved biological designs (such as animal body plans); topics in textbooks; parts stored a warehouses; ethnic restaurants; books in a library; and so on.
In many systems, layers form as a result of clustering.
Multi-layer and clustered architectures
In the progressive advancement in defensive organizations, social evolution favoured multi-layer defence. As Figure 5 shows, defences can be organised in several ways.
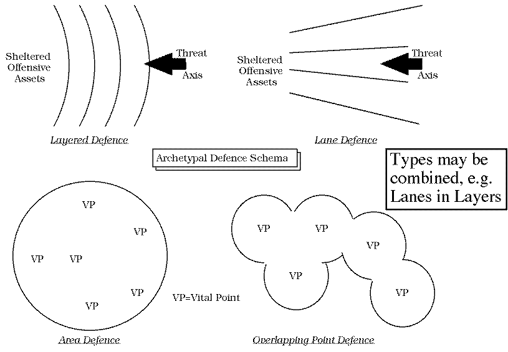
Simple layered defence consists of a number of layers, usually comprised of different kinds of defence mechanism, facing a potential intruder such that each layer has to be breached successively. NATO Air Defence in Western Europe was organised into layers after World War II; each occupied by surface to air missiles (SAMs), air defence fighters and other weapons as required. One advantage can be seen in this case: separating a SAM layer from a fighter layer reduces the risk of Blue on Blue, as accidentally shooting down own fighter with own SAM is euphemistically called.
Figure 5 shows lane defence at the top right. Territory is divided into lanes, each being the responsibility of part of the defence force. Lane defence might used when the defenders have no particular territorial advantage, and they wish to patrol so as to detect and intercept an enemy as soon as possible. At one time, the air defence of the United Kingdom was organised along these lines. It is possible to combine layered and lane defences, by inserting lanes in one or more of the layers.
The lower diagrams in Figure 5 show two kinds of point defence. At left, a number of vital points (VPs) are protected as a group by an umbrella defence. This would typically comprise a number of defensive weapon systems so co-ordinated as to provide a single area-defence shield. At right, several VPs are point-defended, but the VPs are so distributed - by chance or arrangement - that the separate point defences together form a barrier, or possible even a layer. Overlapping point defence has the potential advantage of concentrating limited firepower to the greatest possible degree; it can also be organised to present successive layers towards potential intruders.
Police pipeline architecture
Police information systems (IS) are fast becoming more sophisticated as societal crime and conflict spirals. Police IS are important in the context of Defence and CIS for two reasons:
- Unlike many military organisations, police generally live with their systems. During peacetime, the military may exercise occasionally as need and money permit. Police have no “peacetime”, so their systems tend to be pragmatic, affordable and continually evolving.
- With peacemaking and peacekeeping becoming part of the military mandate, there is a need for military and police to work jointly, with a concomitant need to share intelligence, co-ordinate activities, and so on, as in the former Yugoslavia.
The coupling of military and police information systems seems inevitable, but is not as simple as it might seem. The two kinds of force operate under diametrically opposed philosophies, at least in some areas. Indigenous police forces often operate to a minimum force criterion. Military forces often operate at a much “hotter” level, being less disinclined to apply “extreme force”.
Figure 6 shows a typical police architecture outline, going from Command and Control at left, to Criminal Justice at right - hence the term “pipeline”, describing sequential processes. In fact, the dotted line in the figure suggests that the “pipeline” might be bent into a circle, forming an overall integrated system concerned with maintaining societal stability.
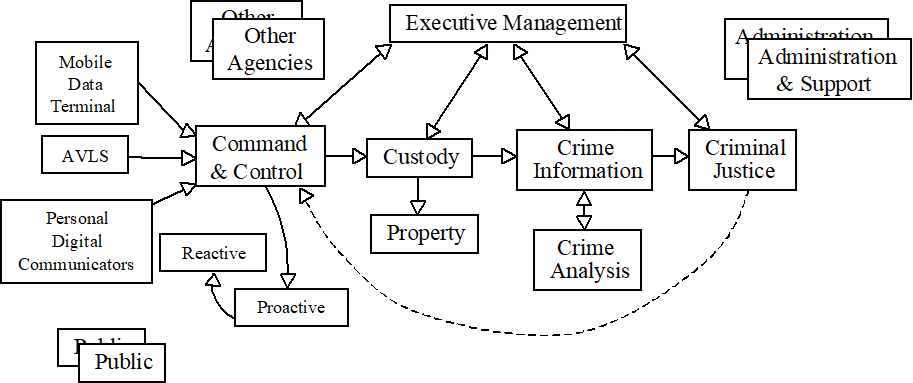
Command and Control (C2) is both reactive to incident, and proactive in intelligence gathering and in anticipating incidents. Recent technological developments include:
- automatic vehicle/ officer location systems (AVLS/AOLS);
- two-way digital communications;
- video links from officers to C2;
- flip-down helmet mounted displays; and
- digital voice recording.
Much of this technology mirrors warrior-centred approaches, although generally lagging behind them at present.
Typical Interacting Command Architectures
Figure 7 shows a notional politico-military multi-CIS organisation for an international joint peace-keeping operation. Concealed within each of the rectangles and ovals are further, nested CIS architectures. To a greater or lesser extent, they interact and impinge upon each other, passing (or failing to pass) information, competing for time-bandwidth, mutually interfering, etc. Some CIS come to this arena ready-formed and either evolve in vivo or fail to perform effectively. Others form ad hoc, and evolve as swiftly as resources and direction will allow. Establishing and maintaining coherence in this veritable jungle is not simple.
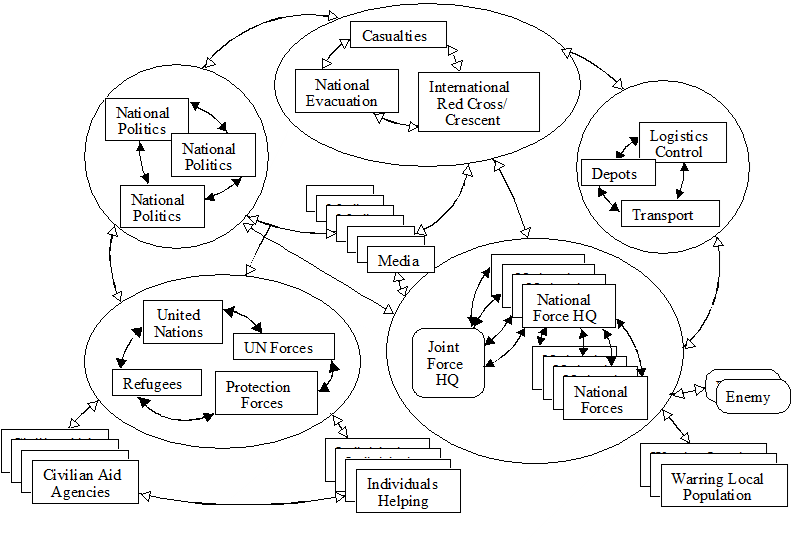
Less obvious, perhaps, is the dynamism of such complex, interacting architectures. This factor, examined later, is central to development of robust adaptive architectures.
Layered architectures
Learning from history
History suggests that designing systems to be optimal from scratch is “difficult-to-impossible”. The best systems evolve. As in nature, this requires harsh, varied, testing threat environments, real failures, trial and error to achieve better results, all of which demands time.
By contrast, many present-day unprecedented systems have never tested in anger: will their designs prove effective…? It may be possible to draw some lessons from history, but you have to read history carefully and translate the lessons into present and future contexts.
…so, how many layers?
The first question that comes to mind when considering layered architectures, particularly for defence is: how many layers are needed?
Figure 8 shows a photo-enhanced view of Maiden Castle, an early British hill-fort that evolved over some 1000 years. During that time, the number of layers (ramps and ditches) increased, ending up at about seven (the number varies around the ring, especially near entrances).
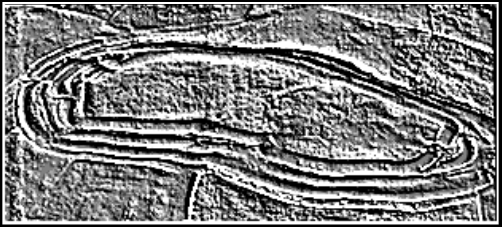
The value of seven, or to be more precise, the minimum value of seven appears frequently and, as we shall see, not just in ancient castles.
Classic castle security
Castle designs were, from antiquity, layered to present a would-be invader with a series of difficult hurdles to overcome. Space became important to defensive strategy. If it were possible to break the aggressor’s force into small groups, then defenders might overcome them (a military form of peristalsis). From this emerged the motte and bailey design and the concentric wall design.
Beaumaris castle, ad1295
Figure 9 shows concentric medieval castle design - successive lines of defence - from the air.
![Beaumaris Castle - concentric design [2].](/journals/journal-of-battlefield-technology/volume-01/issue-03/assets/1-3-3-hitchins/figures/figure09.png)
Contemporary layered architecture - secure area
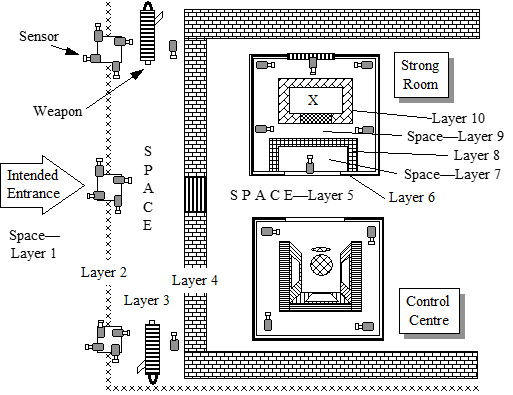
Figure 10 show a schematic of a modern secure area, which can be seen as a series of layers designed to prevent an intruder from reaching the spot marked X. The figure shows 10 layers, but such secure areas might have more or less, and few in the Western world would countenance automatic machine guns. Nonetheless, such facilities are to be found in some countries, world-wide. Notice the use of space to provide sanitised zones, and the vulnerable node created by the single control centre with its communications focus.
Simple multi-layer maths
Simple analysis of multi-layer defences reveals how we might produce effective, economical designs in modern systems, defensive and non-defensive.
The following equation uses the concept of neutralisation and assumes that each layer has an identical probability of neutralising an intruder passing through the layer:
P = 1 - (1 - p)N (2)
where:
- p is the neutralisation probability per layer,
- N is the number of layers, and
- P is the expected overall neutralisation.
The equation is an approximation, since the individual layers might well have different neutralisation probabilities, but that eventuality will be addressed later. Meanwhile much can be learned from the simple formula.
Figure 11 shows the overall neutralisation probability for different numbers of equal performance layers. The straight line corresponds to only one layer, and it can be seen that a high neutralisation probability is required for that singular layer to be effective. With four layers, say, the same overall performance can be produced with each layer being less effective. So, 0.8 (80%) overall neutralisation requires 0.8 neutralisation from one layer, but only 0.38 (38%) per layer from four layers.
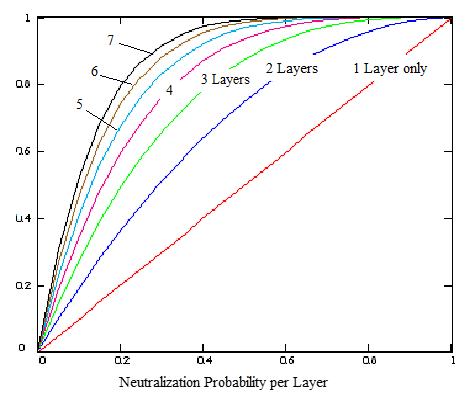
A solitary layer must give very high protection. On the other hand, the difference between six and seven equal layers is tending to be small, while the difference between twenty and twenty one layers (not shown) is negligible. Clearly, some law of diminishing returns is in operation. Perhaps this explains why seven is a common minimum number of layers.
Risk reduction
A second aspect is vulnerability to loss of a layer. One layer alone is highly vulnerable, since its loss is catastrophic. With two layers, losing one still leaves the other. This raises the question of degree of vulnerability to single layer loss. For instance, with two layers, is there a probability value that would maximise or minimise vulnerability to single layer loss?
Vulnerability is explored in Figure 12, which has the same underlying format as Figure 11. Overlaid are two loci, which together bound the largest gap between successive layers. So, losing the only (assumed perfect) layer causes a drop from 1.0 to zero.
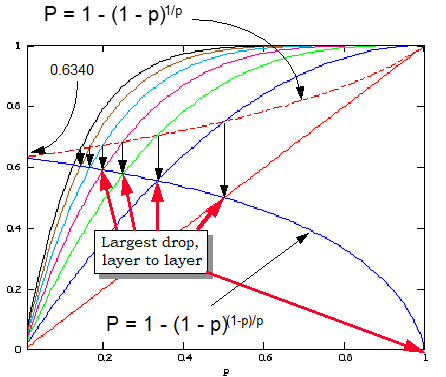
The largest drop in overall performance with two layers occurs when each has 0.5 (50%) probability of neutralisation. Operating with four layers, the largest drop occurs when each layer has 0.25 (25%) neutralisation probability. In general, the greatest drop occurs at a value of pv = 1/N, where pv is the single layer most vulnerable probability.
This maximum drop value, pv, is one to avoid, since it represents the point of greatest vulnerability in overall performance. Ideally, the individual layer probabilities should be higher than pv. So, for N = 4 layers, for instance, p should be greater than 0.25. Examining Graph 2 shows that relatively high values of p have to be invoked to make significant difference at N = 4. Values of p≥0.7 are required to make a significant reduction in vulnerability to single layer loss. Similarly, for seven layers, pv = 1/N = 0.14. p should exceed this vulnerable point value. Significant reductions in vulnerability are evident from the graph for values of p≥0.4 per layer.
A more considered view of the optimum value for p under different conditions can be formed using Figure 14, which presents the neutralisation equation in three dimensions. The downwards arrows show conditions which are on the edge of giving 100% performance, which is represented by the lower right hand corner of the graph.
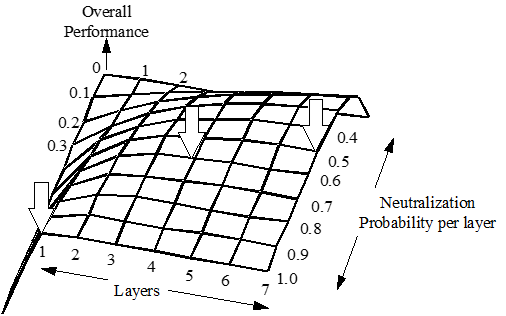
We have seen that increasing the number of layers operates under the law of diminishing returns, so to go beyond some sensible limit is to waste effort, time and money. The arrows on the graph point to some values of that sensible limit:
1 layer at p = 100%;
4 layers at p = 60%; and
7 layers at p = 50%.
Each of these conditions results in the same overall neutralisation performance as derived from the equation.
Multi-layer defence dynamics
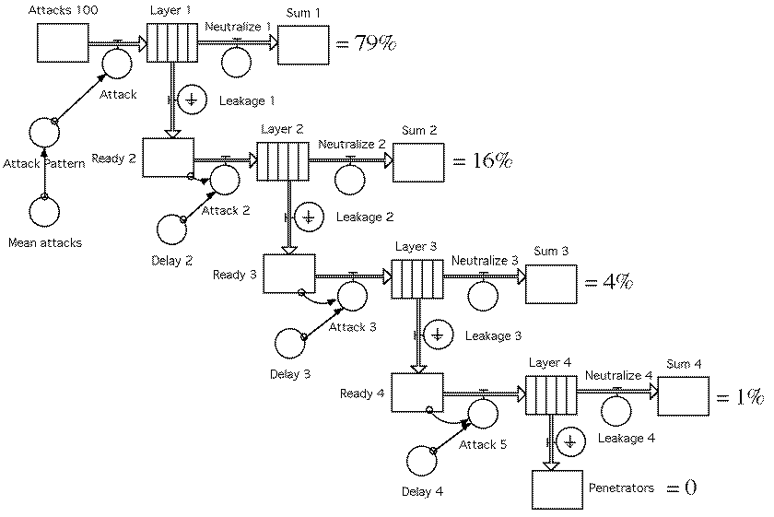
Foregoing analysis has been static, in the sense that calculations assumed that layers did not change, and that each layer had no effect on those before or after it. In many cases that is not true, and dynamic analysis is more applicable. Dynamic analysis is straightforward using suitable modelling tools, such as that employed in creating the model presented at Figure 11. The model consists of four virtually identical rows, each running from left to right, each representing one layer.
In each row, the rectangle at the left of the row contains the resource of would-be penetrators of the respective layer. The middle rectangle is marked with the layer number, and divides the would-be penetrators into Neutralised and Leakers, respectively. Leakers pass to the next layer, where they become the would-be penetrators for that layer, and so on. The top left box contains 100 attackers, so that the boxes at the right accumulate the proportions of 100 (that is, percentage) attackers neutralised in their respective layers.
The whole model is a continuous time simulation. Each attack can be represented by differing probabilities of penetration through each layer. Each layer can delay each attacker by different amounts. And, of course, the number of layers can be varied simply by adding or subtracting rows. The figures at the right show the results of one particular “run” in which there was a value of 25% leakage probability per layer, with a transit time = Exprnd(3) per layer, where leakage probability = (1-neutralization probability per layer, p).
(N.B. It is often more convenient to think in terms of leakage, than neutralisation. Clearly leakage goes down as neutralisation goes up, and vice versa.)
The model of Figure 11 can be used to explore:
the number of layers,
different layer types, and
stochastic variations.
It can also be used to explore such notions as: should the outer layers be more effective that the inner layers, or the other way around, or does it make no difference? By running the model many times with differing configurations of layer leakage probabilities, Figure 15 emerged.
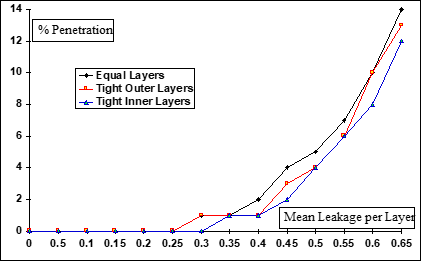
The graph shows three curves, each representing a different configuration of layer-to-layer leakage parameters:
- Equal Layers. Simulation runs were made for values of leakage-per-layer from 0 to 0.65, with layers having equal leakage.
- Tight Outer Layers. A second series of runs was made, but with the outer, or initial layers having a higher than average neutralisation, and the inner layers having a less than average neutralisation. The average neutralisation corresponded to the equivalent run for equal layers.
- Tight Inner Layers. The third series of runs was similar to the second series, but with layer neutralisation higher on the inner layers and lower on the outer layers.
Against intuition, perhaps, best overall performance (lowest penetration) corresponds to tight inner layers, i.e. loose outer layers. Analysis of the model showed that this arises because of more even workload share between layers.
It would be imprudent to use this result without care. While it suggests ways of spending and saving money and effort using asymmetric layer performance, there is more to it than simple calculation. Reductio ad absurdum suggests that the outer layer might diminish towards zero, which violates common sense; besides, the outer layer has special psychological importance and significance, beyond mathematics and dynamic models.
People form an intimate part of living architectures, for maintenance, adaptation and operation. A basic philosophy is important for the operation of multi-layered defences, with the following principal factors to consider:
- Should a defensive system, with architecture as its enabler, be highly automated, or dependent on smart people? Intruders have initiative, surprise, and the latest technology at their command. Smart defenders are essential to anticipate and counter such intruders but the defenders need sound sensors and control systems. So, highly automated for routine activities, but accessible and adaptable to smart defenders for sound defence.
- Independent layers, or layer-to-layer co-ordination? It is straightforward to show that layer-to-layer co-ordination has the potential for the highest overall performance from a given defence resource, see following bullets. If layer-to-layer co-ordination creates a control node, however, then the whole structure may collapse if that node is compromised. In such cases, independent layers are more effective, because they are more survivable - being independent; if only one survives, there is still some defensive capability.
- Where the issue of the vulnerable node can be overcome, co-ordination enables forces to be allocated where needed, improves efficiency and effectiveness. Co-ordination + mobile force = force multiplier. (Force multiplier is the term used by military forces to indicate that small forces can have the effect of much larger forces given suitable resources for sensors, communications, mobility, fire power and fire concentration)
- Figure 16.Advanced, multi-layer defence command and control organisation.Figure 16.Advanced, multi-layer defence command and control organisation.Deter or neutralisation? Deterrence assumes that intruders have the same mental model as defenders, which may reduce the incidence of attacks, but it carries a risk - it is undependable. In the final analysis, the irrational attacker must still be neutralised so, while deterrence may reduce frequency of attack, it does not reduce the need for robust defence.
- Defend, or attack too? Perfect defence is impossible, so good defence involves intelligence about the enemy’s current activities and future intentions. Best defence adds the ability to neutralise potential attacks before they are mounted.
- Command and Control is required to co-ordinate security and defensive assets to: Deter; Counter Aggression; Face Changing Threat; Counter Diverse Threat Elements; Protect Own Latent Offensive Forces; Distinguish Friend From Foe, Especially Own Returning Offensive Forces; Survive; Avoid Detection; Prevent Interception / Exploitation; Defend Defensive Assets; Defend Own Control; Tolerate Damage - Redundancy, Reconfiguration; Be Available, Reliable, Dependable, Maintainable, Transportable, Mobile; and Win the Long-term Cost-Value Exchange Ratio Battle: Cost of Security/Defence; Value of Assets saved.
Advanced multi-layer management
Figure 16, taken from early Strategic Defence Initiative (SDI) thoughts, shows schematically how a multi-layer defence command and control architecture might be developed. Running from left to right are the management controls for three successive layers. Each layer follows a process called pipe-lining, in which targets may be thought of as progressing through a series of pipes. In sequence, they are:
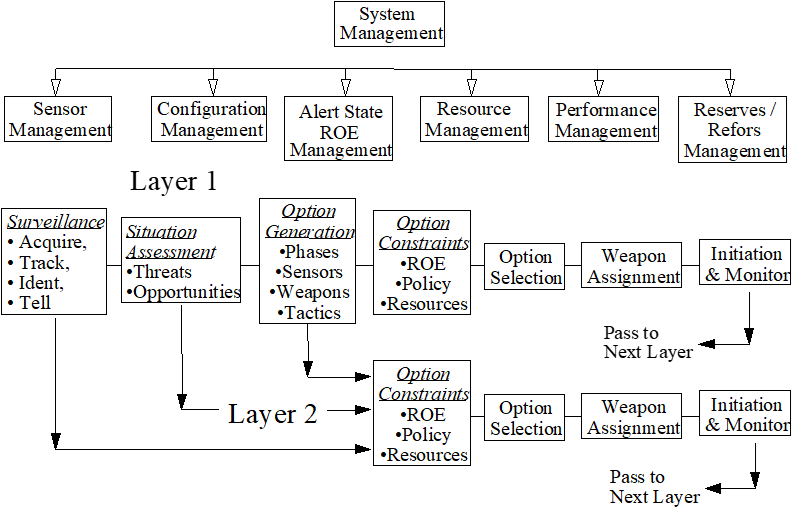
Surveillance
Situation assessment
Option generation
Option constraints
Option selection
Weapon, or response, assignment
Initiation and monitor
The last four pipes, or process layers, are repeated in following layers so that an intruder who survives the first layer is handed over to subsequent layers. Note how the command and control, or management, organisation reflects the physical layering.
Running orthogonally down the figure are the elements of management that relate to each and every layer:
- Sensor management, the optimum allocation of sensors to enable each layer, substituting good sensors for failed, poor, or damaged sensors, etc.
- Configuration management, the rearrangement of sensors, defences, layers, and so on, to accommodate shifts in threat, accommodate damage, use reinforcements, and so on.
- Alert State and Rules of Engagement Management (ROE) - the ability to raise or lower the stakes, an essential feature of effective management, particularly in politically or socially sensitive situations.
- Resource Management, to reallocate resources in real time according to the demands of the enemy, casualties, and so on.
- Performance Management. Monitoring overall performance, identifying strengths and weaknesses, redesigning architectures, organisations, retraining, and so on, and evolving improved performance.
- Reserves and Reinforcement (Refors) Management, drawing upon backup forces.
Developing architecture from task, activity and process
So far, we have considered the evolution of architecture, generally under real pressures from real environments. This takes time and the evolution progress to a large extent via trial and error. It may be more practical to evolve architectures in vitro.
Of particular value would be the ability to generate robust architectures to enable and support processes of all kinds. Using selected tools and methods, that is indeed possible, and without the (often unreasonable) presumptions frequently employed by methods such as Business Process Re-engineering (BPR). For instance, it is unnecessary to predict the duration of a task or process. In BPR, this foreknowledge is often considered essential, even although in the real world the duration of a task or process may be dependent on the thoroughness (or otherwise) of preceding activities, generally unknowns in BPR.
As an example, consider the development of an architecture for a business organisation, as follows:
- Step 1. Identify separate Tasks, Activities, and Processes, for example: Acquire Suppliers; Order Parts; Receive Parts; Assemble; Test Assembly; Sell; Make Profit; Survive; Repair; Supply Parts; Train Repairers; Innovate Design; Attract Designers; Improve Quality; Conceive; Design New Product; Design New Process; Prototype Product; Engineer Process; Acquire Markets; and Maintain Workforce.
- Step 2. Establish relationships between every task/activities/process on a pair-wise basis (using SAATY’s technique).
- Step 3. Develop architecture using layers and clusters emerging from relationship matrix - using Warfield’s Interpretive Structural Modelling (ISM).
Saaty’s pair-wise comparison technique involves examining the relationships between every activity and recording the response to a question such as: “does Activity X strongly contribute to Activity Y, or is it the other way around, or is there no relationship?”. Interpreting the resultant matrix (Warfield’s ISM) reveals layers, sequences and clusters which form architecture and provide a basis for organisation.
The result of the architecture development is shown in Figure 17. Architecture tends to form along the lines of activities as they form discrete processes. Three distinct groupings are visible in the figure, each containing a set of sequential activities, each supporting the same overall mission, Survival.
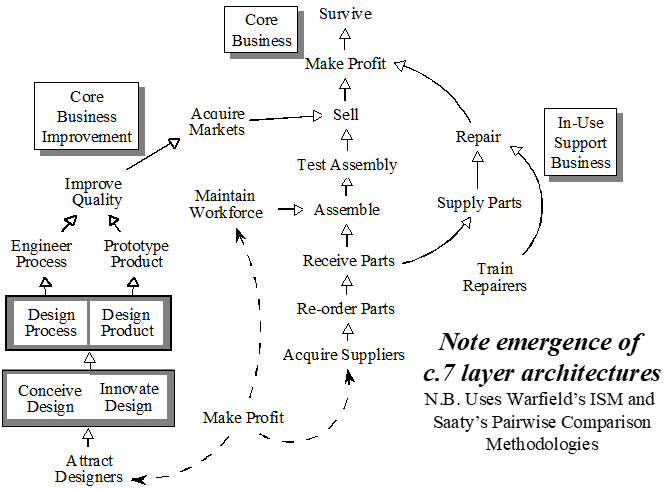
The three groupings are:
- Core Business. The core business is seen as maintaining the flow of goods from suppliers, through assembly and sales into the market place. This is a steady, continuous business.
- Core Business Improvement. Core Business Improvement is about creating new, innovative products and processes, and improving quality so as to acquire expanding markets, or at least to hold position in current markets.
- In-Use Support. The business of providing support to existing customers, either by repairing defective products or, as the figure implies, by supporting a repair business in the market-place. Training repairers suggests that the repair business might, for instance, have been set up as a franchise.
The three businesses each contribute to making profits and hence to Survival. Interestingly, this approach to architecture always shows, since profit contributes to survival rather than the reverse, that Survival is the end goal, in line with the Japanese philosophy of Kokusanka. Note that Make Profit appears twice (to simplify the diagram), indicating nonetheless that the whole structure is maintained from profit, and that the effective flow of activities would stop without profit.
The development of a process-based architecture, as shown in this example, could be a pre-cursor to creating a purpose-driven physical architecture. Were a building to be constructed to the same layout as the identified core business process sequence, say, with space for resources created alongside the relevant activities, then there would be match between function and form. This match would, in principle, minimise organisational entropy and reduce internal energy. (Research into the design of ancient Egyptian temples suggests that the processes of mummification shaped the temple architecture.)
ISO open systems (7 layer) interconnection
Figure 18 shows the concept of the International Standards Organisation (ISO) Open Systems Interconnection (OSI). The OSI is a modern icon for layered protocols. Each layer builds upon the services provided by the layer below, to provide expanded services to the layer above.
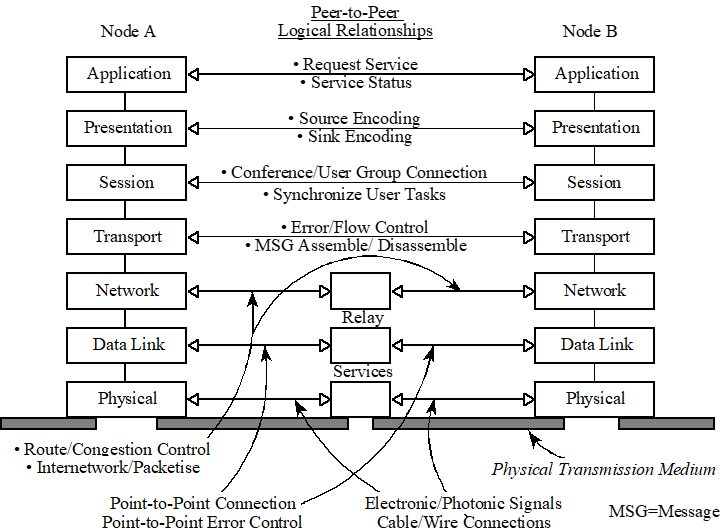
Physical connections between nodes travel down one side of the ‘U’, through the physical medium, and up the other side, but each layer has its own protocol which logically communicates horizontally to its opposite number. The three lowest layers have dual purposes, enabling relay of information from node to node, across networks, etc.
Prior to the advent of the OSI, manufacturers developed their own layered protocols, which could not interoperate. In principle, OSI offered a single standard. OSI also provides a framework for discussing and understanding the processes of open connections between heterogeneous computer systems running the same, or complementary, applications.
However, full implementation of OSI might result in slow communications in unsuitable situations. In its straightforward form, it is more suitable for transaction processing, rather than for highly reactive tactical systems. Some tactical protocols do map on to the OSI. For example, the US automotive industries’ MAP fits broadly at layers 1, 2 and 7 (that is, point-to-point only). It is possible to construct architectures from the OSI for wide area application, using MAP for tactical, fast action spurs.
Similarly, JTIDS (Joint Tactical Information Distribution System) or MIDS (Multi-function Information Distribution System) a sophisticated communications, navigation and identification (CNI) system used by some NATO military, does not employ the OSI in discrete layers within its electronic hardware or software; the functions identified by the four lowest OSI layers are affected by JTIDS, however, and the protocol provides a useful framework for examining and understanding JTIDS operation.
Does OSI stand up as an architecture?
Strictly, the OSI is a layered protocol, not an architecture, nor is it strictly a system. OSI lacks some essentials of an effective architecture, for instance the essential knowledge about its own facilities, locations and status. Features can be added to acquire such knowledge and, together with maintainers and operators, provide many features of a good architecture - a good architecture is not just a structure, but the also people and resources within it who adapt and respond to threats and opportunities
Layered architecture - summary
There does appear to be a math-based science founded on ideas of successive processes.
There appear to be many architectural features, which require explanation and which can enhance understanding between the many architectural domains. Outstanding major questions remain:
- Can we “measure” one architecture as “better” than another?
- Can we determine the “goodness” of an architecture?
Examining clustered architectures may give a clue.
Clustered architecture
The essence of architecture – 2
Systems architecture can be thought of as the organisation and grouping of things for some purpose - see Figure 4. Architecture, then, is servant to some higher purpose. Systems engineering architecture tends to afford the foundations of performance, rather than aesthetics.
Often, interchange of substance or information between parts within a system is easier, uses less energy, or is simply faster, if distance between parts is shorter or resistance to movement is reduced, or both.
For instance, the limiting speed of a processor chip may well be determined by the speed of light in conductors within the chip and hence by the distance between interacting chip elements - registers, adders, etc. Clearly, in such cases, performance can be potentially improved by moving parts closer to each other, or clustering.
Moving two parts closer to each other to improve mutual interchange may extend other links. There is likely to be some optimum arrangement, which improves overall performance, rather than the performance of an individual pair of parts. In such cases, architectural design centres on finding this optimum for the whole system.
Clustering reduces disorder, or entropy. The concepts of entropy and of entropy reduction are at the heart of systems and systems engineering. In particular, configuration entropy is important, that is the disorder in pattern and organisation. Clustered, ordered, related entities exhibit reduced configuration entropy.
Example clustered architectures
Figure 19 shows two typical clustering schemas. At left is a hierarchical approach in which there is a central sun surrounded by planets, each surrounded in turn by moons.
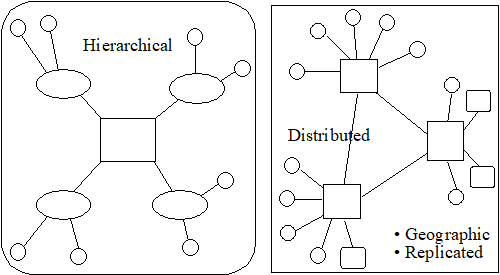
At right is a distributed architecture, with no central sun. Each square node can be part of another network, or could be the sun in a hierarchical system.
Adaptable architectures
Figure 20 illustrates an important issue, currently taking centre stage - should architectures be adaptable and if so, how?
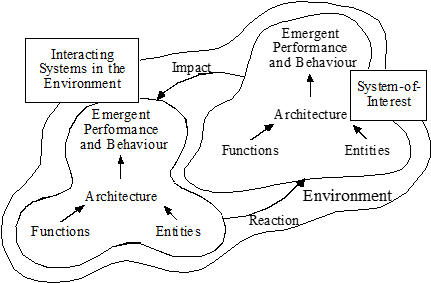
As the figure illustrates, the architecture of any System-of-Interest (SOI) contributes to that system’s Emergent Performance, Form and Behaviour. These, in their turn, impact on interacting systems and on their mutual Environment. Interacting systems counter-react in their turn, requiring adaptation of the SOI - if it is to pursue optimal organisation.
So any SOI either adapts to reaction, anticipates reaction, or remains non-optimal.
Optimising architecture - by genetic algorithm
As we have seen, Nature’s architecture “design” evolution takes time. So does the evolution of man-made architectures. Examining the record of any major achievements tends to reveal a catalogue of false starts, renewals, failures and occasional successes. The design of suspension bridges is marked by the Tacoma Narrows disaster. The design of airships was virtually halted by the R101 disaster. Racing cars evolve through trial and (often fatal) error.
As the situation becomes more pressing, designs become more innovative. Burglar alarm systems are becoming more sophisticated to cope with increases in the crimes of burglary and theft, but it is never possible to be sure about their effectiveness until they are tested in anger, by which time it may be too late. Many present-day secure systems are never tested in anger. Is it possible to know whether the designs are effective before the event?
Once the essentially-dynamic nature of effective architectures, and their mutual interactions, are appreciated, it becomes evident that the creation of effective architectures is:
- related to contemporary environment;
- affected by the parallel evolution of interacting architectures;
- therefore, essentially fluid over time; and
- architecture changes, but slowly compared with the processes, which flit across its surfaces.
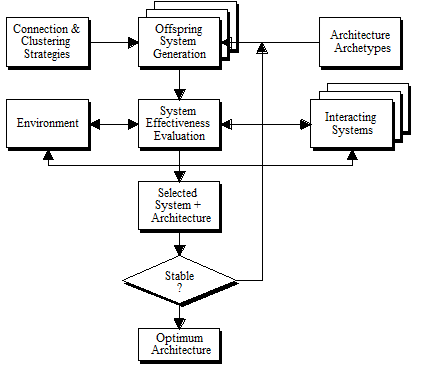
Figure 21 shows one approach to evolving architectures. The method has been proto-typed and seems to be viable, although precautions and limits to the process are important. One of the key considerations concerns both the comparative and absolute evaluation of evolving offspring. A central issue, therefore, is the ability to meaningfully measure systems.
Architecture, systems and entropy
The underlying essence of “system” is order. Indeed it is not unreasonable to define a system as a ‘dent in the fabric of entropy”. Entropy may be a more fundamental measure of system than, say, Performance, Availability or Survivability. To be sure, these emergent properties are of great importance, but they do not describe the fundamental nature and characteristics of their system. It may be possible to show, for example, that system entropy determines and limits Performance, Availability or Survivability.
Entropy is a state function: it is determined by system state, not by system history. Entropy is extensive: it refers to the state of the whole system. The entropy of matter is related to the amount of energy that can be transferred from a system to others in the form of work. For a given system with fixed energy, the value of entropy ranges from zero to a maximum. At that maximum value, zero energy is transferable. At zero entropy, the amount of work equals the internal energy, which can all be transferred. These concepts from physics can be applied, carefully, to organisations and architectures.
Entropy can be measured in several ways, all of them equivalent. Thermo-dynamic concepts, the more usual basis, seem inappropriate to architecture. Configuration entropy, the degree of disorder in pattern, may be the most suitable form of entropy for architectural purposes.
Might it be possible to measure the “degree of system-ness” of any system (or architecture) in units of entropy - or neg-entropy? The lower the entropy, the greater order, and the more the degree of what-we-might-call “system-ness”. Reducing system configuration entropy groups related entities into clusters.
Configuration entropy - clustered, ordered, related entities
Reconfiguration may seem to be just rearrangement with little or no tangible benefit. Consider Figure 22. The connection logic is identical in the two diagrams of the figure, but the lower figure has been re-arranged to reduce the disorder. In so doing, a perception of three dimensionality emerges, owing principally to drawing conventions.
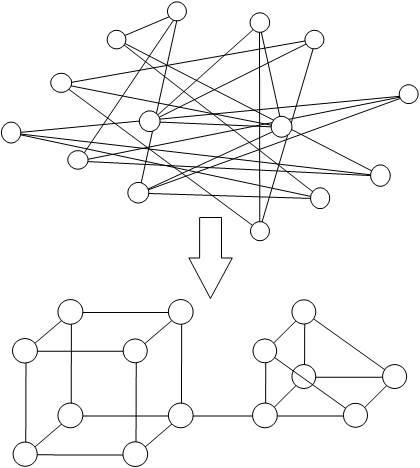
In Figure 18, some entropy reduction, at least, is real. The sum of all the link-lengths joining the entities is greatly reduced in going from the upper to the lower diagram. This shortening equates to untangling, hence to real entropy reduction.
Perception of 3-D in the lower diagram takes place in the cortex of the observer. If, as seems likely, the human cortex is highly evolved as an entropy reducer (qv) then the perception of 3-D produces a palpable reduction in mental entropy as the pattern is perceived.
We experience this mental entropy reduction as an “Aha” experience, as disorder slips into order, accompanied by a feeling of satisfaction and achievement.
The perception of 3-D in the lower diagram is, therefore, a real reduction in entropy, and is not to be discounted simply because it takes place on the surface of the brain rather than on surface of the ground. Is this, perhaps, where the art of architecture lies?
Where is clustering valuable?
The value derived from clustering depends on the nature of the system whose parts are clustered. Where there is advantage to the overall system from reduced time or energy utilisation in the interchanges between internal parts through internal infrastructure, then advantage may accrue from reduced overall link-length. This condition pertains for many systems but not for all.
Advantage may also accrue from proximity between some parts of one system and interacting parts of another system. In such cases there may be a trade-off between internal advantage and overall advantage. For example, analysis of aircraft under ground control shows that control reliability would improve if aircraft and ground controller were collocated. This is impractical. Hence an alternative strategy emerges–the provision of high-integrity, redundant communication channels between aircraft and controller.
There exists a simple, but useful, diagramming technique to aid in the appreciation and development of architectures, the so-called N2 Chart. An archetypal N2 is shown in Figure 23.
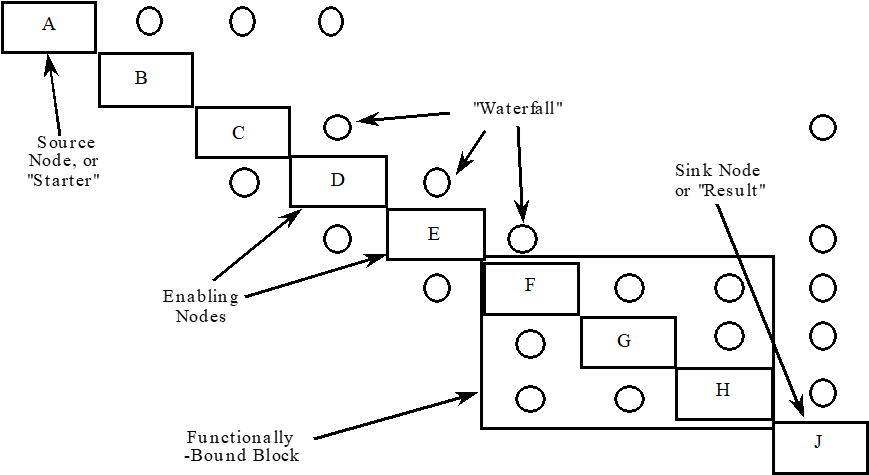
Conventionally, outputs run left-right from a leading diagonal entity, while inputs run up-down into a leading diagonal entity. In real systems, these output-inputs, or interfaces, form distinctive patterns, some of which are illustrated in the figure.
Most useful is the ability to use computing methods to rearrange the entities in such as way as to highlight patterns and, at the same time, reduce configuration entropy. Entities might be individuals, military formations, software modules, hardware subsystems, etc.
N2 and entropy
Configuration entropy is concerned with the number of different ways in which a set of entities can be arranged. It is an extensive property. The degree of entropy is increases with the number of entities in any system and with the number of connections/intra-connections between those entities.
As both entities and interactions rise, the opportunity for interactions within the system increases. It is possible for a system to comprise so many entities and intra-connections that interchanges between the entities can continue unabated with little or no input from, or output to, external systems or the environment. Such systems tend to be “non-linear”. Conversely, few entities and intra-connections result in low entropy, and little opportunity for internal interchanges. Such systems tend to be “linear”, that is the internal processes form a line from inflow to outflow with little “flow turbulence”.
This has significant organisational, management and CIS implications. C2/C3 designers are familiar with these ideas, although usually expressed in quite different terms, through the ubiquitous N2 Charts.
Entropy can be determined by the number of ways entities can be arranged (for N entities, = 2N–1). N2 chart can be scored to determine configuration entropy - the degree of disorder in the interaction pattern. N2 chart can be evolved using genetic algorithms to derive the minimum-entropy pattern.
(3)
Practical example of clustering
Consider the following example:
- A C2 Ops HQ comprises twelve cells – Intelligence, Situation Assessment, Operations, Logistics, Communications, Message Handling, etc., distributed on one floor.
- Individual tasks engaging C2 Ops HQ require one, two or more cells to respond in sequence, according to task type.
- The pattern of tasks is uneven, some types occurring more frequently than others.
- Cell staffs co-operate/co-ordinate by walking between cells.
- The existing room is the only suitable space available.
Can anything be done to reduce overall response times by rearranging cell layouts?
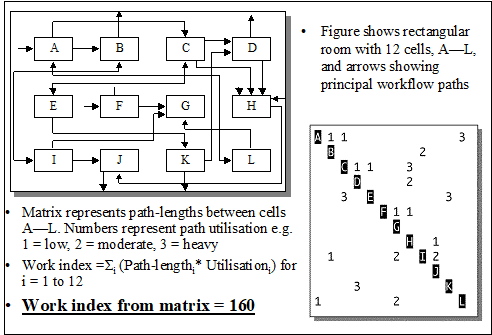
C2 ops hq example - before
Figure 24 shows the results of analysing the situation. Top left is the layout of cells and the interactions between them. At right, the cell interactivity is recorded in a computer-based N2 chart. A work index is formulated; it can be shown that this work index is a function of configuration entropy.
For i = 1 to 12
Work index=i(Path-lengthi* Utilizationi) (4)
The individual path lengths, and the number of times they are traversed, are taken from the N2 chart, giving a Work Index for the N2 Matrix of 160 path lengths.
C2 ops hq example - after
Turning a genetic algorithm loose on the N2 chart produces the N2 chart of Figure 25. Note how the pattern of interfaces has been linearised, with most lying near and parallel to the leading diagonal of entities.
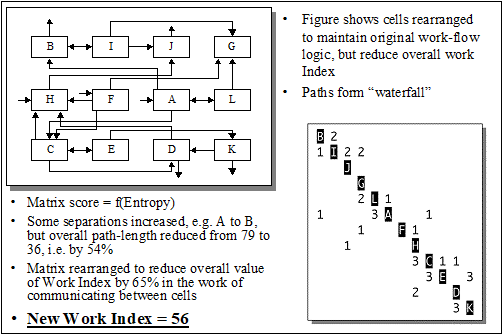
Mapping the revised matrix back into the operations HQ gives the layout diagram in Figure 21, and a revised Work Index of 56 path lengths. The revised layout has reduced the overall energy expended in cell interactions by 65%, and will have reduced the time to take group decisions. While the interaction pattern is still far from linear, the overall reduction in unnecessary work is highly significant.
The C2 HQ Ops example is but one of many. The clustering approach has great potential, and is particularly useful when it highlights counter-intuitive architectures. In particular, the genetic clustering approach:
- accumulates and analyses hard data;
- maintains an overview of the whole system, as an aggregation, not just of the parts, but of interactions/interchanges between the parts;
- enables optimisation of whole, rather than of each part piecemeal;
- provides real, measurable results; and
- offers basis for auto-adaptive CIS/C4I architectures.
The breadth of application is limited only by imagination of the user.
Clustering and symmetry
Using the N2 chart as a guide, it is simple to establish the potential number of links, L, between N entities:
L = N(N-1) (5)
For example, if N = 5, then number of links = 20, or if N = 20, then the number of links = 380. A system with five parts would spend some of its time processing inputs and outputs between those parts and their 20 links. A system with 20 parts might spend much, or all, of its time servicing the 380 inputs and outputs linking its parts.
“Over-connected” entities spend more energy processing interchanges than transforming inflows to outflows. In many systems, this would be sub-optimal, not only because of the energy of interchange, but also because of the complexity, entropy and mass of the consequent infrastructure. Many man-made and evolved systems seem to limit the number of connections. Human neurones tend to have a high number of connections, but the processing undertaken by each neurone may be as simple as ‘to switch or not to switch states’. The connections between major organs seem to be rather less, as are the connections between departments in an organisation.
There are essentially four approaches to managing the potential for over-connection:
- specialised interconnector-systems, which undertake only minimal processing of throughput;
- interconnection strategies to avoid full connection;
- staying in small sets, avoiding the combinatorial explosion suggested by Equation 3; and
- stochastic/chaotic connections that form and dissolve ephemerally according to need, resulting in a low, mean connectivity.
Connection symmetry and simplicity
Figure 26 shows sixteen entities, the small black circles; they could represent people, houses, computers, telephones, almost anything where connection is important. The particular connection arrangement shown in the figure, four groups of four, is one of many, as is the connection strategy which is known as “nearest neighbour”, since each entity is connected directly, but only, to its nearest neighbours. Beyond the nearest neighbour, communication occurs through an intermediary.
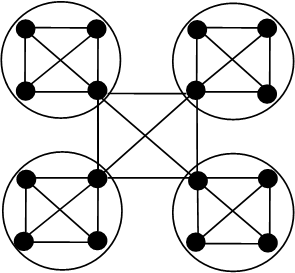
The numbers in Figure 22 were derived using Equation 5. As the numbers in Figure 22 indicate, any grouping arrangement other than the symmetrical one shown increases the number of connections.
These concepts and calculations lead to the following word equation, in which the arrow should be read as: “leads to”.
symmetryreduced connectivitysimplicity
reduced entropyreduced energy (6)
16 entities…
Single cluster, fully connected = 240 connections
2 clusters of 8 employ 114 connections
2 clusters of 6 + 2 clusters of 2 employ 76 connections
8 clusters of 2 employ 72 connections
4 clusters of 4 employ 60 connections
Humans evolve symmetrical groups, too. Cocktail parties evolve into similarly sized groups to reduce overall hubbub, and to enable easier discussion in groups. As people arrive to join a cocktail party and as the noise grows, more groups appear and groups tend to similar sizes. Were it not so, people in larger groups would be unable to converse with others opposite them in the group, while people in smaller groups would find themselves lacking entertaining variety.
Judging by the design of ancient and medieval architectures, and by the engineering teachings of the 1950s and 60s, the value of symmetry to reducing the infrastructure of clustered architectures may have been better understood in the past than it is today. The benefits are there for the taking.
Conclusions
- Architecture is not generally recognised as design parameter, but can be considered as a central discipline to advantage. Many aspects of systems architecture is amenable to rigorous scientific study.
- Increasing system complexity emphasises the value of optimal architecture:
- Since optimality is fleeting as the environment changes, there is a need for (auto-?) adaptive architectures.
- Designing, implementing and operating adaptive architectures requires a disciplined approach to the measurement of architectures as a precursor to comparing different architectures.
- There is also a need to have a rigorous approach to evolving architectures.
- The goals of sound architecture include:
- simpler, more efficient, more effective system; and
- adaptable, damage-tolerant, sustainable performance.
- The CIS community should adopt architecture as a central, formal design subject for hardware, software, systems, organisation, processing, networking, auto-adaptation…
References
[1] A. Friday and D. Ingram (eds), The Cambridge Encyclopaedia of Life Sciences, Cambridge University Press, 1985.
[2] D. Hitchins, "BM/C3 Design by Cumulative Selection", Third International Conference on Command, Control, Communications and Management Information Systems, Institution of Electrical Engineers, London, p. 304, 1989.
Derek Hitchins held chairs in command & control and system science at RMCS Shrivenham until he retired in 1994. He is still a visiting professor there, and he is busy as a consultant to the MOD and to the police. His other interests include egyptology and he travels the world talking about systems engineering and the pyramids. He lives in Weston-super-Mare, UK. He can be contacted by e-mail: Prof_Hitchins@compuserve.com